Keywords: Thermal Analysis, Isothermal Crystallization, Polypropylene, Polymers, DSC, Differential Scanning Calorimetry, DSC-Raman, Spectroscopy
TA383
Abstract
This paper presents an isothermal crystallization analysis of polypropylene by simultaneous differential scanning calorimetry and Raman spectroscopy (DSC‐Raman).
Introduction
Isothermal crystallization is a time‐to‐event DSC experiment. In this experiment, a sample is heated above its melt temperature to remove any crystal structure and then it is rapidly cooled and stabilized below its melt temperature. The time to crystallization is then measured. This paper demonstrates that Raman spectroscopy (Raman) can also be used to track the crystallization process. One advantage of Raman is that it permits detection of the process at temperatures close to the material melt temperature where DSC analysis is problematic.
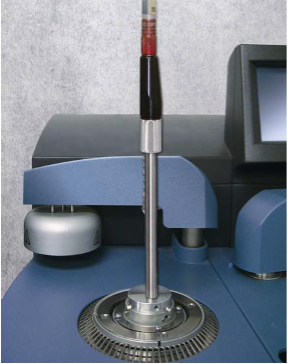
The combination of DSC with Near‐IR (NIR) or Raman spectroscopy simultaneously yields both vibrational and heat flow information for materials that undergo thermally induced solidphase transitions. The vibrational spectroscopy can provide information on the chemical or structural changes that are occurring in the material and this information compliments the heat flow data measured by the DSC. A TA Instruments Universal Optical Accessory is designed to interface with the Raman fiber optic probe and accurately position it directly over the sample in the DSC. Figure 1 shows a Raman probe from Kaiser Optical Systems1 interfaced with a DSC Q2000. Probes from most NIR/Raman manufacturers are compatible with this accessory.
Results and Discussion
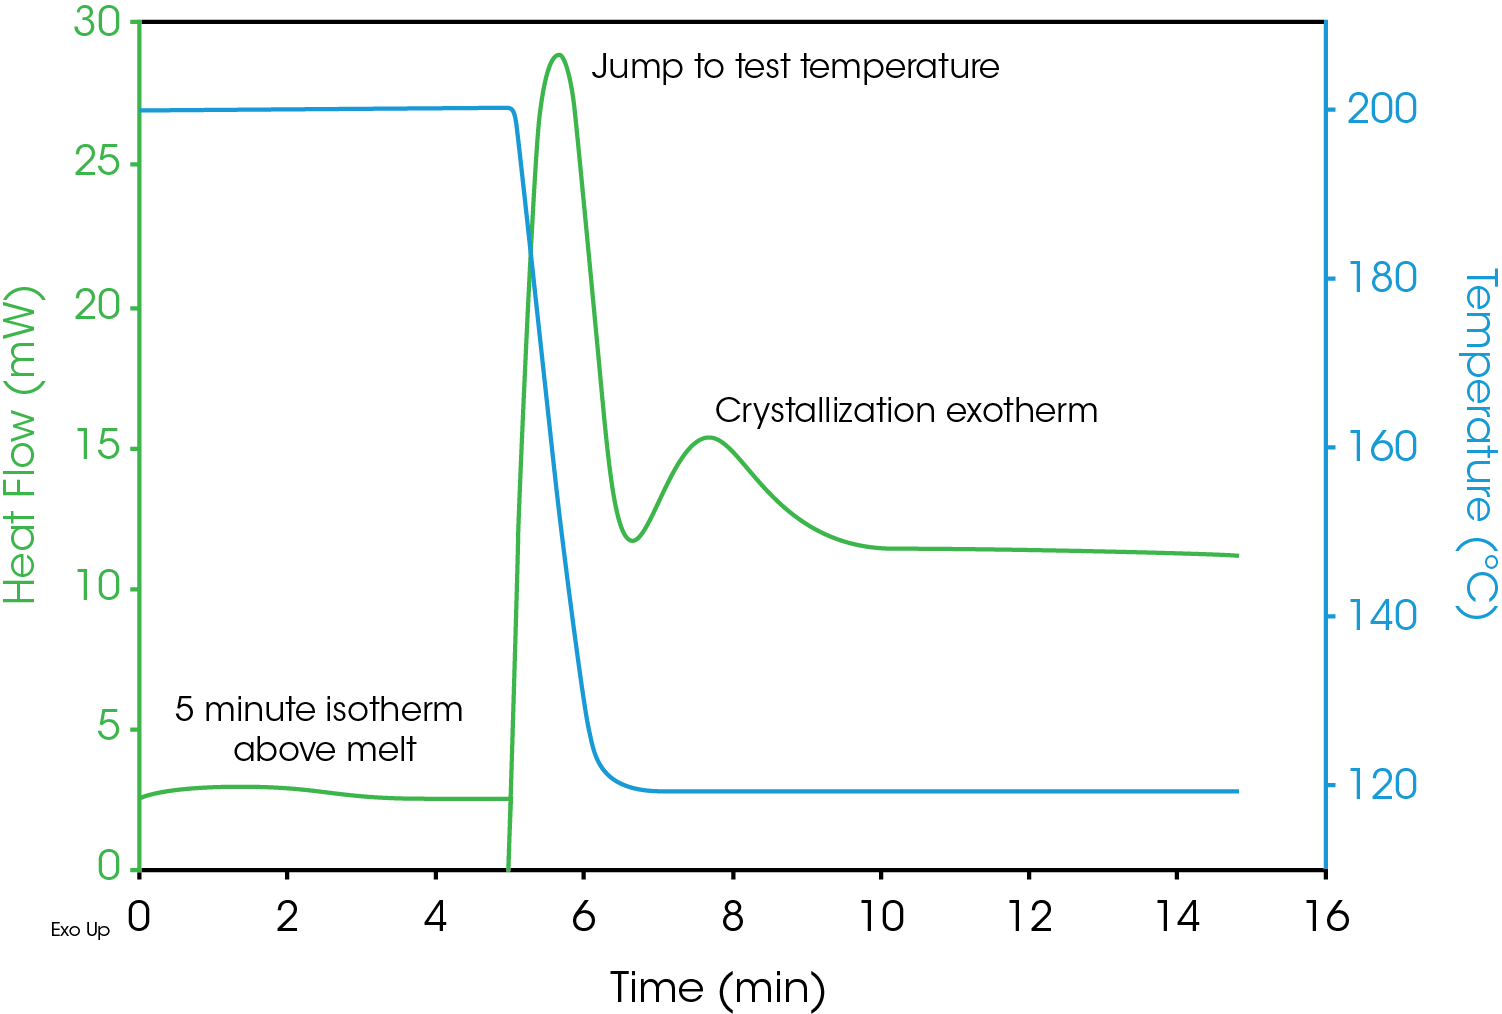
A 5.4 mg sample of polypropylene was placed in an open aluminum Tzero DSC pan. DSC data was collected using a TA Instruments DSC Q2000 with an RCS 90 mechanical cooler. The pan was placed in the DSC and a method was executed that first equilibrated the cell at 200 °C and held it isothermally for five minutes in order to fully melt the sample. The sample was then ballistically cooled to the test temperature and held isothermal until the sample was fully crystallized (as indicated by the heat flow data). The DSC results for a test temperature of 118 °C is shown in Figure 2. The sample is already at 200 °C when data collection begins. The plot indicates the area of the melt isotherm, the cool down to the test temperature and the capture of the crystallization exotherm. Data sets collected at multiple test temperatures can be used to study the kinetcs of crystallization.
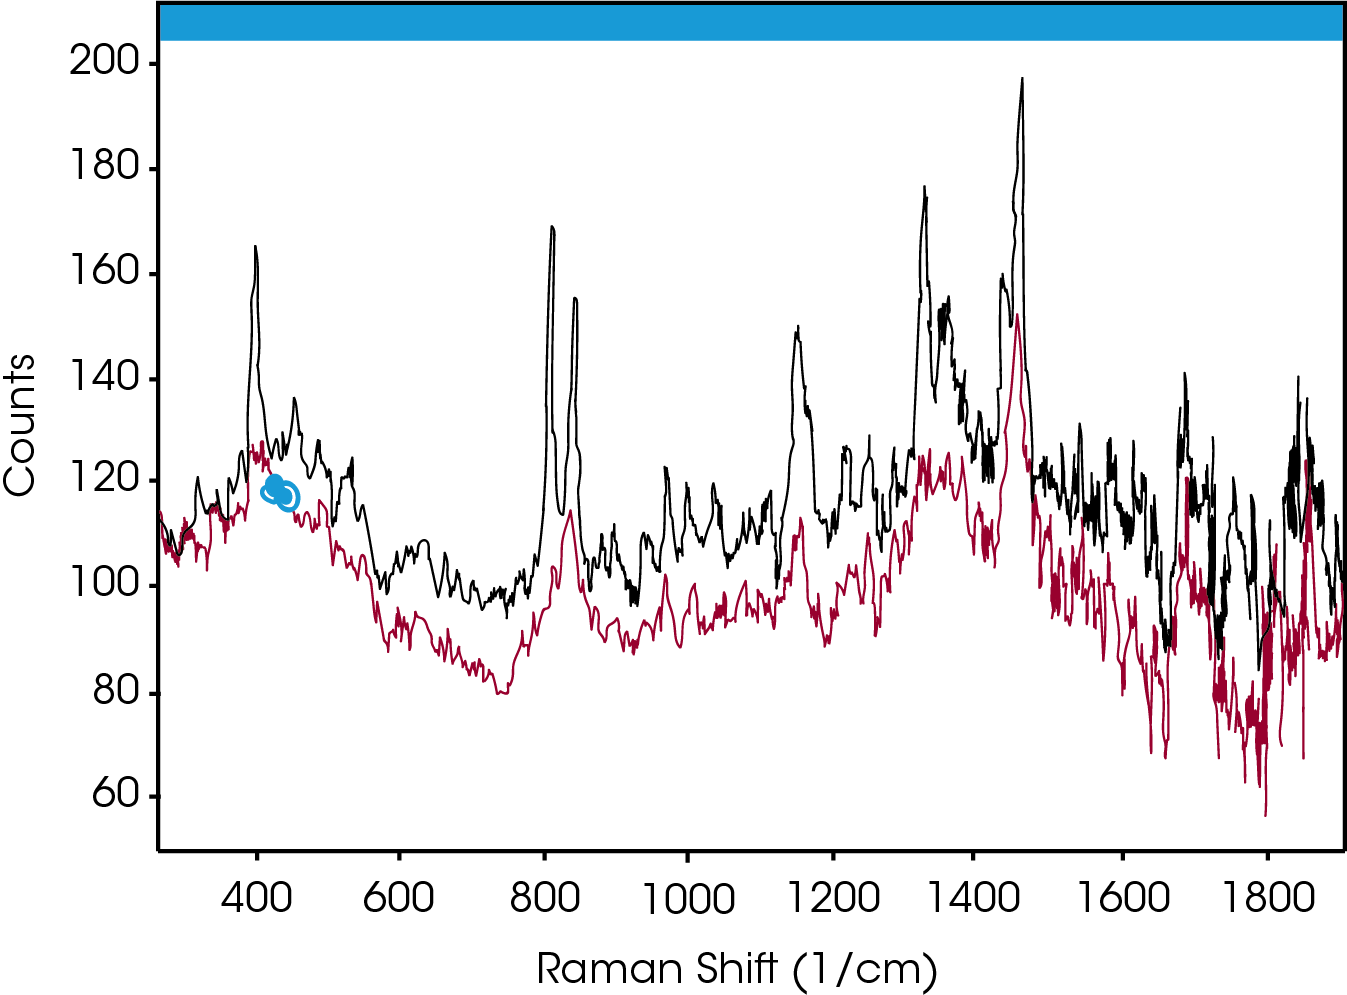
Simultaneous Raman data was collected on a Rama RXN1™ (Kaiser Optical Systems, Inc.) using a MR Probe and custom immersion1. The spectral range of the Raman instrument was 150‐3425 cm‐1 with a laser power of ~70 mW (25% full power) from a 785 nm laser. The Raman system was programmed to collect a spectrum every twelve seconds; each resulting spectrum was an average of three accumulations. When analyzing spectral data, it is common to look for shifts in peak positions or changes in peak intensities. Figure 3 compares the spectra of PP in the amorphous (bottom) and crystalline (top) states. As expected, the peak structure is very poor in the amorphous state, yet well‐defined for the crystalline state. Of particular interest is the change in the crystalline spectra double‐peak centered near 800 cm‐1. In the amorphous state only the right hand peak is present. In the transition from the amorphous to the crystalline state, the left had peak emerges and grows larger. Thus, the increase in height of this peak can therefore be used to monitor the crystallization progress.
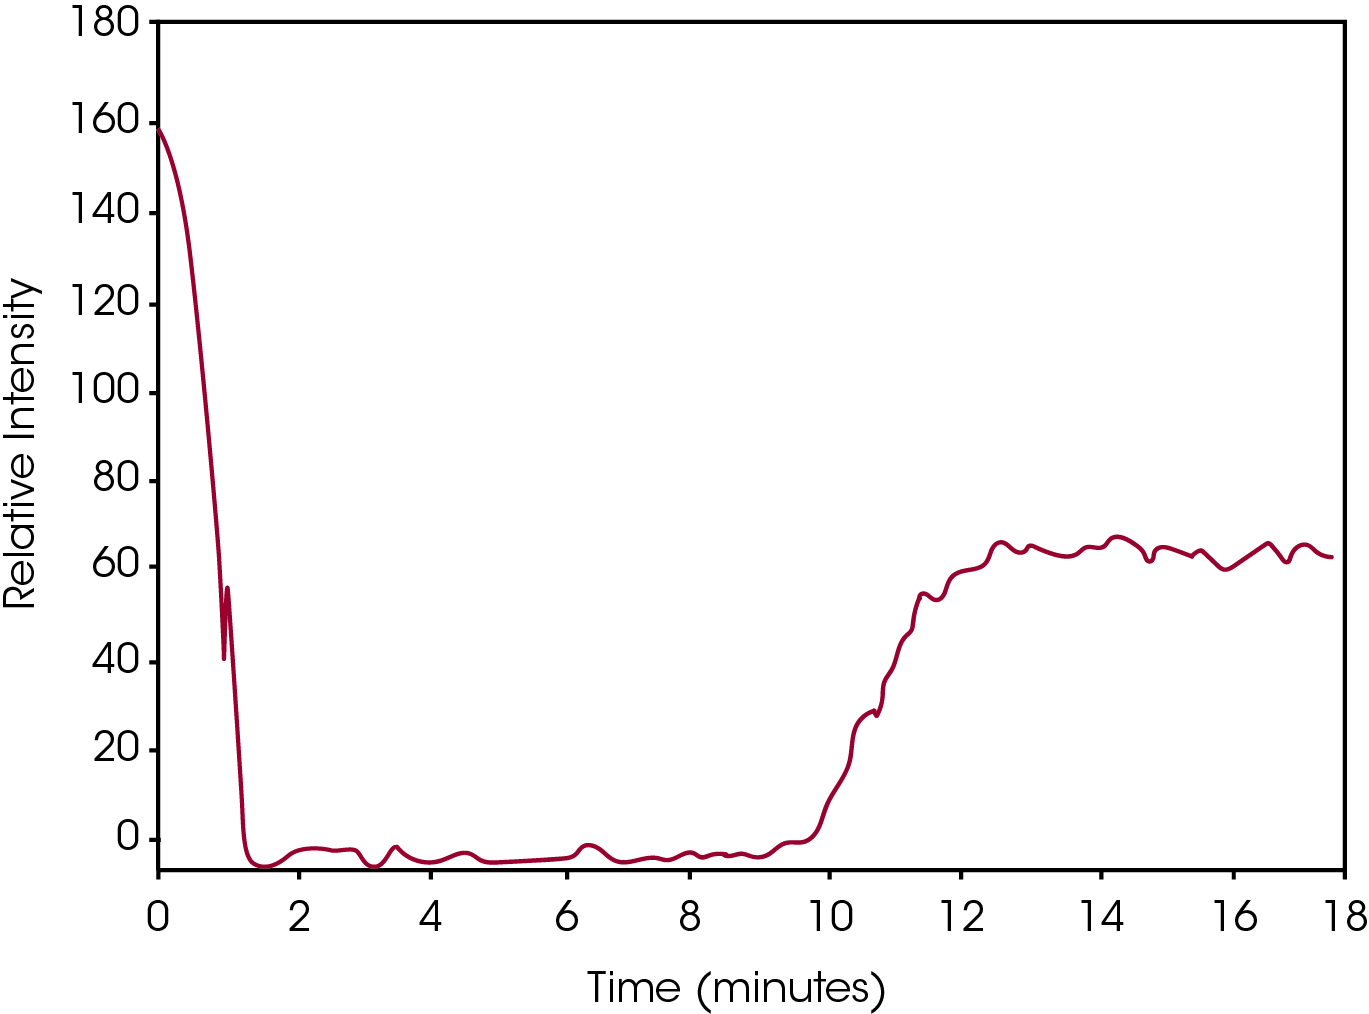
By plotting the height of the left hand peak, a visual graph can be constructed which tracks the isothermal crystallization event. This is shown in Figure 4. The drop in Relative Intensity to zero at the beginning of the plot is due to the melting of the crystal structure upon heating above the melt temperature. At approximately 8 minutes into the run the sample is cooled to the test temperature. At approximately 10 minutes the crystallization process begins as indicated by the emergence of a Raman band. Finally, at approximately 13 minutes, the Raman peak height is stable indicating the crystallization process is complete. This type of Raman data allows for the minute tracking of the crystallization process over time.
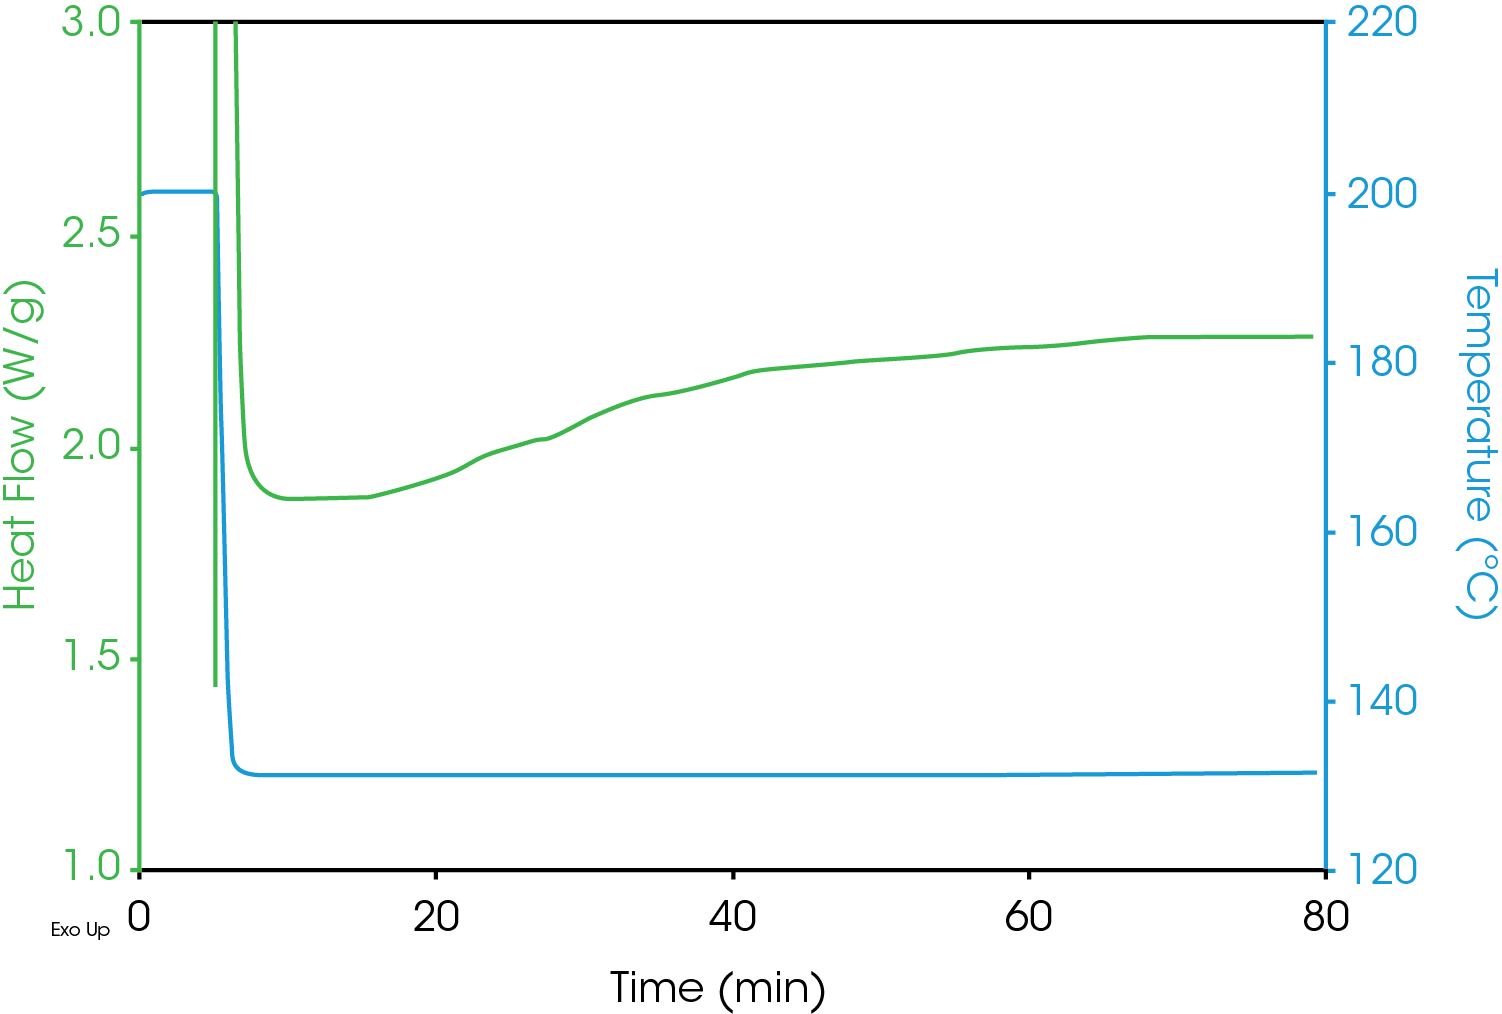
One difficulty with isothermal crystallization experiments is that as the test temperatures increase, the resolution of the DSC exotherm peak decreases making accurate detection problematic. An example of this is shown in Figure 5 which includes DSC crystallization data from the same sample as shown in Figure 2, but at an elevated test temperature of 130 °C. The heat flow data is a flat line with no indication of exothermic activity due to crystallization.
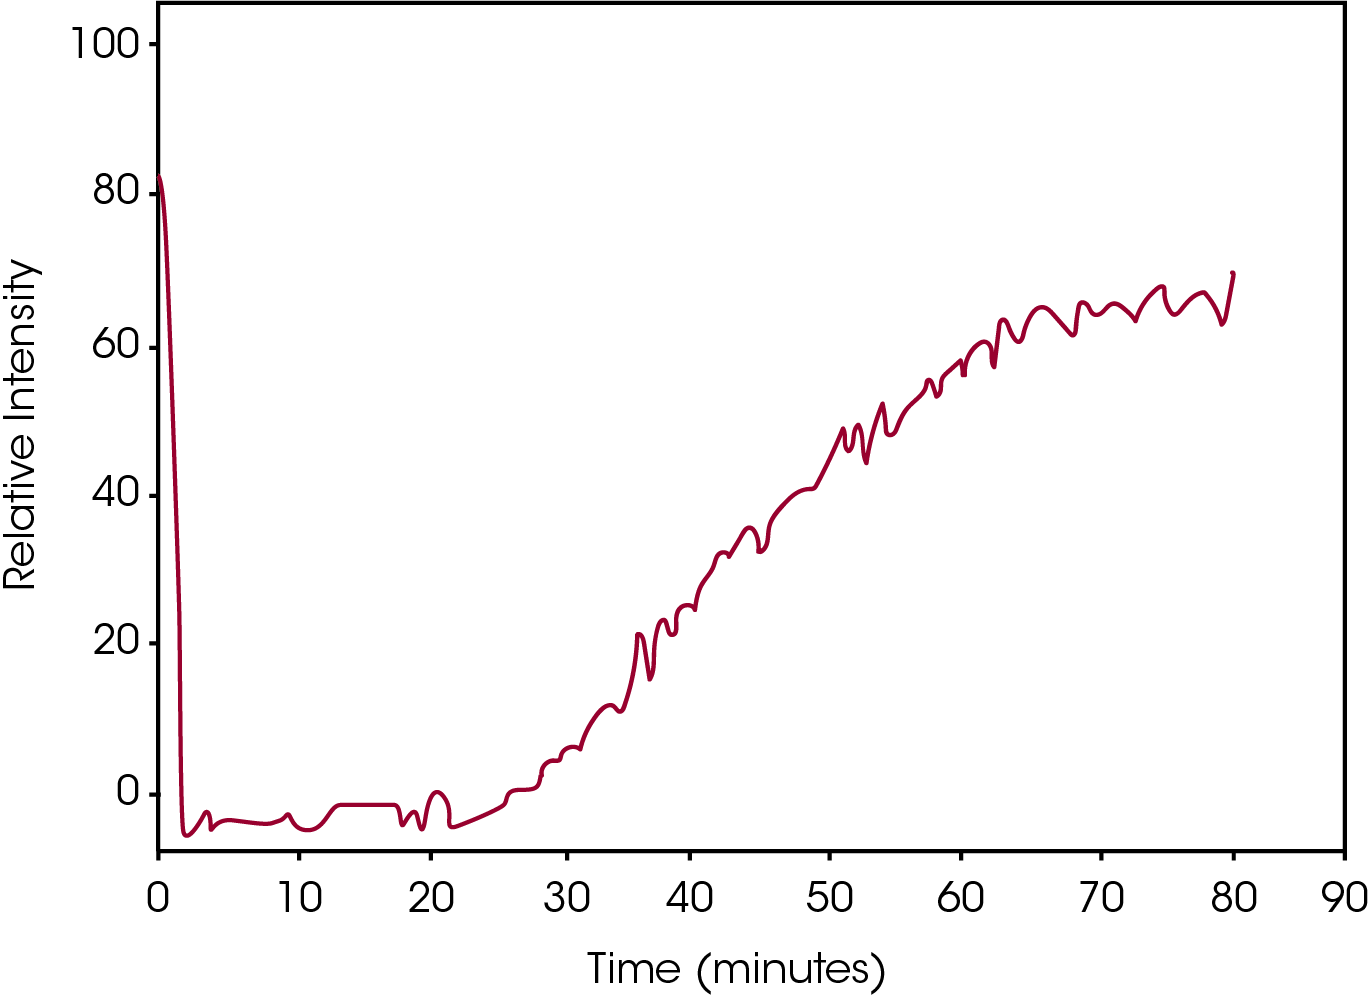
Conversely, Figure 6 contains the plot of the Relative Intensity of the same Raman peak as Figure 4 for the DSC data shown in Figure 5. Whereas the DSC measures the rate of the process, which at the elevated temperature is problematic, the Raman data measures the absolute intensity of the absorption band, clearly and easily showing the crystallization process.
Conclusions
Interfacing of optical spectroscopic probes to DSC is straightforward. The data presented in this paper indicate the utility of Raman spectroscopy in detecting and tracking the isothermal crystallization of polypropylene. While only DSC can provide information on heat of crystallization, Raman spectroscopy can be used to follow the crystallization process at temperatures where the crystallization process is slow and therefore DSC data is not useful.
References
- Kaiser Optical Systems, Inc, 371 Parkland Plaza, Ann Arbor, MI 48103.
Click here to download the printable version of this application note.

