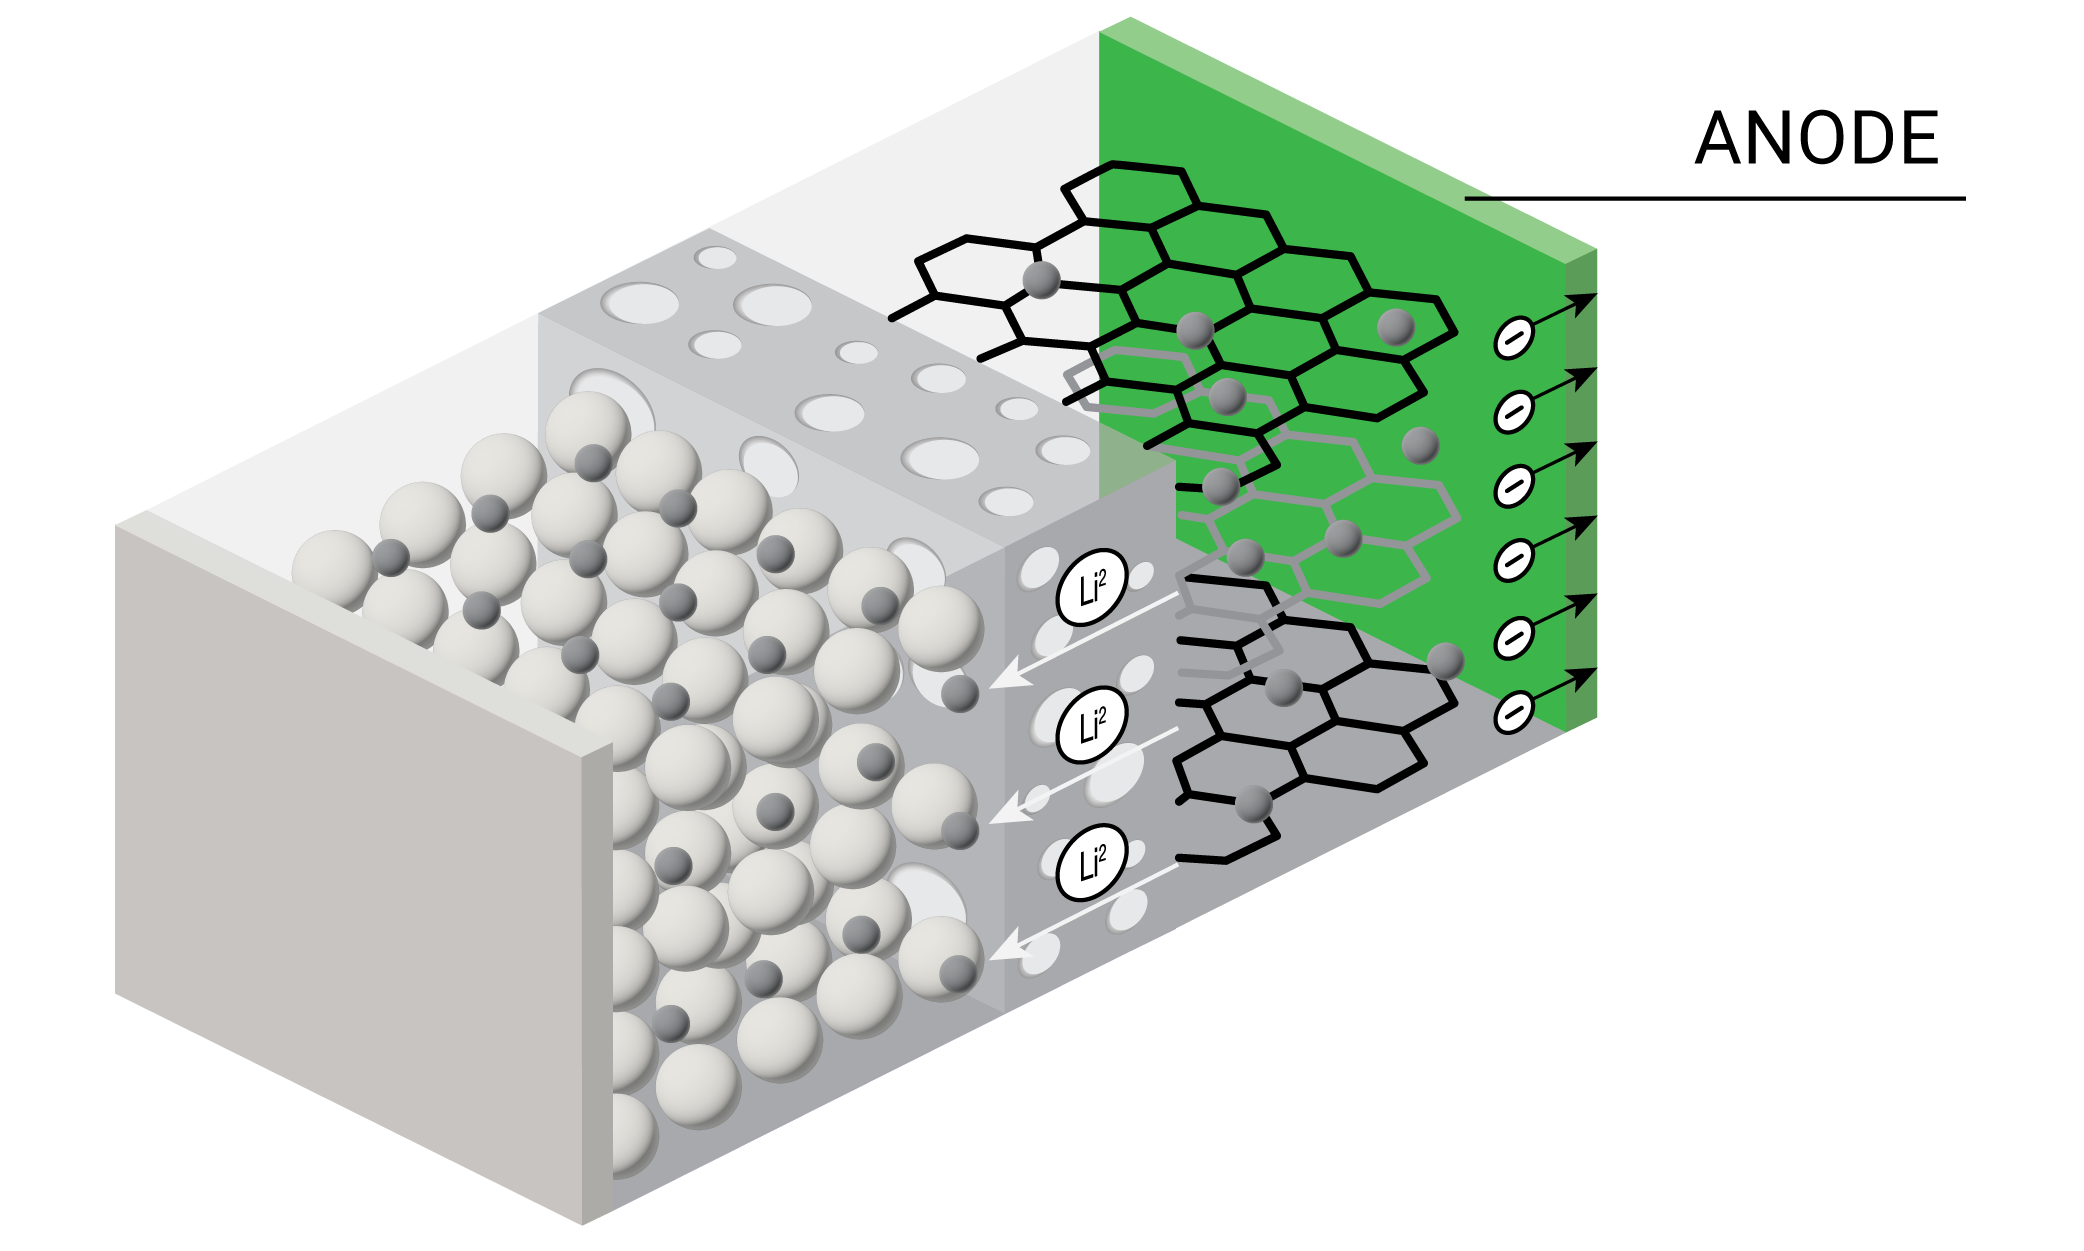
The anode, or negative electrode, in lithium-ion batteries is usually made of materials based on carbon (primarily graphite) and the oxide spinel (Li4Ti5O12). Lithium ions intercalate at the anode during charging and need to reverse this process during discharging. Anodes therefore must demonstrate good electrochemical stability with the electrolyte as well as hold large amounts of lithium without significant changes in structure.
During cell cycling in manufacturing, the electrolyte solution forms a solid electrolyte interface (SEI) on the anode which is ionically conductive but electronically insulating. Forming the electrolyte slurry for irreversible reduction on the anode requires careful purification, optimization of particle morphologies, and the selection of electrolyte additives. Rheology enables engineers to produce consistent slurry viscosities that result in uniform coatings for higher performing and safer batteries.
Lithium-ion batteries typically operate at temperatures of -20 °C to 60 °C. Higher temperatures can disrupt the SEI and lead to anode decomposition. Thermal analysis enables researchers to understand the thermal stability of the anode and its SEI while optimizing slurry composition and solvent drying for improved batteries.
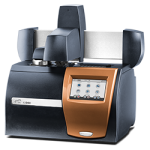
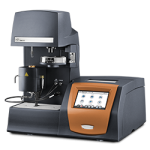
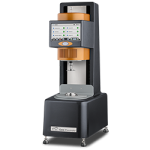
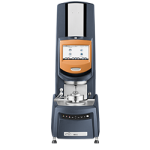
Instruments and Test Parameters
Decomposition analysis
- Reduction of graphene oxide
- Evolved gas analysis, TGA-MS, TGA-FTIR, TGA-GCMS
Composition determination
- Volatile or solvent content
- Inorganic content (residue)
- Evolved gas analysis, TGA-MS, TGA-FTIR, TGA-GCMS
Slurry drying
- Drying temperature
- Drying kinetics
Mixing for slurry formation
- Viscosity (shear thinning index)
Slurry storage with minimal settling / aggregation
- Viscosity (zero shear viscosity)
- Viscoelasticity
Pumpability, transport of slurry
- Yield stress
- Viscoelasticity
- Yield stress
- Viscoelasticity
- Viscosity (shear thinning index)
- Thixotropy
Optimization of coat weight / coat thickness
- Viscosity (thixotropy)
Everything in Viscometry & Rheometer PLUS…
Electrically conductive network
- Friction-Free Rheo-Impedance Spectroscopy
Powder Characterization
- Powder behavior for mixing and stability (Powder Rheology Accessory)
Differential Scanning Calorimetry
Quality control
- Melting temperature (Tm)
- Heat of fusion
- Glass transition (Tg)
Thermal stability
- Decomposition temperature
Composition determination
- Binder/additive contents
- Active Material
-
Material Examples: Graphene, Graphite, Silicone
Decomposition analysis
- Reduction of graphene oxide
- Evolved gas analysis, TGA-MS, TGA-FTIR, TGA-GCMS
Composition determination
- Volatile or solvent content
- Inorganic content (residue)
- Evolved gas analysis, TGA-MS, TGA-FTIR, TGA-GCMS
Slurry drying
- Drying temperature
- Drying kinetics
Mixing for slurry formation
- Viscosity (shear thinning index)
Slurry storage with minimal settling / aggregation
- Viscosity (zero shear viscosity)
- Viscoelasticity
Pumpability, transport of slurry
- Yield stress
- Viscoelasticity
- Yield stress
- Viscoelasticity
- Viscosity (shear thinning index)
- Thixotropy
Optimization of coat weight / coat thickness
- Viscosity (thixotropy)
Everything in Viscometry & Rheometer PLUS…
Electrically conductive network
- Friction-Free Rheo-Impedance Spectroscopy
Powder Characterization
- Powder behavior for mixing and stability (Powder Rheology Accessory)
- Binder/Additive
-
Material Examples: Carboxymethyl Cellulose (CMC), Styrene-Butadiene Rubber (SBR)
Differential Scanning Calorimetry
Quality control
- Melting temperature (Tm)
- Heat of fusion
- Glass transition (Tg)
Thermal stability
- Decomposition temperature
Composition determination
- Binder/additive contents
Application Examples
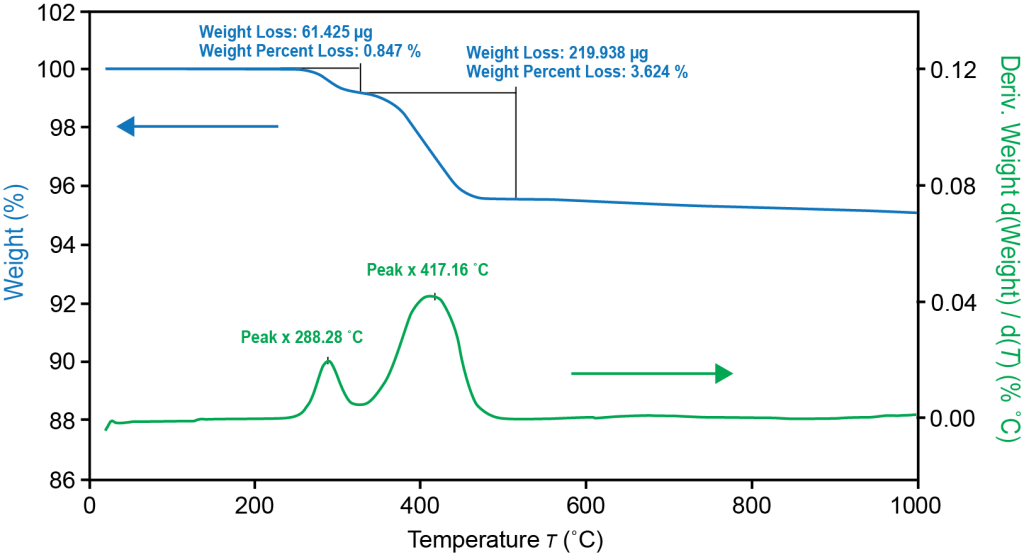
TGA thermal stability and compositional amount of anode materials
Electrodes require binders and additives to ensure proper adhesion to the metal collector. For the anode electrode, carboxymethyl cellulose (CMC) is a common binder and styrenebutadiene rubber (SBR) is a common additive that provides flexibility. TGA measures the thermal degradation temperatures and composition of CMC, SBR and graphite active anode materials. The high sensitivity Tru-Mass Balance of the Discovery TGA ensures accurate measurement of each component in the electrode. For this test, the sample was loaded directly on a TGA platinum pan without any sample preparation.
Conclusion:
TGA measured the thermal stability and quantified the amount of binder and additive in the anode electrode. TGA can also provide quality control of the materials to ensure the same amount of active material, binder and additive are in each batch of the electrode. Insufficient amounts of binder will affect the active anode material’s adhesion to the metal collector; too much binder will reduce the active material’s content and affect the electrochemical reaction. Optimization of binder/additive ratios is essential for optimal battery performance and improvement of battery life.
Rheology to determine battery slurry viscosity
Electrode slurries are complex, non-Newtonian fluids that are a mixture of solid particles and polymeric binder in a solvent. They are subjected to a wide range of changing shear deformation rates at different stages of the electrode manufacturing process. The ideal slurry has a low viscosity for optimum mixing and coating (high shear rates), but a high enough viscosity for good levelling during drying and to minimize particle settling and agglomeration during storage (low shear rates).
The figure to the right shows the viscosity of an anode slurry under different shear rates on a TA Instruments Discovery Hybrid Rheometer (DHR). The sample was mixed before loading on the rheometer. The measurements were performed from 0.01 to 1000 s-1 at 25˚C using a 40mm parallel plate with solvent trap.
The data in the figure shows the viscosity of the slurry as measured over 5 decades of shear rates. The Advanced Drag Cup Motor technology of the DHR allows for the measurement to be performed in less than 20 minutes with a direct readout of the viscosity. Initially, under low shear rates which simulate storage conditions, the viscosity is high to prevent settling and reduce the energy of mixing prior to coating. The low torque sensitivity of the DHR ensures accurate, repeatable measurements in this low shear rate region, providing greater confidence in the data.
As the shear rate increases, the slurry exhibits a typical shear-thinning behavior where the viscosity of the slurry decreases by almost a decade. This is important to ensure that the slurries can be mixed efficiently and have the right amount of flowability when applied onto the substrate.
The slurry rheology continues to play a critical role in the film-formation stage (a low shear rate process) where the rate of viscosity increase (known as thixotropy) ensures the levelling of the coatings. This is especially critical when electrodes with high coat weight for higher energy density are desired.

Conclusion:
Rheological measurements provide researchers with a reliable analytical tool for developing new formulations with improved performance and manufacturability. Understanding and controlling the slurry rheology helps in not only choosing an appropriate manufacturing process (roll-to-roll coating, slot-die coating, etc.) but also maximizes the production output to produce consistent, defect-free films of uniform coat weight and good contact with the electrode. These measurements can be used both in R&D and manufacturing settings owing to the DHR’s highly intuitive user-interface that reduces operator training times and increases productivity.
Evaluate Cathode Electrically Conductive Network in Slurry Formulation
Rheo-Impedance Spectroscopy offers powerful insights into microstructure of complex fluids such as battery electrode slurries, emulsions, paints, coatings, and more. Coupling dielectric impedance spectroscopy with the DHR’s rheology measurements empowers users to characterize shear-induced changes in sample microstructures under process-relevant conditions such as mixing, storage, and coating. Simultaneous precise measurements of viscosity, yield stress, viscoelasticity, and recovery deliver new insights connect flow properties to underlying changes in microstructure.
Battery electrode slurry formulation and process development is guided by impedance spectroscopy. Initial impedance measurements performed without applied shear indicate the dispersion of conductive material in the slurry after mixing. Simultaneous impedance and rotational deformation directly measures shear-induced changes in the microstructure, replicating slurry coating conditions and enabling measurements of time-dependent recovery after shear. These new insights verify the electrically conductive network is maintained in the finished electrode and ensure successful battery performance.
What Thermal Events Lead to Thermal Runaway?
While there are remaining questions about the thermal runaway process in batteries, current understanding suggests that it is initiated by the following series of events. The exothermic reactions leading to thermal runaway interact destructively with every inner component of a Lithium-Ion Battery (LIB) as the battery’s temperature continues to rise; some elements are early casualties while most directly speed up heat accumulation as they fail.
The first component to begin breaking down is the Solid-Electrolyte Interphase (SEI), which generally starts around 80-120°C (176-248°F). At this point, Thermal Runaway can be slowed, but is no longer reversible once the anode is exposed to the electrolyte. Exothermic reactions occurring at the reactive anode surface add more heat into the system until it reaches the next critical temperatures.
The separator is the next component affected, and it fails in two stages. Around 120-150°C (248-302°F) the separator begins to melt and causes a small short-circuit, followed by a more serious internal short circuit when the separator breaks up near 220-250°C (428-482°F).
The following reactions happen quickly and directly following the previous temperature range; the cathode material, binder, and electrolyte all begin decomposition, which drastically raises the temperature of the battery cell to temperatures about 800°C (1472°F). These reactions have gas products which increase the pressure within the LIB.
Aside from quick heat generation, the cathodic reactions have a disastrous byproduct of oxygen which is flammable. Depending on the exact conditions, the immediate result is either “Heat + Oxygen = Fire” or “Heat + Gas = Rupture/Explosion”. Of course, not all materials are made equal and may fall high or low on these ranges – or even outside of these temperatures in the future – so it is essential to make the safest possible choice of materials for a given battery with proper testing.
TGA Thermogram Highlighting Thermal Instability of Graphite Anode Material
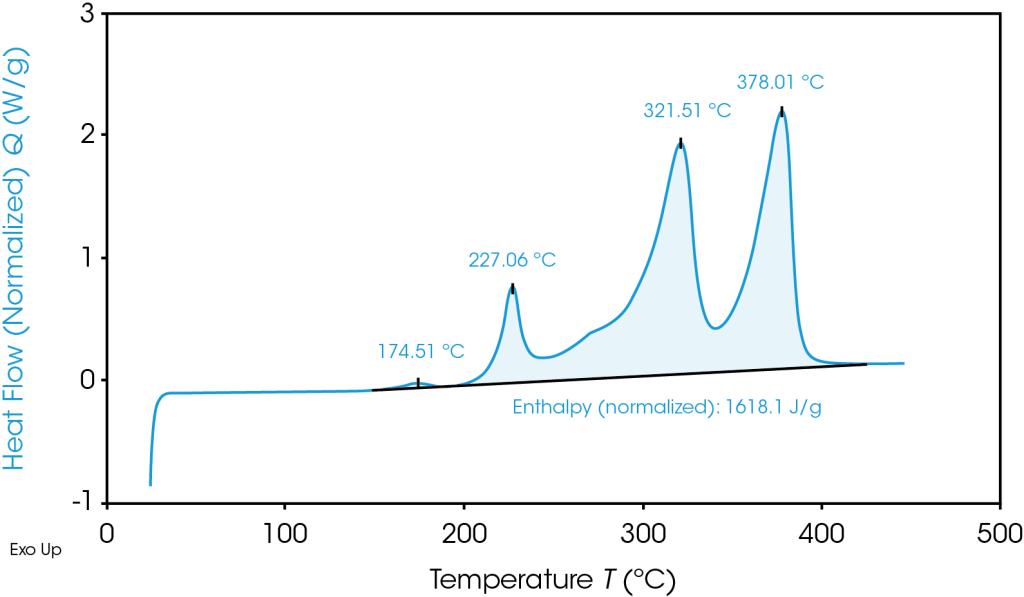
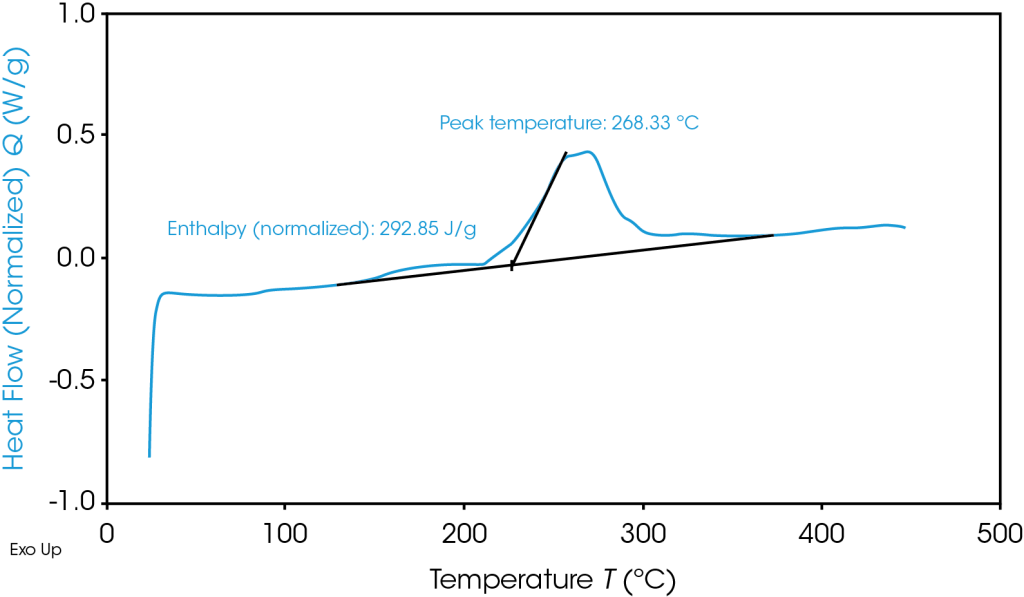
To avoid thermal runaway and select battery materials with optimal heat tolerances, battery researchers turn to Differential Scanning Calorimetry (DSC) and Thermogravimetric Analysis (TGA):
DSC: DSC measures the heat flow into or out of a material as a function of temperature or time. Phase changes interrupt the heat capacity relationship between temperature change and heat absorbed or released and are visible on graph output. It allows for testing in a variety of conditions ranging from safe operating temperature to thermal abuse.
TGA: TGA measures mass of a sample as a function of temperature or time. Generally speaking, a more thermally stable material can reach a higher temperature before any change in mass occurs.
Answer the following questions with results from your DSC:
- The material’s melting temperature, Tm
- The material’s glass transition temperature, Tg
- The lowest phase change temperature of various materials that comprise the battery.
Answer the following questions with results from your TGA:
- The temperature at which a material begins decomposition.
- The amount of sample mass lost to thermal or oxidative decomposition at a given temperature.
- The rate of decomposition reactions (both oxidative and thermally induced) at a given temperature.
- The maximum thermally stable temperature of the various materials that comprise the battery.
How does rheology help produce uniform battery slurry coatings?
During the creation of a Lithium-Ion Battery (LIB), preparing the electrode involves the creation of an “electrode slurry”: a suspension of solid conductive particles in a solvent medium, along with polymer binders and active components. The properties of this slurry are essential to the quality of a life, affecting performance and lifetime. The primary conflict of creating an effective electrode slurry is that its viscosity and viscoelasticity must be in a narrow range to be high enough for some steps and low enough for others, with the end goal of a homogenous product.
During initial mixing, the viscosity must be low enough to be evenly blended. After mixing, the viscosity must be high enough for the conductive solids to remain evenly suspended and avoid settling. Additionally, the slurry must be able to coat evenly, remain level during drying, and have sufficient adhesion to avoid delamination. Non-Newtonian fluids are the best solution, as they do not have a single constant measurement for viscosity.
Rheology provides a powerful technique for analyzing viscosity and viscoelasticity performance for battery slurries
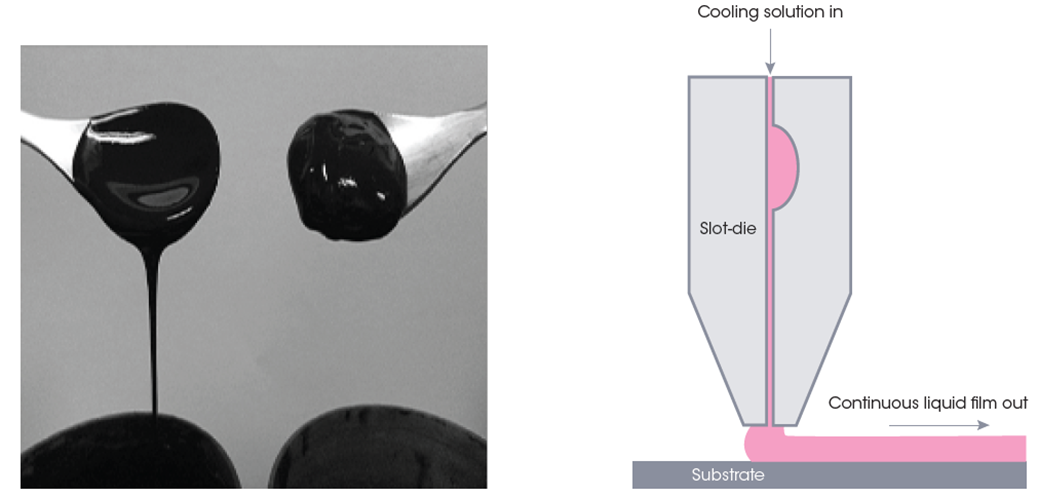
Generally, slurries that exhibit high amounts of shear-thinning, which become less viscous under shear strain, are advantageous for these applications. When left alone, the viscosity is sufficient to maintain homogeneity in suspension, but mixes well and spreads thinly under sufficient force. Typically, a viscometer is a useful tool for measuring viscosity and characterizing “fluid” materials, but it won’t be helpful for materials that have more than one value. Unlike a viscometer, rheometers can measure a range of viscosity values during shear thinning or shear thickening for Non-Newtonian substances, so they are critical to characterizing these slurries. Additionally, built-in attachments allow for easy testing in various temperature, pressure, and humidity conditions, which can help simulate working environments.
Aside from the electrode slurry itself, another significant impact on its flow behavior is the methods and equipment used for fluid application. The shape of the nozzle and power supplied by the pump will directly affect the amount of stress the pseudoplastic slurry is under – and by result, its fluid properties during coating. The transient creep properties of a material are also critical to the deformation versus levelness of a coating, especially while drying. Any material shrinkage will also significantly affect the appearance of the slurry after it’s set.
Discovery Hybrid Rheometer: The Discovery Hybrid Rheometer measures the flow response of a material in response to applied force by measuring the deformation relative to a controlled strain. The “Hybrid” nature of the DHR allows it to measure typical force values as well as stress and strain control measurements for an accurate and streamlined process. The DHR also has a wide array of Smart Swap™ accessories that greatly expand the possible scope of study.
Find the following properties with results from your DHR:
- The material’s viscosity, dependent to force
- The material’s viscoelasticity: non-linear time-dependent relationship between force and deformation.
- The material’s stress-strain curve and associated factors
- The material’s yield stress: the stress at which permanent deformation begins to occur, which includes the undesirable settling of conductive particles towards the bottom of the electrode.
- The material’s thixotropic behavior: to what extent the material will recover its viscosity during rest after being subjected to shear-thinning force
- The ideal nozzle geometry and pump power for coating
Comprehensive Slurry Flowability
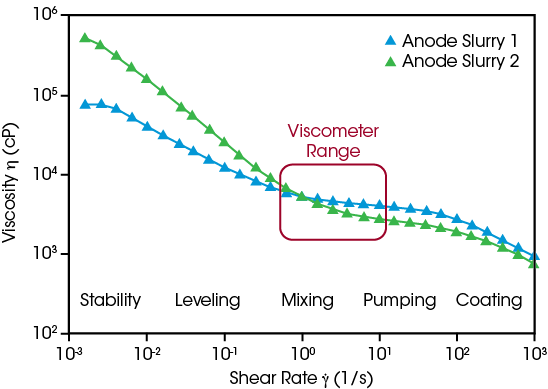
Slurry formulations can be optimized effectively when researchers are able to predict and measure their flow behavior across relevant conditions, ranging from the high shear rates used during the coating process to the very low shear rates experienced at rest. Comparing two experimental anode formulations using only a viscometer suggests their flow behavior is equivalent, but the Core Rheometer’s extended range of measurement shows Anode Slurry 2 is more shear thinning, and its higher viscosity at low shear is advantageous to stabilize the dispersion against settling, indicating the active materials are uniformly distributed.
Discovery Core Rheometer Benefits:
- Measure viscosity under process-relevant conditions: coating, mixing, leveling, storage
- Robust stainless-steel geometries suitable for NMP-based slurries
- Concentric cylinder configuration for easy loading of low viscosity slurries, available with disposable cups for high throughput
- Streamlined, guided operation with rapid analysis results to keep up with fast-paced production needs
- Air-cooled Peltier temperature control eliminates the need for a fluid circulator, ideal for operation in a dry room
Slurry Recovery After Coating
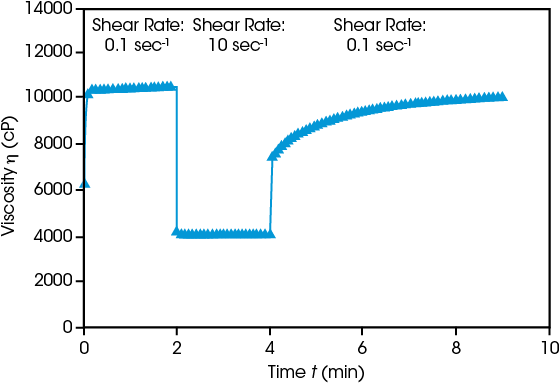
Ensuring successful electrode production requires understanding of the behavior before, during, and after coating. Initial viscosity at low shear rate (0.1 sec-1) is high, then when shear rate is increased to 10 sec-1 simulating a coating process, viscosity decreases immediately. Reducing the shear rate shows the viscosity gradually rebuilding over time. Rapid recovery often leads to uneven, non-level surfaces. If recovery is too slow, the slurry will continue to spread, causing inconsistent thickness. Both behaviors compromise the efficacy of the resulting electrode.
Discovery Core Rheometer Benefits:
- Measure viscosity under process-relevant conditions: coating, mixing, leveling, storage
- Robust stainless-steel geometries suitable for NMP-based slurries
- Concentric cylinder configuration for easy loading of low viscosity slurries, available with disposable cups for high throughput
- Streamlined, guided operation with rapid analysis results to keep up with fast-paced production needs
- Air-cooled Peltier temperature control eliminates the need for a fluid circulator, ideal for operation in a dry room
Yield Stress - Dispersion Stability
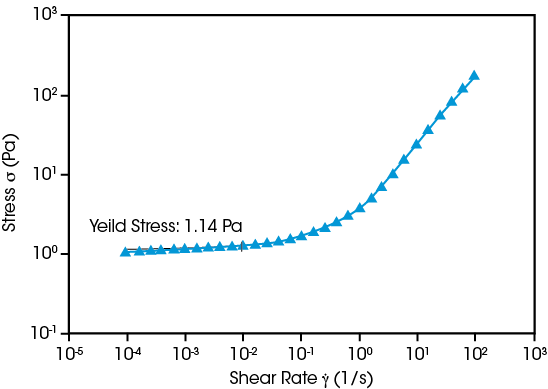
Battery materials scientists face a fundamental challenge when developing anode or cathode slurries: maintaining a uniform distribution of the dense solid particles making up the active and conductive materials. Suspension stability is dependent on the slurry’s yield stress, the resistance to flow when the material is at rest. Multiple rheological techniques may be used to quantify yield stress, such as the example shown above in which shear rate is decreased until the shear stress reaches a plateau. The Core Rheometer’s torque sensitivity enables precise measurements of the internal microstructure impacting a slurry’s stability.
Discovery Core Rheometer Benefits:
- Measure viscosity under process-relevant conditions: coating, mixing, leveling, storage
- Robust stainless-steel geometries suitable for NMP-based slurries
- Concentric cylinder configuration for easy loading of low viscosity slurries, available with disposable cups for high throughput
- Streamlined, guided operation with rapid analysis results to keep up with fast-paced production needs
- Air-cooled Peltier temperature control eliminates the need for a fluid circulator, ideal for operation in a dry room
Application Notes
- Rheological Evaluation of Battery Slurries with Different Graphite Particle Size and Shape
- Time Dependent Stability of Aqueous Based Anode Slurries with Bio-Derived Binder by Rheological Methods
- Thermogravimetric Analysis of Powdered Graphite for Lithium-ion Batteries
- Rheological and Thermogravimetric Characterization on Battery Electrode Slurry to Optimize Manufacturing Process
- Effect of Moisture on Cohesion Strength of Carboxymethyl Cellulose Powder
- Powder Rheology of Graphite: Characterization of Natural and Synthetic Graphite for Battery Anode Slurries
- Safety Evaluation of Lithium-ion Battery Cathode and Anode Materials Using Differential Scanning Calorimetry
- DSC Step Anealing for Fingerprinting Molecular Structure in Poly (vinylidene fluoride)
- Thermal Diffusivity and Thermal Conductivity of Battery Anode Material
- Polymer Flow and Mechanical Characterization for Material Development, Processing, and Performance
- Structural Characterization of Carbon Black Paste for Li-ion Battery Electrodes Using Simultaneous Rheology and Electrochemical Impedance Spectroscopy


