Keywords: Lithium-ion Battery, Battery, Anode, Graphite, Powder, Hopper
RH125
Introduction
Lithium-ion battery performance relies heavily on well formulated electrodes consisting of active material, binder, and other additives. Powder properties are an important consideration in traditional slurry or dry processing techniques for electrode manufacturing. For lithium-ion anodes, the most common active material is graphite, due to its high energy density, power density, and long cycle life. Its abundance and low-cost result in it dominating the anode market [1]. Graphite may originate from natural or synthetic sources. Synthetic graphite is typically manufactured by subjecting amorphous carbons to high temperature for extended periods of time. This process provides energy for the slow graphitization phase transition. Synthetic graphite has superior purity, thermal expansion, and thermal stability compared to natural graphite; however, natural graphite is cheaper [2]. Manufacturers may blend or use either source of graphite in their applications and quantifying powder behavior can help with optimizing manufacturing processes or designing hoppers [3].
Powder shear strength and cohesion impact the properties and performance of the final graphite slurry. When a powder has high cohesion, aggregates may form during storage and result in an inhomogeneous slurry. These particle aggregates may cause defects in the anode coating, which can result in battery failure. For powders with high yield strength, more energy will be required to flow the powder into the other slurry components for mixing. It is important for manufacturers to be able to quickly check these properties in order to optimize slurry processing. The Powder Rheology Accessory for TA Instruments HR Rheometers can be used to characterize cohesion and flowability of graphite powders and the results can be applied to reduce aggregates and achieve flow prior to slurry production. Manufacturers can use this information, combined with other rheology measurements of the slurry such as viscosity, viscoelasticity, yield stress, and thixotropy [4] to avoid anode defects. Through powder and fluid rheology, the HR rheometer provides a complete solution for battery rheology needs from graphite powder to formulated slurries.
Experimental
Synthetic and natural graphite samples from commercial and industrial sources were tested. Commercial samples were purchased from Sigma Aldrich and industrial samples were kindly provided by NEI Corporation. The TA Instruments Powder Rheology Accessory was used with Discovery HR 30 rheometer to perform shear measurements. Duplicate measurements were performed with fresh samples under ambient conditions.
Application Benefits
- Battery manufacturers can characterize graphite from different sources to optimize processing and material handling to avoid defects in anodes.
- Powder shear testing is sensitive to subtle differences in particle morphology and is indicative of behavior under consolidation.
- The Discovery HR allows manufacturers to easily switch between the rheology of slurries and powders.
Powder Shear
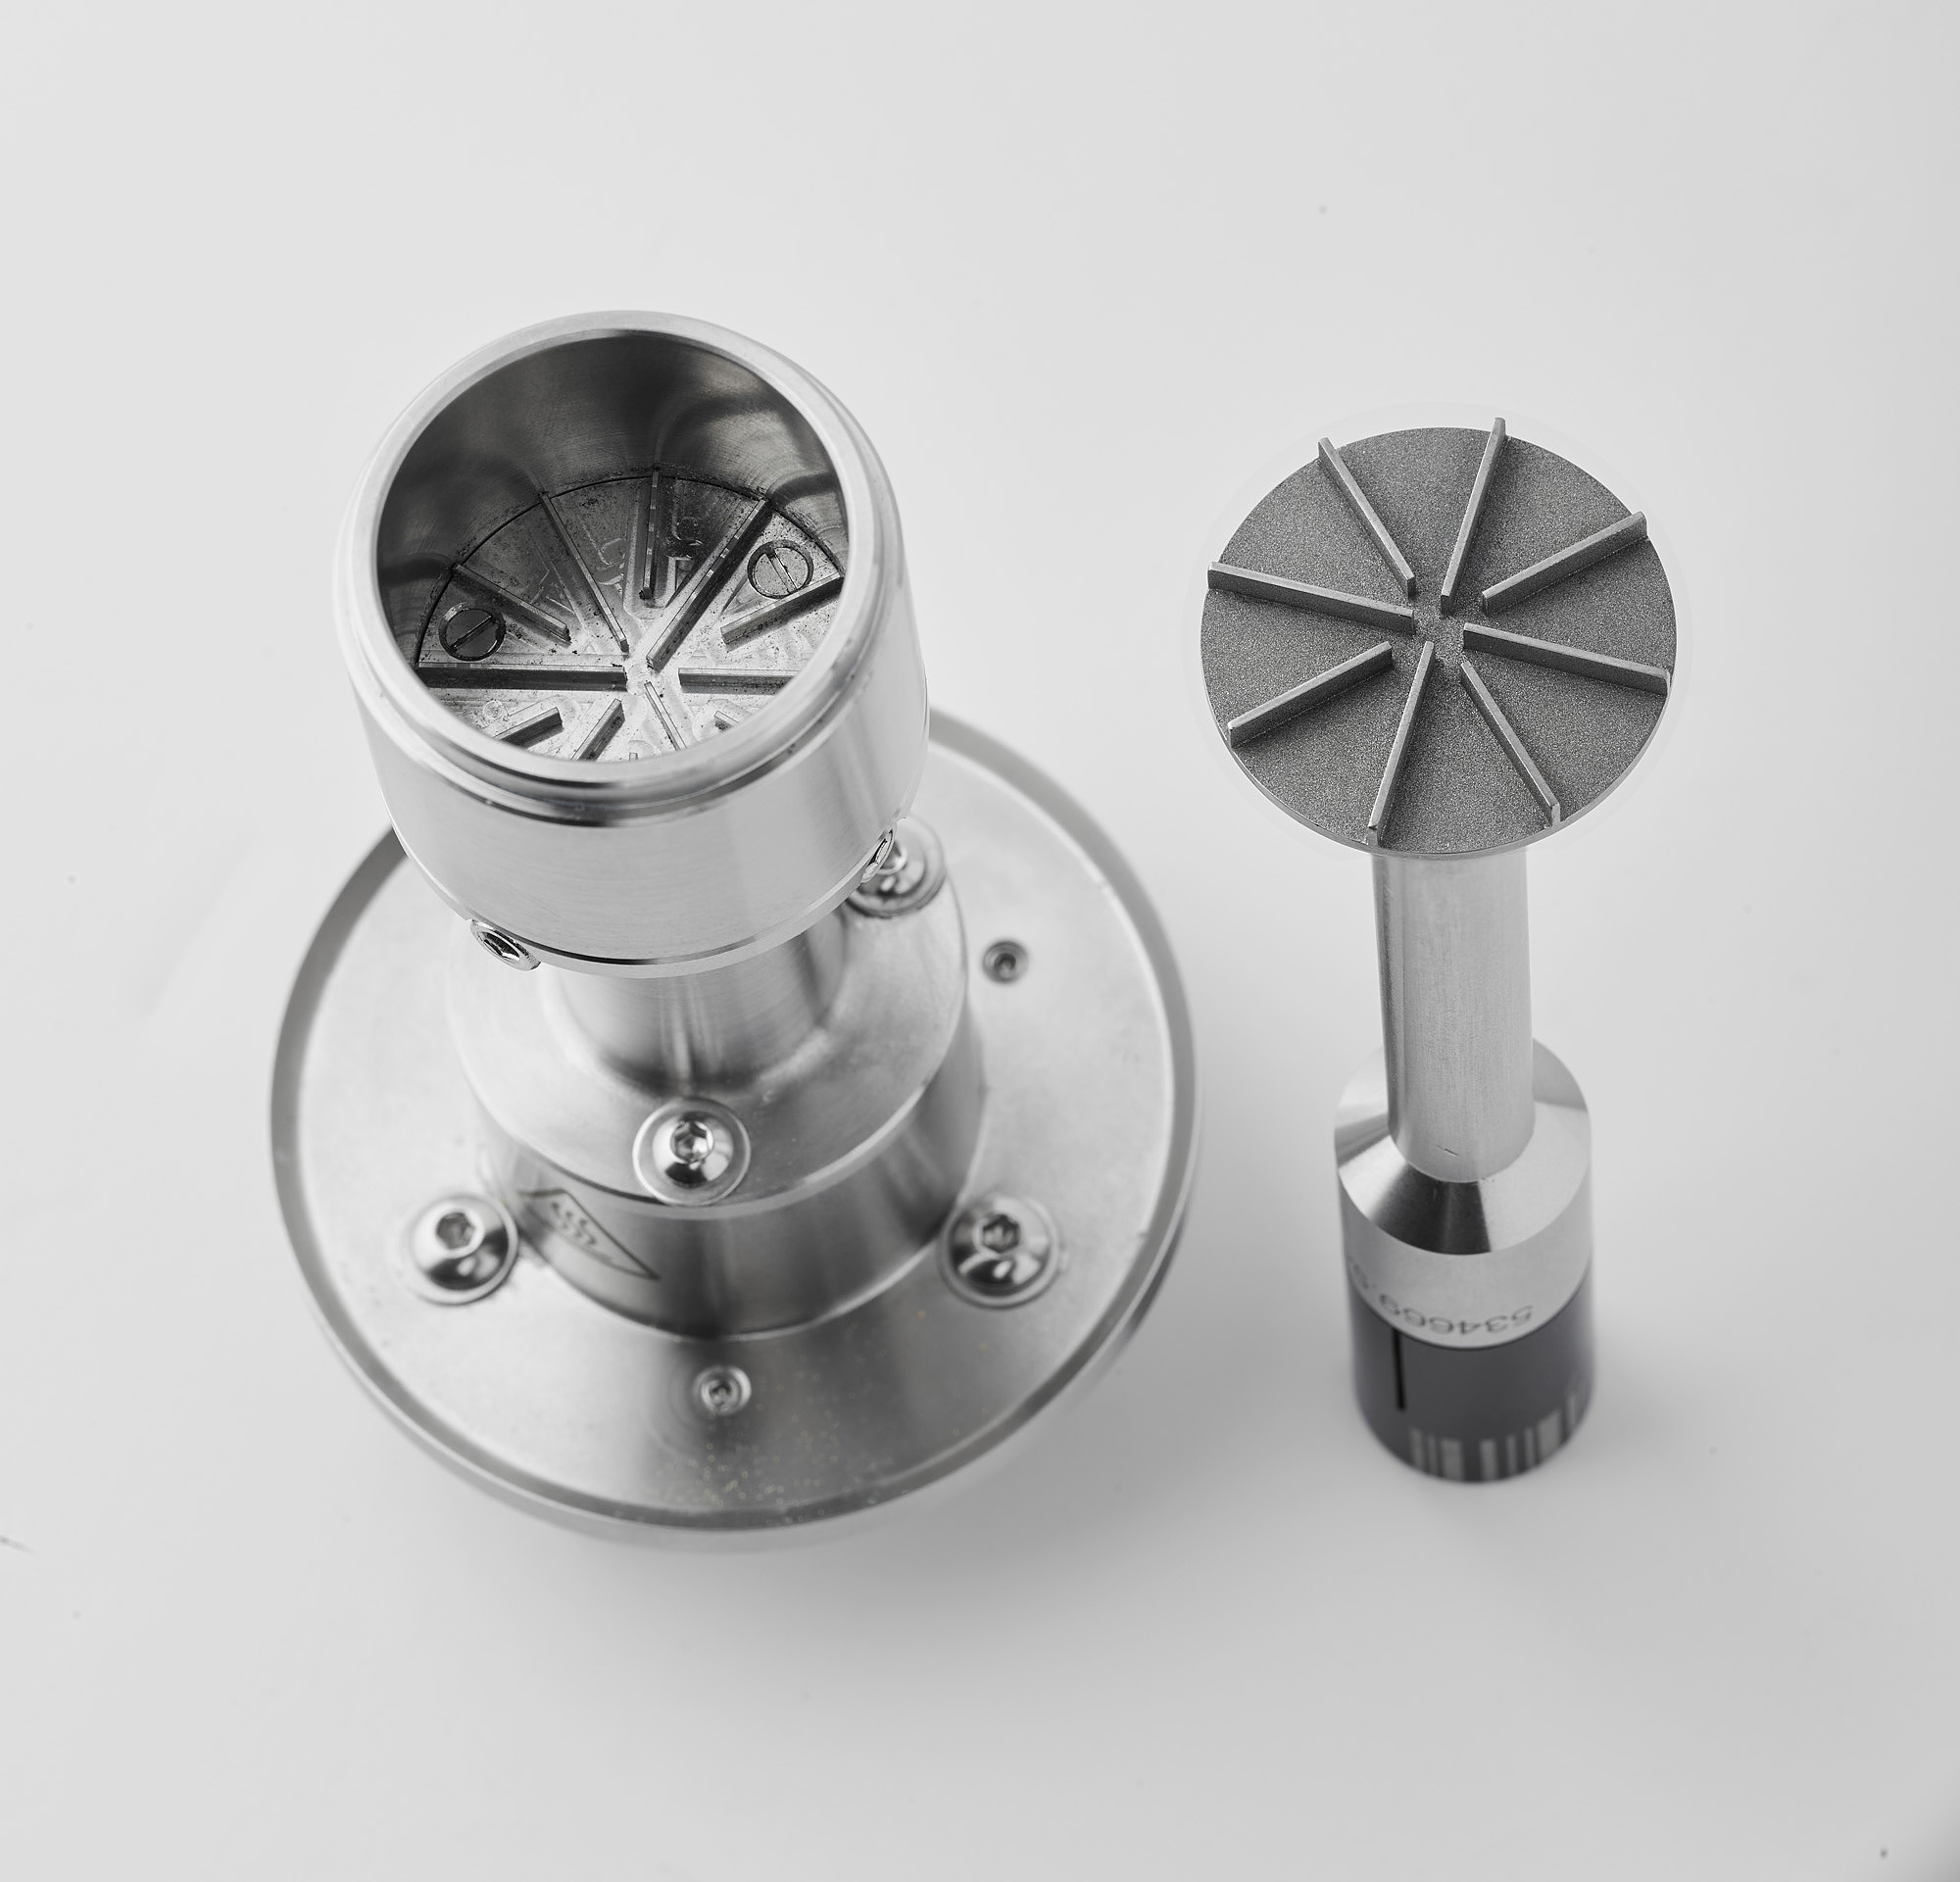
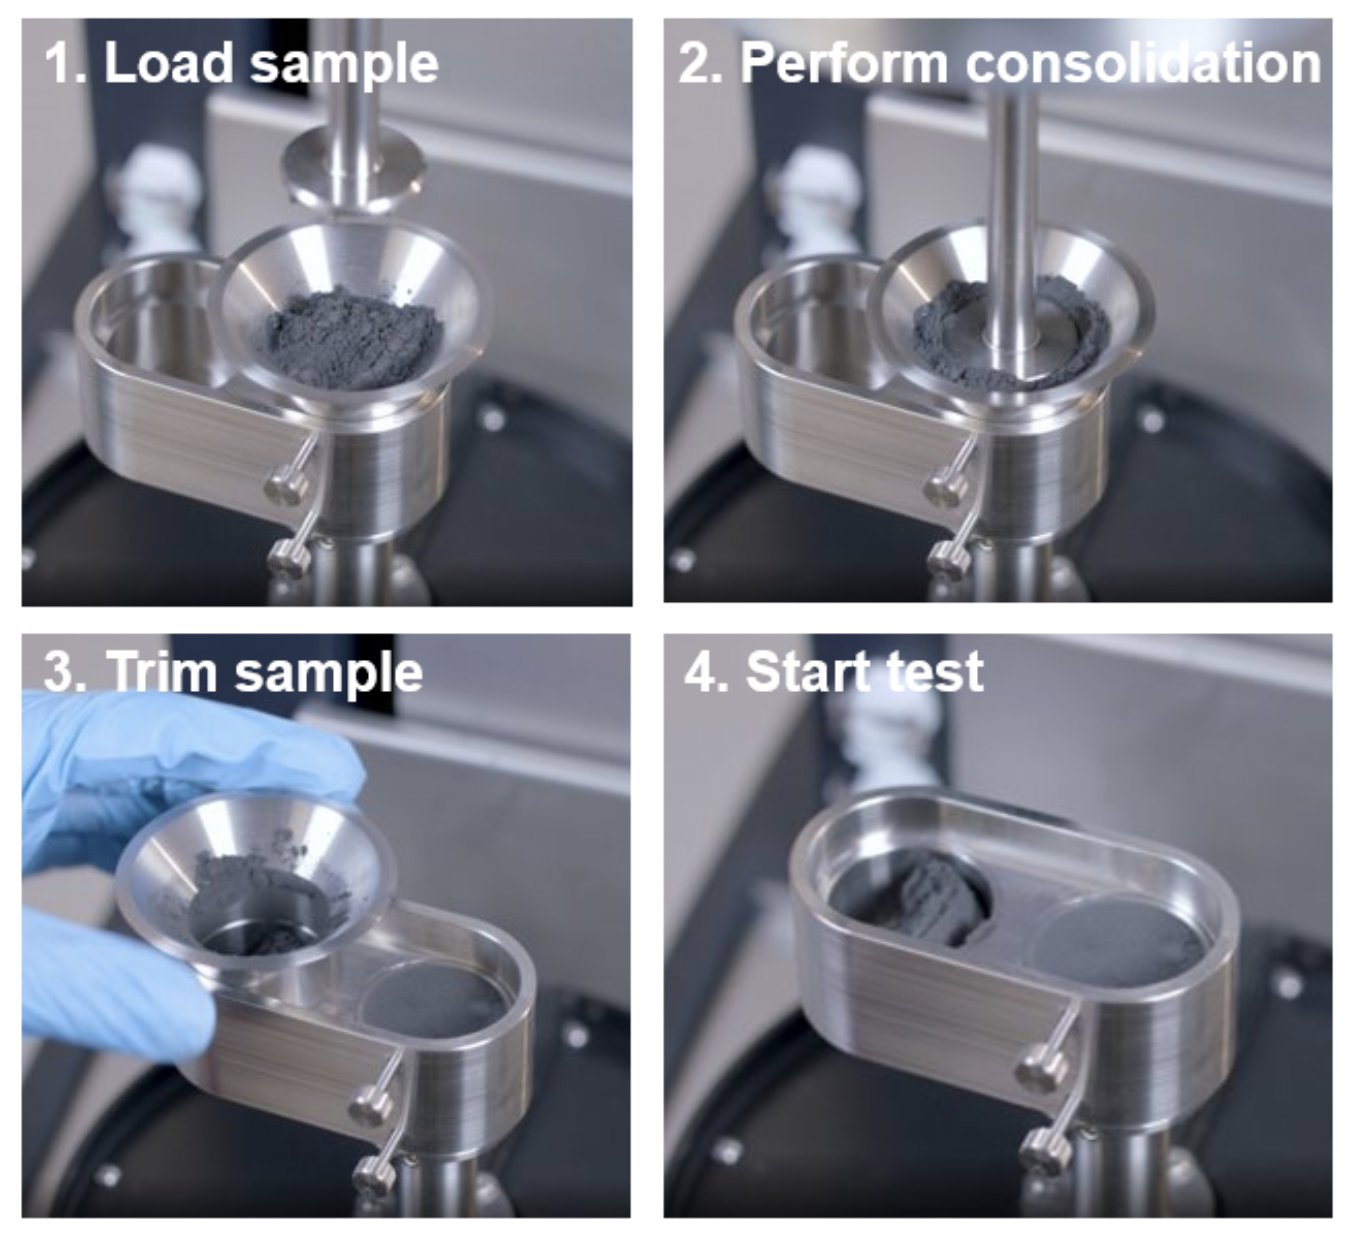
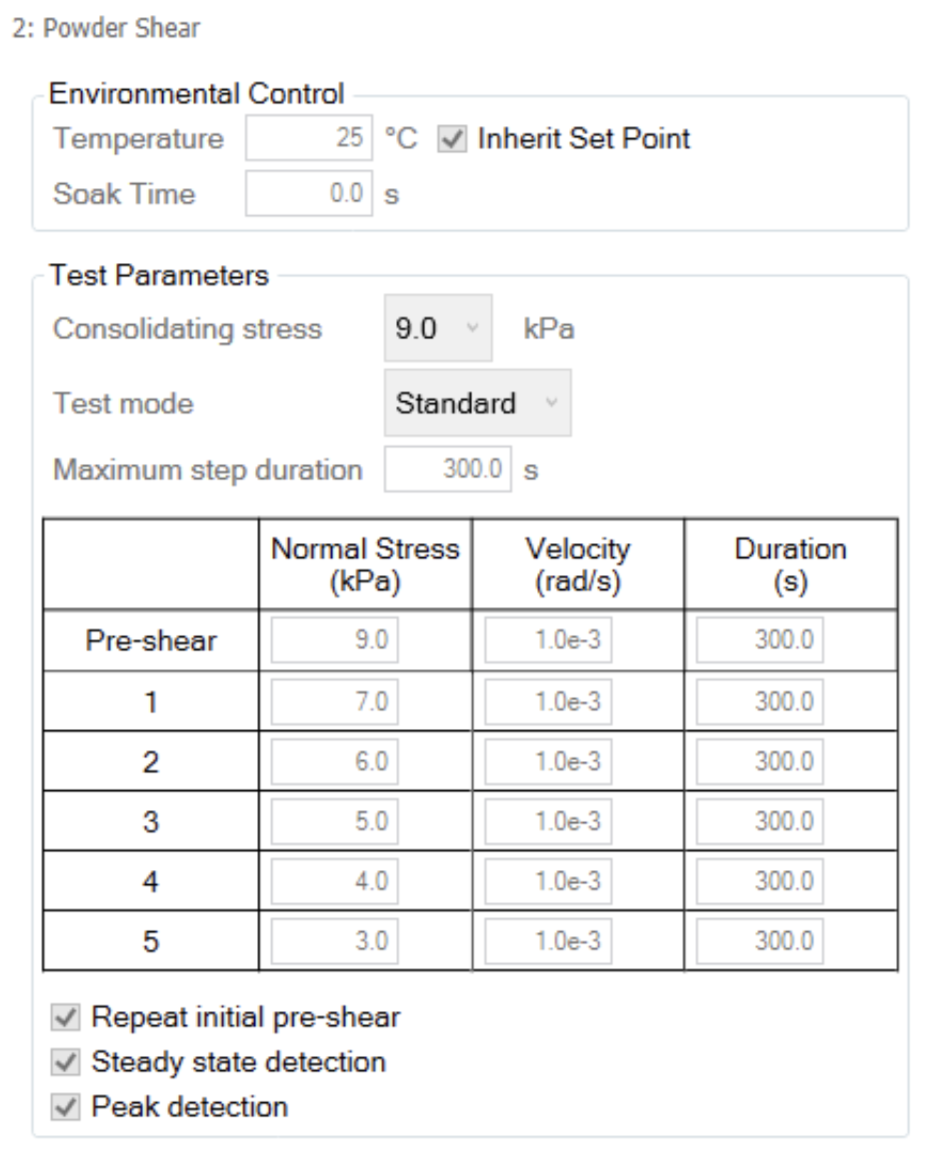
Measurements were performed using the shear cell consisting of serrated upper plate and cup (Figure 1) similar to previous work [5] in accordance with ASTM D7891 [6]. The powder was loaded and consolidated at 9 kPa axial stress before trimming the sample as shown in Figure 2. The measurement consists of preshear and shear steps at specified stresses. The preshear normal stress is equal to the consolidating normal stress. The shear stresses were performed in descending order from 7 to 3 kPa at 1×10⁻³ rad/s until steady state was reached as shown in Figure 3. The TA Instruments Powder Analysis option in TRIOS software was used to determine cohesion, unconfined yield strength, and major principal stress [6].
Results and Discussion
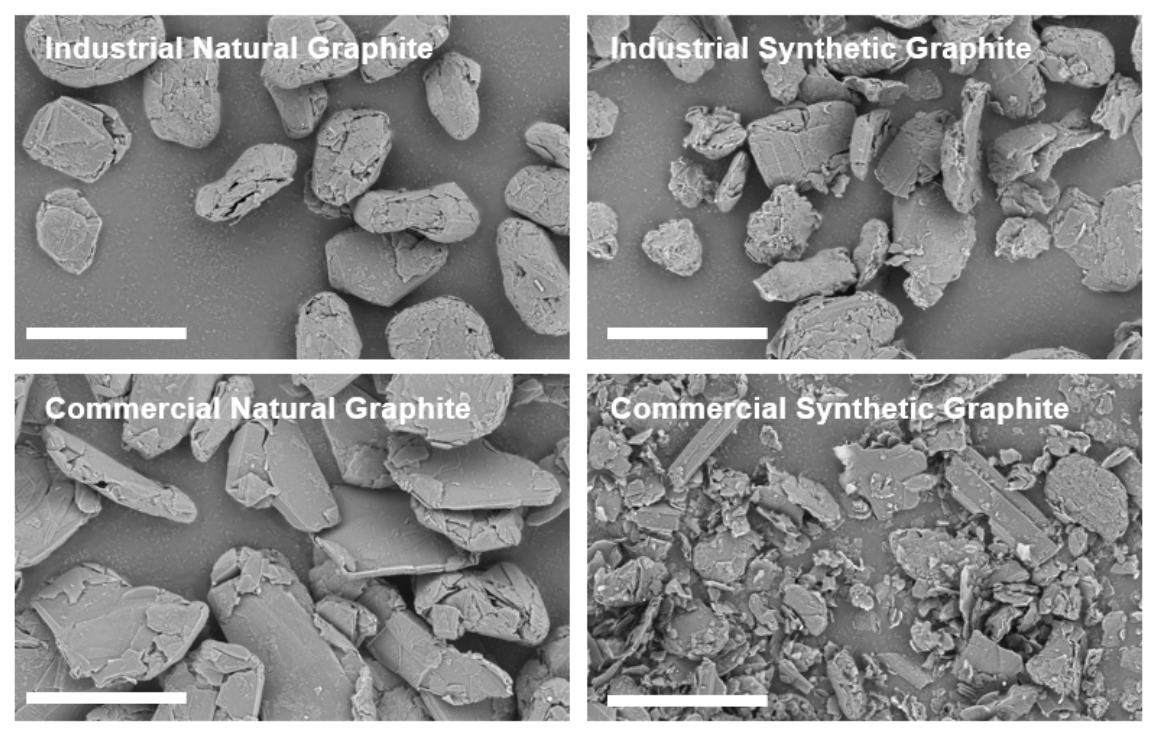
SEM images of the commercial and industrial graphite samples are shown in Figure 4. The as-received samples vary in terms of particle size distribution, aspect ratio, and morphology. The industrial natural graphite particles are approximately the same size and are rounded with some surface roughness. The commercial natural graphite particles are larger and more angled than the industrial samples. The industrial synthetic graphite has angled and rounded particles with dispersed smaller particles. The commercial synthetic graphite appears to have a large concentration of flake-like particles unlike the industrial sample.
The powder shear results are shown in Figures 5-6. In Figure 5, the results for both types of natural and synthetic graphite are shown. The duplicate measurements show good reproducibility. Figure 6 shows representative data for the yield locus analysis and Mohr’s circles, which are used to calculate cohesion, yield strength, and major principal stress. A line of best fit or “yield locus” is drawn through the shear data and extended to the y-intercept. The first Mohr circle is drawn such that it passes through the origin and is tangent to the yield locus line. The second Mohr circle is drawn such that it passes through the preshear average (not shown) and is tangent to the yield locus line. Cohesion is the y-intercept of the yield locus. Unconfined yield strength is the smaller x-intercept and major principal stress is the larger x-intercept.
A summary of the powder shear values is shown in Table 1. Higher cohesion indicates that the particles will likely form agglomerates, which will require additional energy to break up. Higher yield strength impacts flowability as the powder will not flow below the yield strength. Higher principal stress corresponds to higher failure force. The commercial natural graphite has the lowest cohesion, unconfined yield strength, and major principal stress of all samples tested. The commercial synthetic graphite has the highest values tested. If a manufacturer relied on both commercial sources of graphite, they would observe significant differences in flow behavior and likely more anode defects for the commercial synthetic powder. The industrial natural graphite has lower values than the industrial synthetic graphite, however the samples are more closely matched as shown by the percent difference. A manufacturer switching between natural and synthetic graphite from the industrial source would be less likely to report issues with mixing, agglomeration, and coating defects.
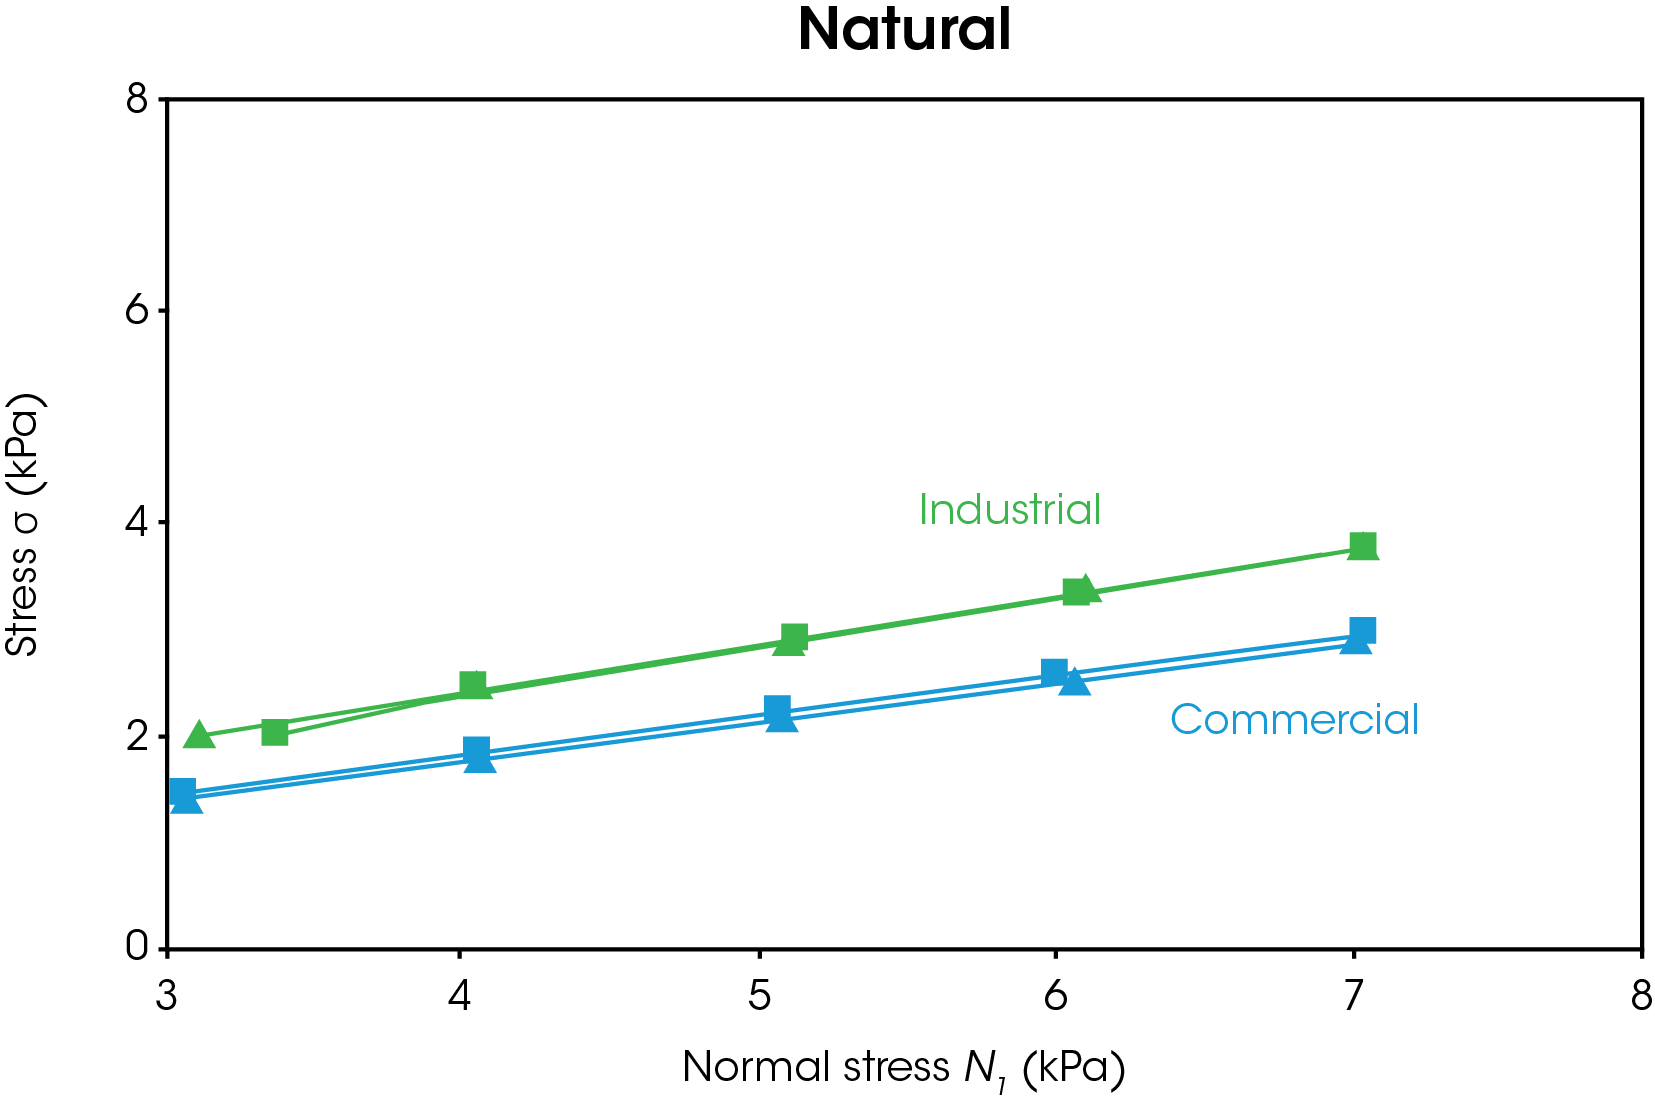
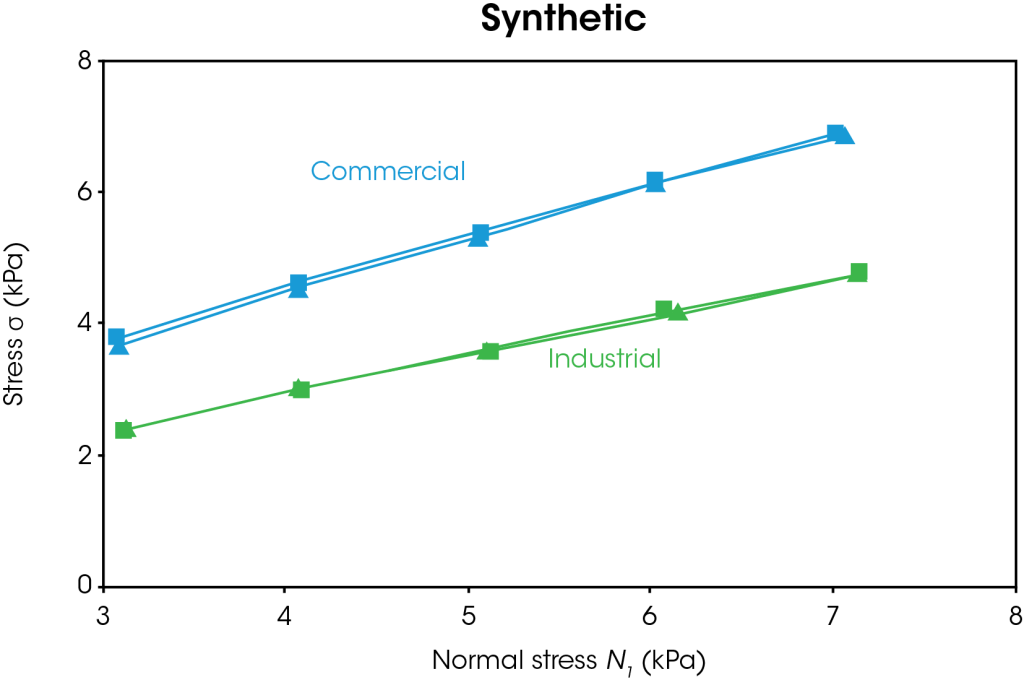
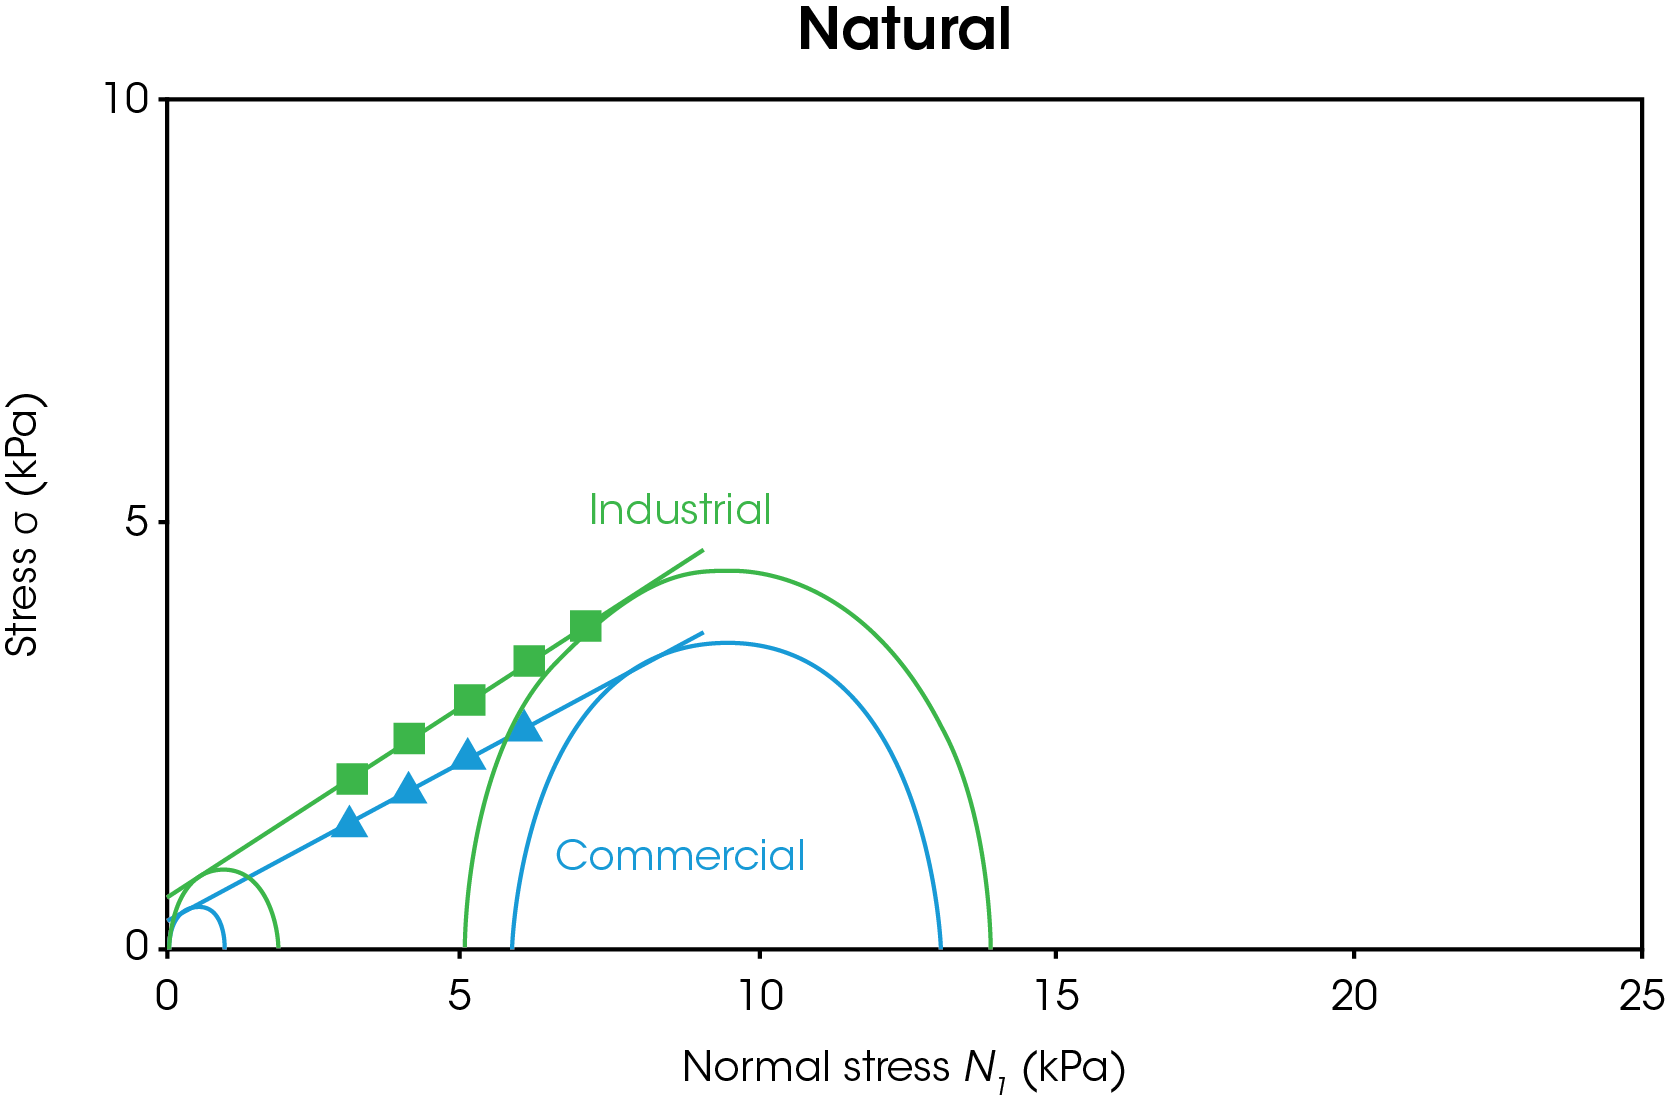
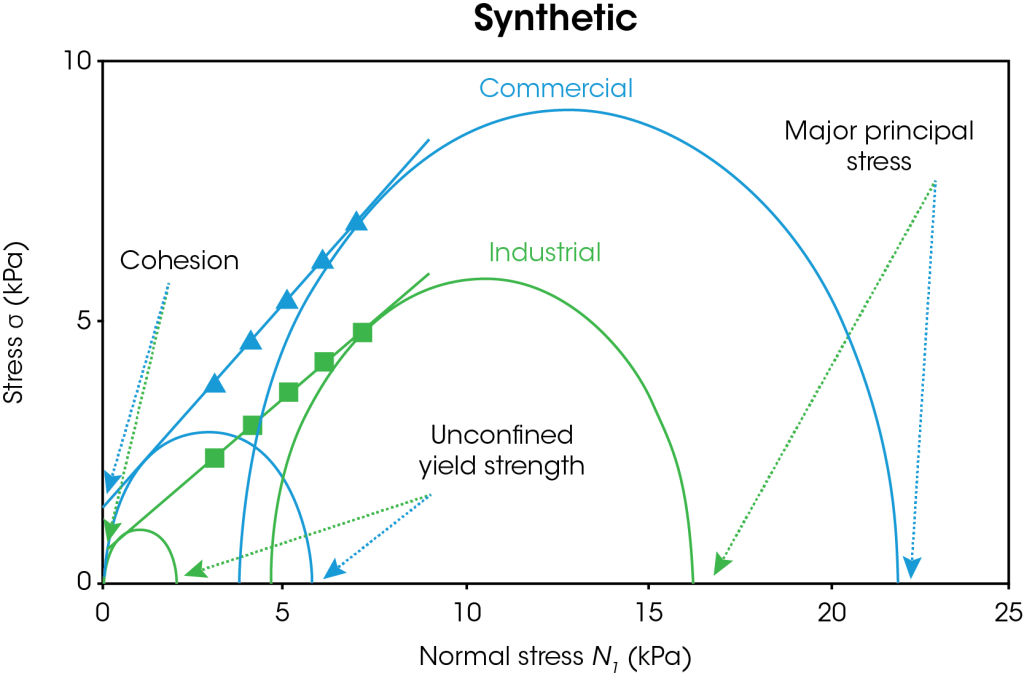
Table 1. Powder shear results for commercial and industrial natural and synthetic graphite with percent difference between natural and synthetic.
| Commercial | Industrial | |||||
| Natural | Synthetic | Difference (%) | Natural | Synthetic | Difference (%) | |
| Cohesion (Pa) | 310 ± 30 | 1320 ± 110 | 326 | 530 ± 70 | 610 ± 50 | 15 |
| Unconfined Yield Strength (Pa) | 880 ± 90 | 5470 ± 400 | 522 | 1670 ± 210 | 2130 ± 150 | 28 |
| Major Principal Stress (Pa) | 12960 ± 100 | 21980 ± 170 | 70 | 13850 ± 60 | 16250 ± 10 | 17 |
Conclusions
Graphite is a key lithium-ion battery anode component. Manufacturers may use natural or synthetic graphite, depending on the application and purity requirements. As demonstrated here, graphite properties can vary significantly between sources and types. Powders with high cohesion and poor flow properties can result in inhomogeneous slurries or dry mixing, resulting in defects in electrodes leading to battery cell failure. The TA Instruments Powder Shear Cell can be used to quantify these differences, to help optimize storage and mixing conditions and screen incoming raw materials.
References
- H. Zhang, Y. Yang, D. Ren, L. Wang., X. He, “Graphite as anode materials: Fundamental mechanism, recent progress, and advances,” Energy Storage Materials, 2021.
- J. Asenbauer, T. Eisenmann, M. Kuenzel, A. Kazzazi, Z. Chen, D. Bresser, “The success story of graphite as a lithium-ion anode material – fundamentals, remaining challenges, and recent developments including silicon (oxide) composites,” Sustainable Energy and Fuels, 2020.
- G. Mehos, “Using Solids Flow Property Testing to Design Mass- and Funnel-Flow Hoppers,” Powder and Bulk Engineering, 2020.
- T. Chen and H. Lau, “Rheological Evaluation of Battery Slurries with Different Graphite Particle Size and Shape,” https://www. tainstruments.com/pdf/literature/RH119.pdf.
- J. Vail, S. Cotts, T. Chen, “Powder Rheology of Lactose: Impacts of powder morphology on performance of pharmaceutical excipients,” https://www.tainstruments.com/pdf/literature/RH123.pdf.
- “ASTM D7891-15 Standard Test Method for Shear Testing of Powders Using the Freeman Technology FT4 Powder Rheometer Shear Cell,” ASTM International, 2016.
Acknowledgement
This note was written by Kimberly Dennis, PhD, Applications Scientist, and Sarah Cotts, Rheology Product Specialist.
TA Instruments has been long recognized as an innovator and leader in modulated thermal analysis.
Click here to download the printable version of this application note.

