Keywords: Rheology, EIS, Impedance, Lithium-ion batteries, cathode, anode, conductive additive, carbon black
RH132
Abstract
Carbon black is typically used as a conductive additive in lithium-ion battery electrodes. Electrical conductivity of the carbon black structure may affect the electrode and battery performance. The fine carbon particles tend to aggregate with each other and form a network-like structure in the paste. To obtain information about the conductive structure, the rheological and electrochemical properties of pastes were investigated in carbon black pastes using TA Instruments™ Discovery™ Hybrid Rheometer with a dielectric accessory and an impedance analyzer. Simultaneous measurements of rheology and electrochemical impedance were performed under applied oscillatory shear. It was found that large deformation of the paste causes collapse of the network-like structure, impacting both its rheological and conductive properties.
Introduction
Lithium-ion batteries (LIB) consist of various active and inactive materials that are manufactured through multistep processes. Both the properties of the materials and conditions of the processes can affect the final battery performance. Electrodes in particular are positioned as one of the most important components that influence battery performance. The electrode of LIB consists of active materials, binder, and conductive additives. It is manufactured through a multistep process of mixing, coating, drying, calendaring, and cutting. In the cathode of LIB, fine carbon particles are typically included to compensate for the poor conductivity of the active materials. The carbon particles agglomerate around the active particles, as shown in Figure 1, to form a percolation network to conduct electrons to the current collector. This structure, which forms in the slurry prior to coating, is frequently sheared during the mixing and coating process. The large shear during the coating process may cause destruction of the carbon particle network, although it could be reconstructed after removal of the shear [1]. Understanding the behavior of the conductive structure is important in process condition design and quality control of electrodes.
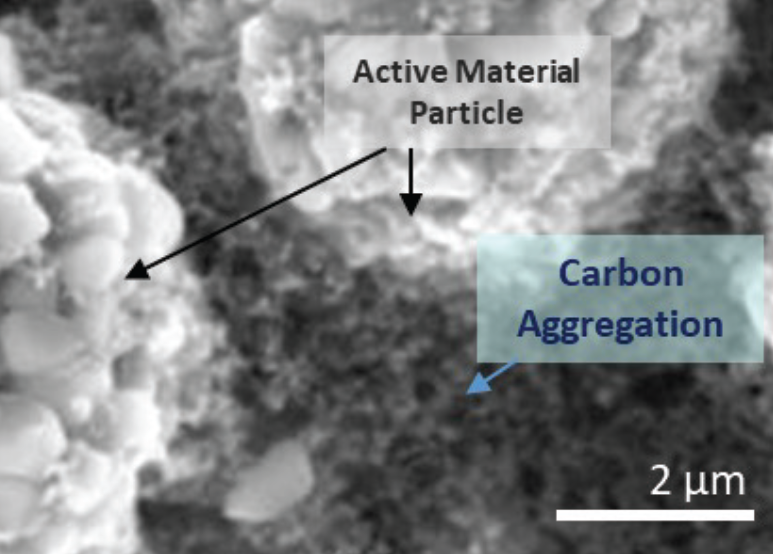
Rheology can be used as a structural analysis method in dispersion systems such as electrode slurries and carbon pastes. When the network-like structures are formed by particles and polymers in the system, the rheological behavior is dominated by these structures. This results in higher viscosity and quasi-solid properties; however, rheology on its own does not characterize the electronic conductivity networks formed by submicron carbon black. Electrochemical impedance spectroscopy (EIS) tests have recently attracted attention due to its ability to evaluate conductive inner structures in dispersion samples for LIB [2] [3]. In this article, simultaneous rheological and EIS measurements are utilized to investigate the impact shear has on the inner carbon structure of a typical cathode paste.
Experimental
Carbon black (CB), polyvinylidene fluoride (PVDF) binder, and N-methylpyrrolidone (NMP) solvent were provided by DAINEN MATERIAL Co. CB pastes with different compositions, shown in Table 1, were prepared using a planetary centrifugal mixer. Pastes A and B have a total solids content of 11 wt.%; Paste A does not include PVDF, whereas paste B does. A control sample of PVDF binder + NMP solution was also prepared.
Table 1. Ratio of CM/PVDF/NMP for sample compositions
| Sample | CB | PVDF | NMP |
|---|---|---|---|
| paste A | 1 | 0 | 8 |
| paste B | 1 | 1 | 16 |
| control | 0 | 1 | 12 |
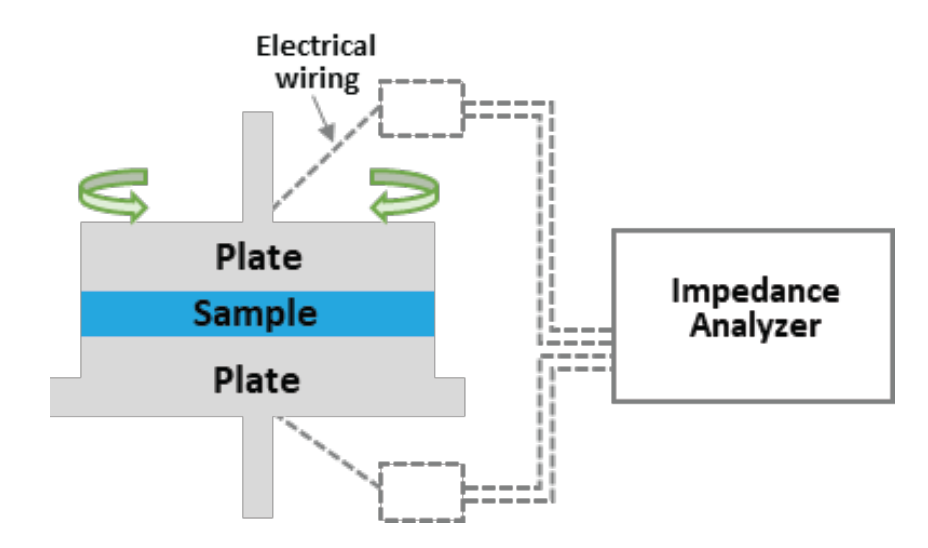
TA Instruments Discovery Hybrid Rheometer was used to measure rheological properties. Frequency sweeps were done at constant strain of 0.5% and temperature 25 °C with 25 mm parallel plates. EIS tests were performed with 100 mV constant voltage and 4 Hz – 8 MHz AC frequency range by connecting an impedance analyzer (HIOKI, IM3536 LCR meter) to the rheometer’s dielectric measurement accessory with parallel plate electrodes of 25 mm diameter, as shown in Figure 2. First, EIS data of the slurry at initial state was collected with plate movement locked. Next, EIS measurements with oscillatory shear were performed with upper plate oscillation at 10 Hz and strain in the range of 0.1-100%. Finally, the recovery data was collected again with plate movement locked after the oscillation.
Results and Discussion
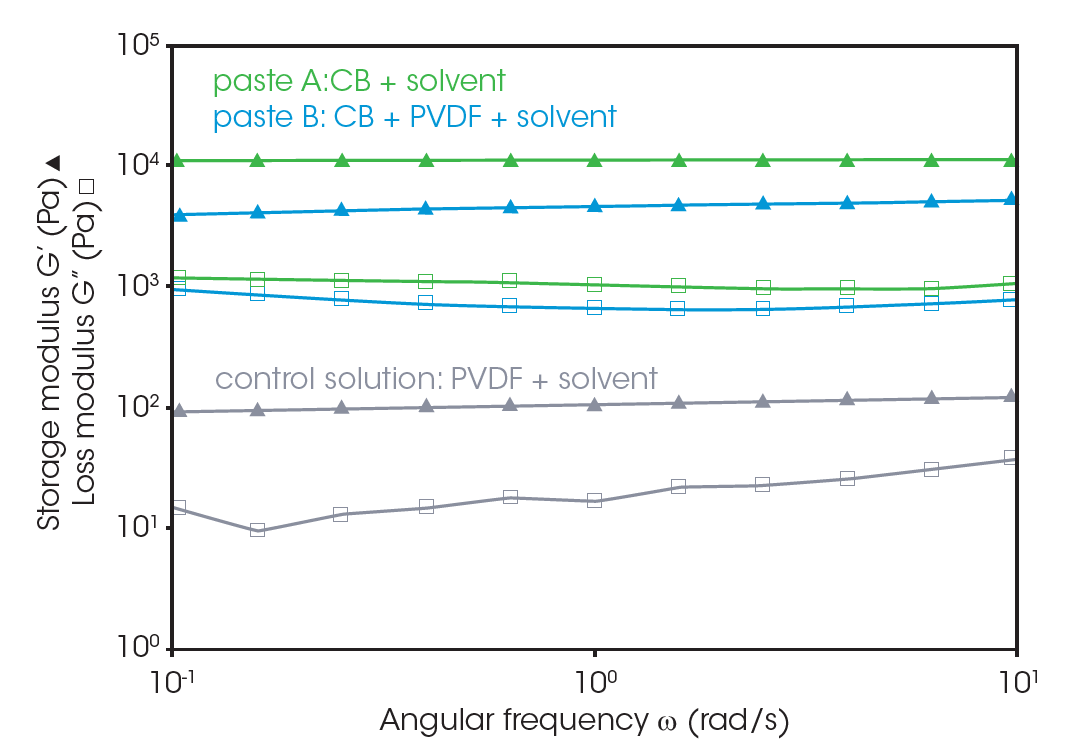
Rheology is a popular technique for characterizing electrode slurries in the R&D and process control stages. Frequency dependencies of the storage (G’) and loss (G”) moduli of the three pastes are shown in Figure 3. The pastes with CB have a significantly higher G’ than that of the control solution. G’ and G” remain relatively constant over the measured frequency range, with G’ being higher than G”. The rheological parameters indicate that these pastes have quasi-solid property and that continuous, relatively firm microstructures form in the system. These microstructures from CB fine particles aggregate and construct network-like structures. Paste A exhibits higher G’ than paste B, suggesting that the binder of PVDF could inhibit formation of CB particle aggregation structure.
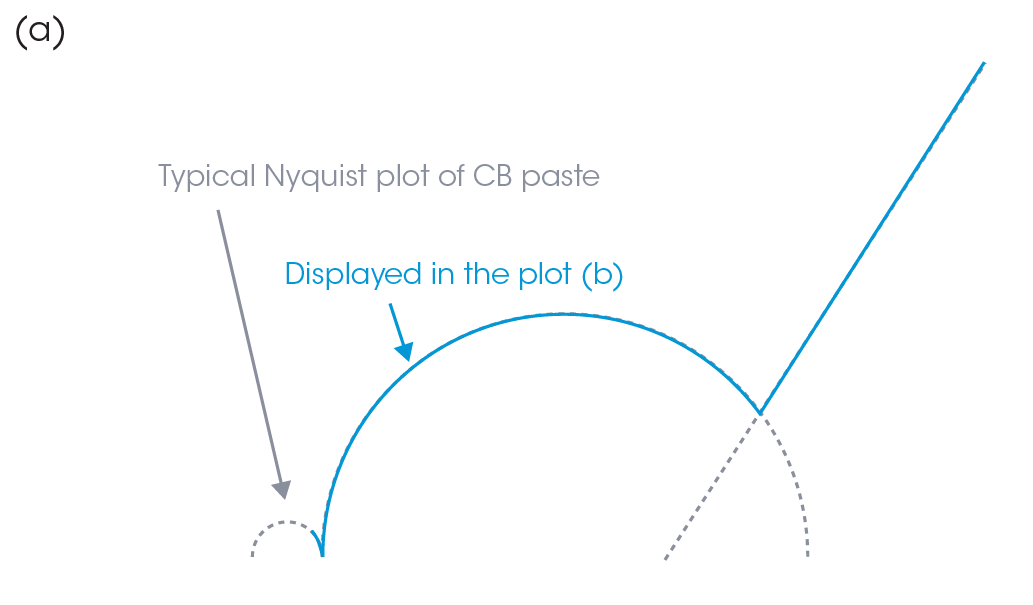
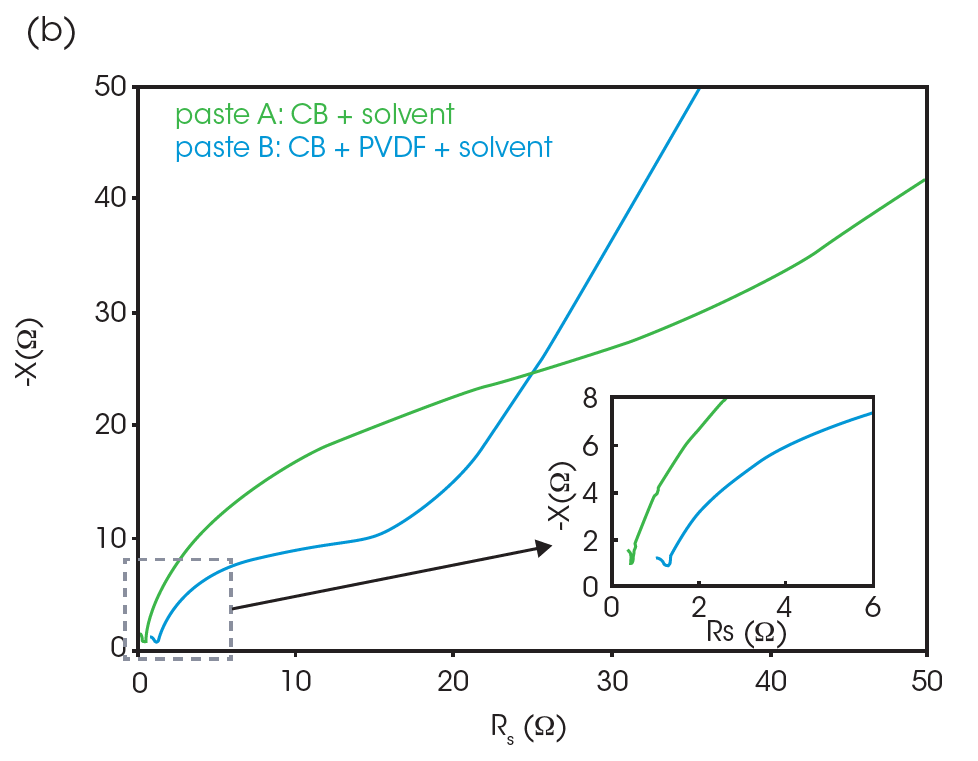
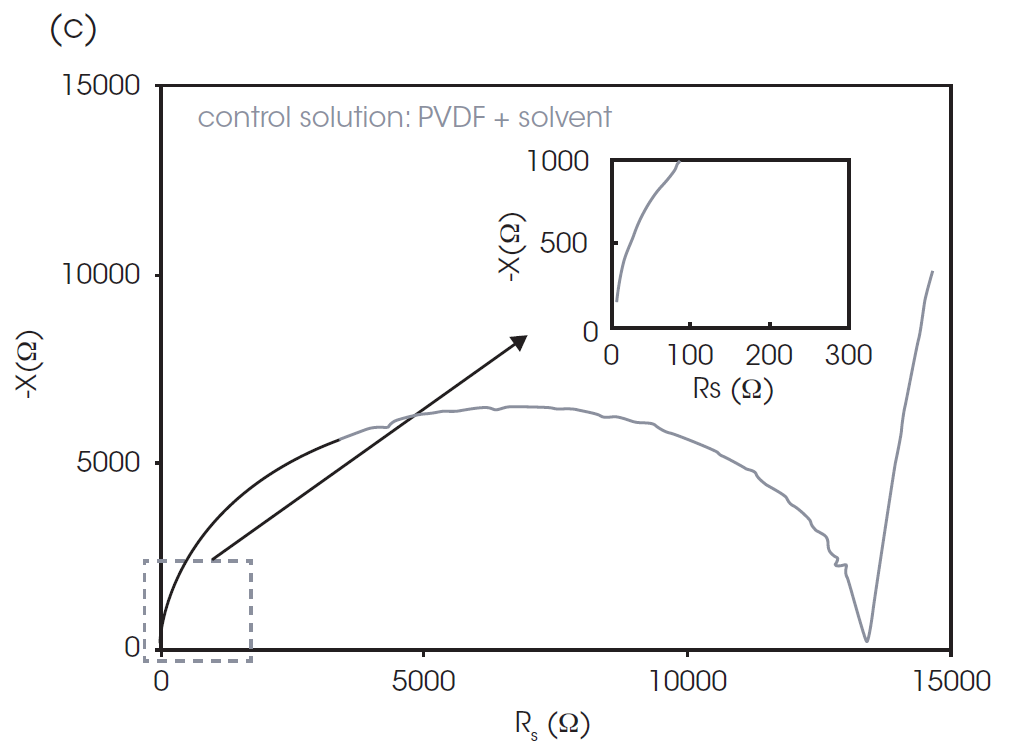
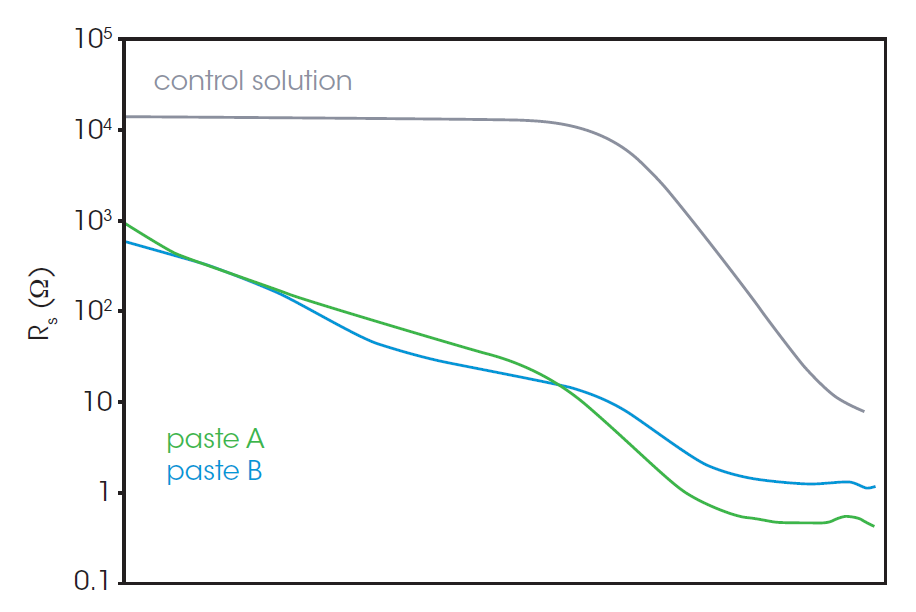
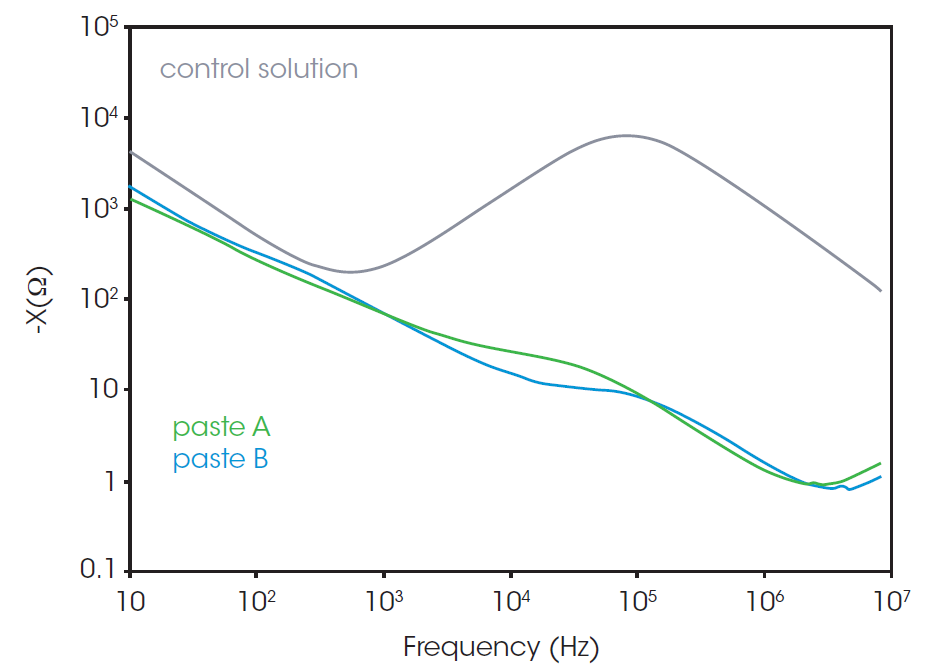
To get more information about the CB conductive structure inside the pastes, the parallel plates of the rheometer were connected to the impedance analyzer to measure EIS. Figures 4 and 5 show Nyquist and Bode plots, respectively. In a Nyquist plot, the x-axis is the real component (resistance, Rs) and the y-axis is imaginary component (reactance, X) of the impedance, as shown in Figure 4a. The data at the higher frequency is plotted closer to the origin of the x- and y- axes. A Nyquist plot will often feature one or more semicircular components and a linear region, such as in Figure 4a. While the interpretation relies heavily on knowledge regarding the cell composition and parameters, some general statements can still be made. The semicircles are typically associated with the resistance and capacitance of the cell components, with the x-axis intercept on the right of the semicircle representing the total cell resistance. The linear region found at lower frequencies is associated with diffusion processes. Often these regions overlap, as in Figure 4b, complicating the interpretation.
Figure 4c shows a control experiment containing no CB, only the PVDF binder and NMP solvent. The plot simply consists of a semicircle in the low AC frequency range (100 kHz-1 MHz) and a straight line. The scale of this semicircle indicates high resistance (13.5 kΩ). Figure 4b shows the Nyquist plots of paste A and paste B. The overall resistance of pastes A & B is much lower relative to the control solution. Paste B has a smaller semicircle than that of paste A. This is consistent with expectations, as the addition of CB decreases the overall resistance of the sample and the PVDF binder increases it slightly.
The tails of the higher frequency semi-circles of pastes A and B are shown in the inset of Figure 4b. The existence of the higher frequency semicircle was confirmed using a separate LCR meter and probe which is available to measure impedance in the range over 10 MHz. The representative model of the Nyquist plot of CB paste is shown in Figure 4a. The left (high frequency) semicircle is associated with the CB and does not appear in the control solution. The left-side intercept, or the contact point of left and right semicircles, represents the resistance concerning CB. The contact point of the plot of paste B has a higher x value, which indicates the higher resistance associated with CB.
The difference in resistance between pastes A and B is easily found in the AC frequency range over 1 MHz in the Bode plot, shown in Figure 5. Paste B shows a higher Rs at high frequency (over 1 MHz) compared to paste A. The higher Rs of paste B most likely indicates that the binder reduces the formation of a conductive network by CB particles.
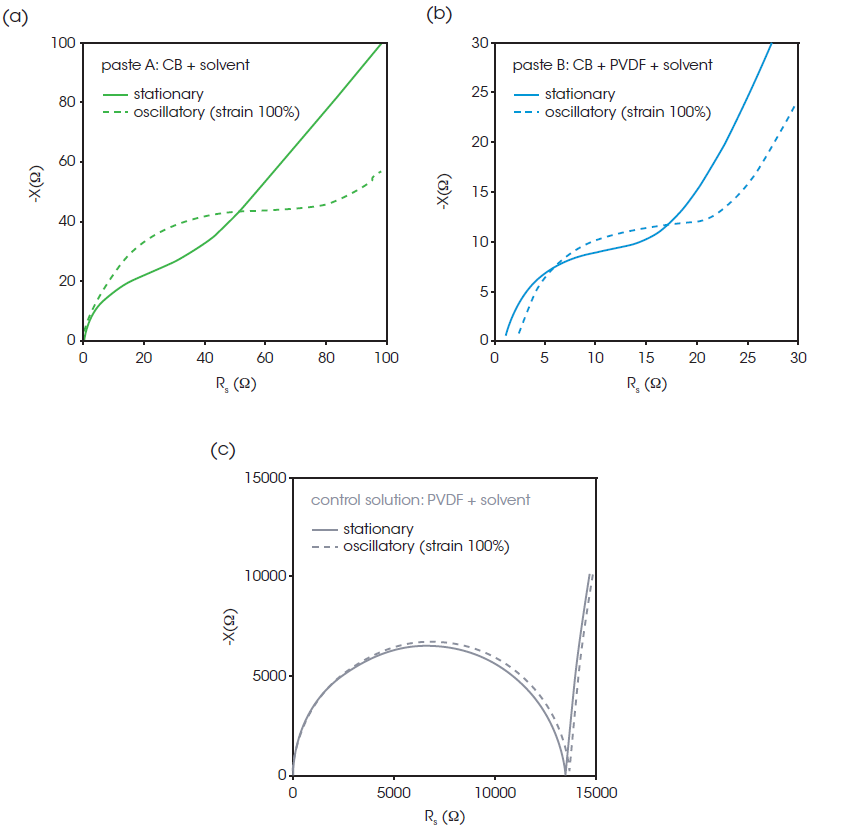
During the electrode manufacturing process, the slurry experiences large shear deformations during coating. To obtain information on structural failure due to shear deformation, impedance measurements of the pastes were performed with oscillatory shear deformation and simultaneous measurement of rheology. Figure 6 shows Nyquist plots when the upper plate is fixed and oscillated at 10 Hz frequency and 100% strain. The plots of pastes A (Figure 6a) and B (Figure 6b) show significant change by oscillatory shear, while the plots with and without oscillatory shear are identical in the control solution (Figure 6c). The larger semicircle and higher resistance of oscillatory compared to stationary indicates that the CB conductive network is disrupted by shear in both pastes A and B. The changes in the plots demonstrate that the conductive CB structure will change as a function of shear.
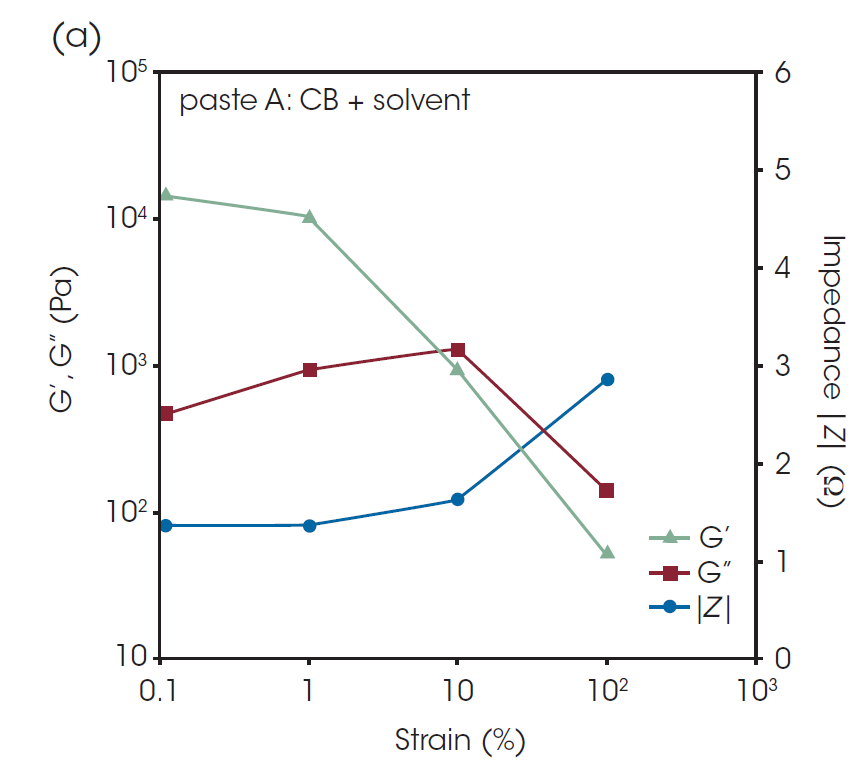
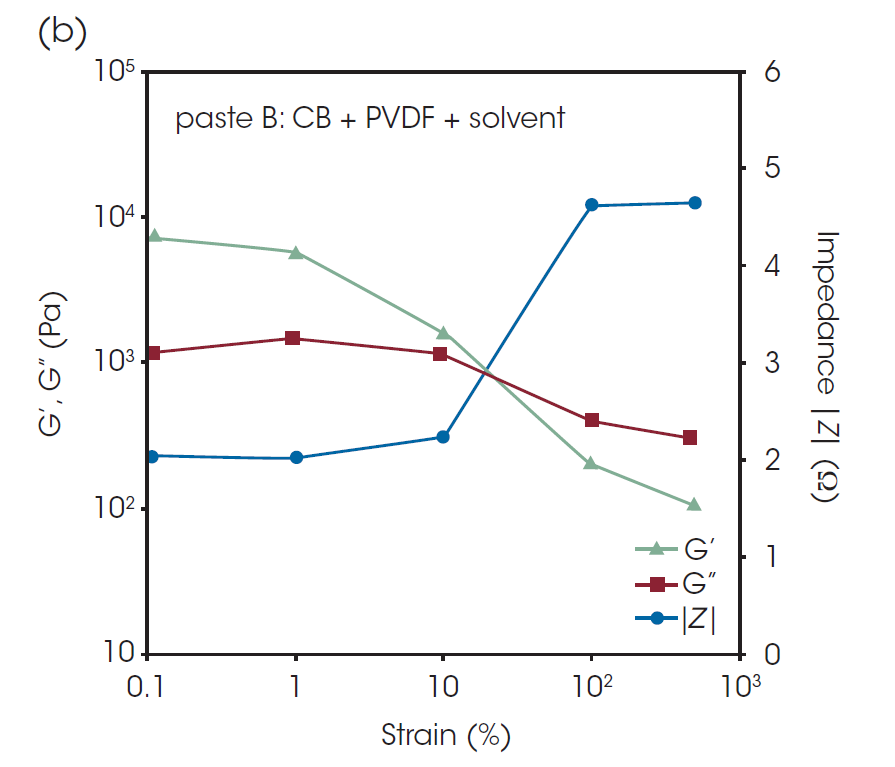
In Figure 7, G’, G”, and the impedance │Z│at AC frequency of 1 MHz of paste A and paste B are plotted against the oscillatory strain from 0.1% to 500%. G’ at 1% strain was lower than that at 0.1% strain, suggesting that structural collapse occurred even with relatively small deformation. After 100% strain, a dramatic change in impedance was observed, indicating that a small shear deformation does not have a large effect on the conductive path, but large-scale deformation causes a serious structural collapse of the conductive network. [1]
The recovery behavior after shear deformation is important for characterization of pastes and slurries for LIB. The G’ and │Z│of the pastes before and after the large oscillatory shear deformation are shown in Table 2. It is found that the G’ and │Z│ after the deformation have not completely returned to the level before the deformation in the values of both pastes. Paste A has the higher G’ and lower Z before the shear deformation, but there are not significant differences between the pastes after the deformation. This indicates that the binder did not significantly affect the properties after coating process.
Table 2. Storage modulus and impedance before and after oscillatory shear at 100% and 10 Hz for 120s
| Before Oscillation | After Oscillation | |||
|---|---|---|---|---|
| paste A | paste B | paste A | paste B | |
| G’ (kPa) | 11.5 | 4.8 | 1.8 | 1.9 |
| │Z│ (Ω) | 1.4 | 2.1 | 2.8 | 3.4 |
Conclusions
The rheological and electrochemical properties of carbon black pastes, which are typically used in LIB electrodes as a conductive additive, were investigated using TA Instruments Discovery Hybrid Rheometer with a dielectric accessory and an impedance analyzer. The CB pastes including PVDF, showed lower elastic modulus and higher resistance than the sample without PVDF. It is expected from the results that the binder would inhibit the formation of the conductive network structure of the CB particles. In addition, simultaneous measurement of rheology and EIS was performed with oscillatory shear in the CB paste. It was found that large deformation causes collapse of the structure, impacting both rheological and conductive properties of the paste. The sensitivity of the CB network structure to shear is valuable information for designing materials and processes used for LIB electrode slurries. This information is readily obtained by coupling the rheometer system to an impedance analyzer, allowing researchers and manufacturers to easily determine the relationship between CB network structure and shear.
References
- Q. Liu and J. J. Richards, “Rheo-electric measurements of carbon black suspensions containing polyvinylidene difluoride in N-methyl-2-pyrrolidone,” Journal of Rheology, vol. 67, no. 3, pp. 647-659, 2023.
- M. Gaberšček, “Understanding Li-based battery materials via electrochemical impedance spectroscopy,” Nature Communications, vol. 12, no. 6513, 2021.
- Z. Wang, T. Zhao, J. Yao, Y. Kishikawa and M. Takei, “Evaluation of the Electrochemical Characterizations of Lithium-Ion Battery (LIB) Slurry with 10-Parameter Electrical Equivalent Circuit (EEC),” J. Electrochem. Soc., vol. 164, no. A8, 2017.
Acknowledgement
This note was a collaboration between DAINEN MATERIAL Co. and TA Instruments. It was written by Yuki Kawata, Ph.D., Jeremy May, Ph.D., and Hang Lau, Ph.D. at TA Instruments.
Click here to download the printable version of this application note.

