Keywords: differential scanning calorimetry, melting, thermoplastic polymers
TA300
Abstract
DSC step annealing is used to study the fine molecular structure of poly(vinylidene fluoride) (PVDF) homopolymers and copolymers. The melting pattern, obtained after step annealing, is a characteristic “fingerprint” for small variations in structure. This “fingerprint” detects variations in the polymerization process, the molecular weight of the polymer, the fraction and the nature of the co-monomer.
Introduction
Molecular structure of a polymer largely determines its final material properties. For this reason characterization of variations in molecular structure is an important issue. For poly(vinylidene fluoride) (PVDF) homopolymers small variations in polymerization conditions can result in noticeable differences in chain heterogeneity and hence in physical properties. Moreover the average molecular weight and molecular weightdistribution of the polymer chains are important processing characteristics. For PVDF copolymers the properties are dependent upon the type and fraction of the co-monomer. It is important to have a technique for detection of small batch-to-batch variations or homopolymer contamination of copolymer for quality control of the PVDF polymerization process. DSC is an ideal candidate for this purpose as it is robust, easy to implement and generate accurate results rapidly.
A key element in establishing relationships between structure and properties is the characterization of the length of crystallizable segments. Segregation techniques using DSC for stepwise fractionation according to crystallizability have been described in literature for several types of polymers. Judovits used Stepwise Isothermal Segregation Technique (SIST) to study PVDF copolymers (1). Arnal and coworkers developed a Successive Self-nucleation/Annealing (SSA) procedure to characterize the short chain branching distribution in ethylene/α-olefin copolymers (2). This research group also studied functionalized polyolefins, crosslinked polyethylene as well as crystallizable blocks within triblock copolymers with SSA. The basis for SSA was conceived by Fillon who used it to define an efficiency scale for nucleating additives for polypropylene (PP) (3). Heyez “fingerprinted” isotactic PP by using SSA (4). 2 TA300
In this study, DSC step annealing (or SSA) is applied to PVDF homopolymers and copolymers (5). SSA is preferred over SIST because of the shorter experimental time involved. The influence of polymerization conditions, molecular weight, type and fraction of co-monomer on the DSC thermal curve after SSA segregation is studied.
Experimental
Solvay’s PVDF homopolymers and copolymers were investigated. For the first series of homopolymers (two batches of Solef® 1010), polymerization conditions varied slightly. For the second set (Solef® 6008 and 6020), the intrinsic viscosity in dimethylformamide (DMF) is between 6 and 20 mL/g. The copolymers are based on vinylidene fluoride and hexafluoropropylene (HFP) or vinylidene fluoride and chlorotrifluoroethylene (CTFE). The co-monomer fraction is 10 to 15 % (Solef® 21008, 21508, 31008). All copolymers have viscosities of 8 mL/g in DMF.
The DSC measurements are performed on a TA InstrumentsTM DSC with TzeroTM technology. This technology offers significant advantages for the study of step annealed polymers, including a flat baseline and superior resolution.
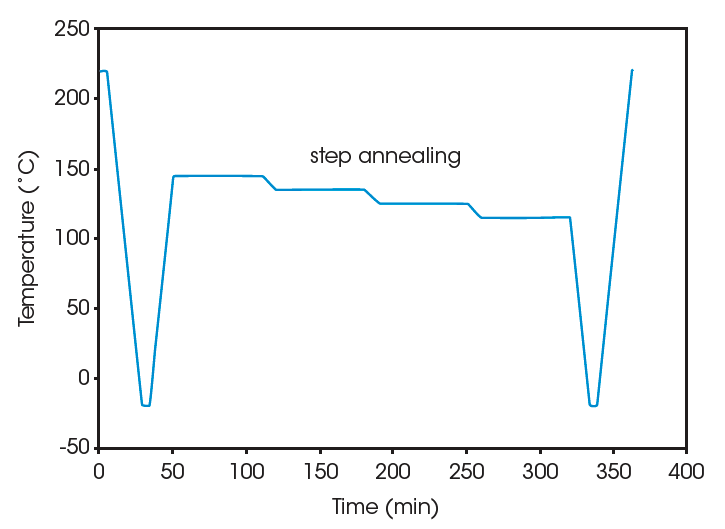
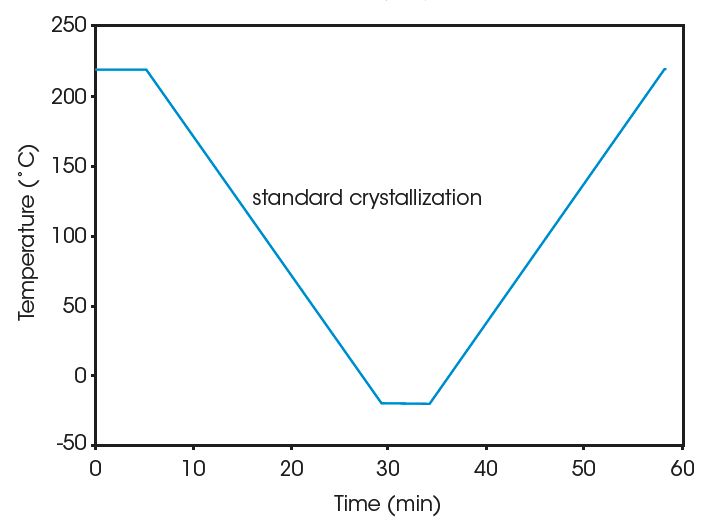
Crystallization of the PVDF samples is performed in the DSC. The thermal history is first erased by heating the sample well above its melting region (250 °C for 5 min for the homopolymer, 220 °C for 5 min for the copolymer). The sample is then cooled to well below its crystallization region (e.g., -20 °C) at 10 °C/min to create a common thermal history. This is referred to as “standard” crystallization. Subsequently step annealing is applied to provide molecular segregation. For the homopolymer the step annealing program consists 60 min at each of 4 consecutive temperature (170, 175, 165, and 155 °C). For the copolymer the temperatures of 145, 135, 125, and 115 °C are used. Finally the material is cooled to –20 °C, and the effect of the step annealing on the melting pattern is studied by heating at 10 °C/min up to 250°C. For comparison, the melting pattern after standard crystallization is also measured. The time-temperature program for both series of experiments (step annealing versus standard crystallization) is shown in Figure 1. Details on the choice of temperatures for the isothermal platforms are found in (2).
Results and Discussion
Figure 2 compares the melting of two PVDF homopolymers with slightly different polymerization conditions. For the curves at the left, standard crystallization is applied prior to melting the samples, while for the curves at the right step annealing is applied. After standard crystallization, there is little difference observed between the thermal curves, while after step annealing a clear distinction in the melting pattern is found. For batch 2 the highest peak is at slightly higher temperature (181.1 versus 179.9°C) and contains more of the total melting area (35.5 versus 25.8%). This conforms to a higher ratio of the longer crystalline sequences for batch 2.
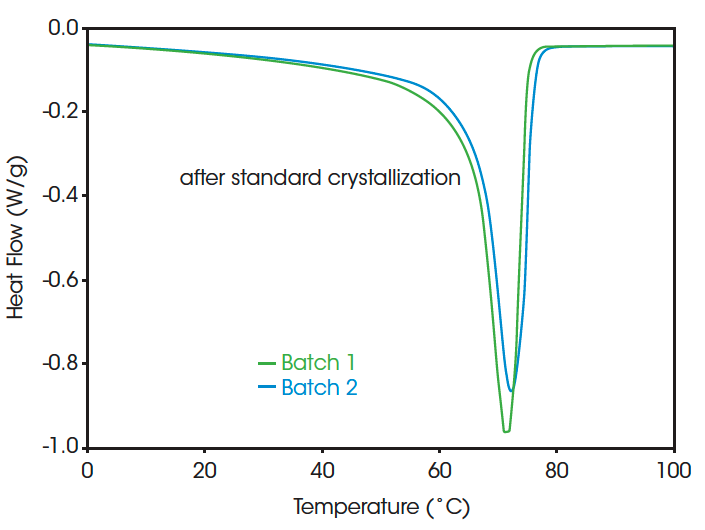
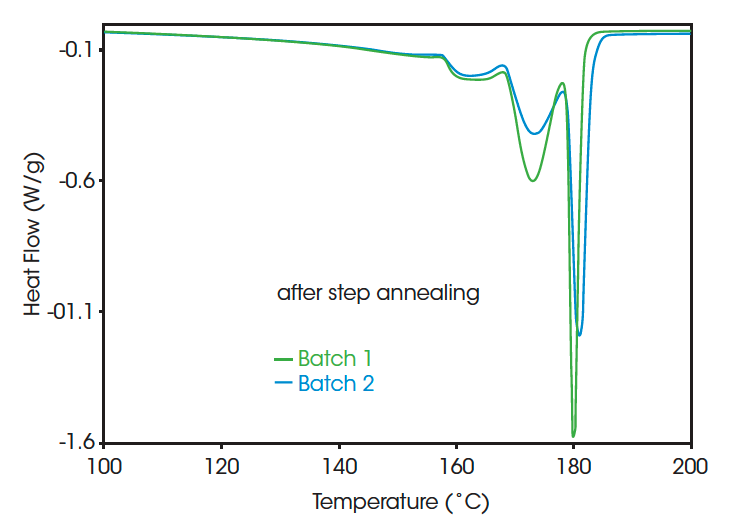
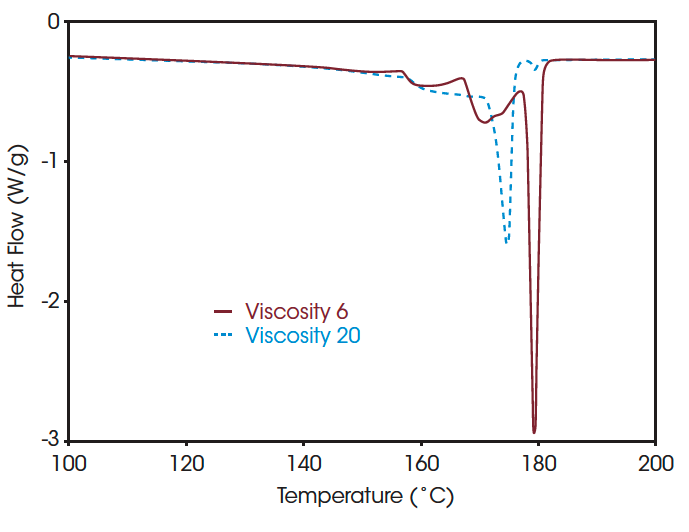
Figure 3 compares two PVDF homopolymers with different molecular weight. Only the melting pattern after SSA is shown, since again the melting after standard crystallization shows little differentiation. A very clear distinction between the grades with different molecular weight can be made. Only the homopolymers with a low molecular weight have long sequences with a melting point near 179.3 °C. This is probably related to the higher mobility for crystallization in less viscous systems.
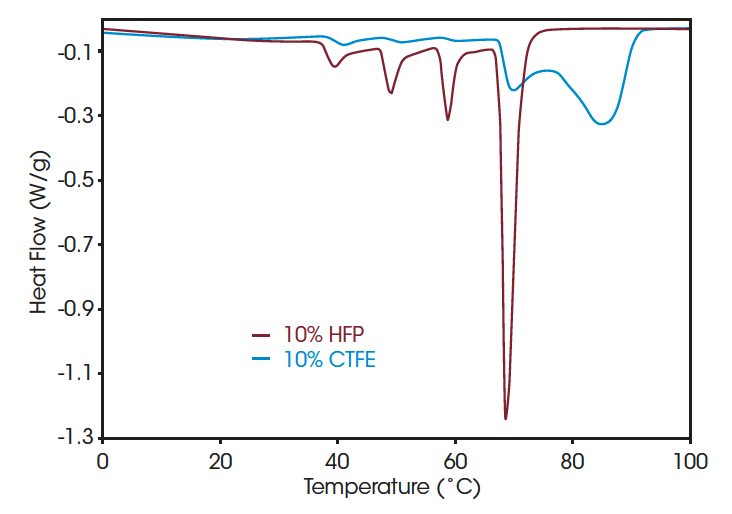
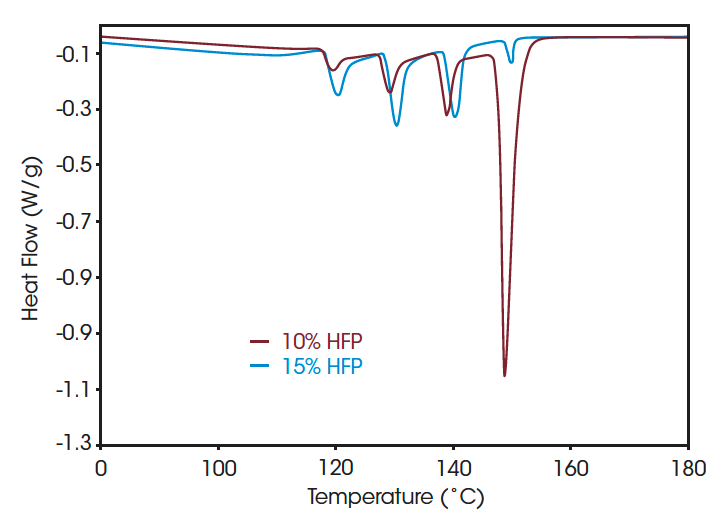
Figure 4 shows melting curves after SSA for PVDF copolymer with 10 % HFP or CTFE co-monomer, as well as 15 % HFP co-monomer. It is clear that the introduction of HFP co-monomer dramatically reduces the maximum melting temperature. A clear distinction in melting pattern is seen for the polymers with different type of co-monomer. For the HFP co-monomer an increase of 5 % of its fraction reduces the amount of longer crystalline sequences with melting point near 148.7 °C (from 39.5 % of the total area to 3.4 %).
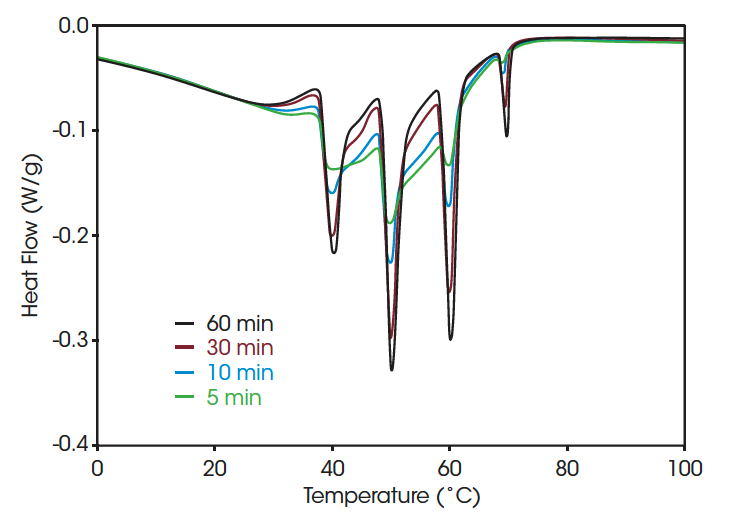
To use DSC step annealing for quality control purposes, the experimental time involved needs to be minimized. One way to do this is to minimize the time of the isothermal steps. Figure 5 shows the effect of reducing the time from 60 down to 5 min. A “fingerprint” with all the relevant peaks present is obtained after 5 min, but at least 30 min is required to obtain an image that is independent of the isothermal hold time.
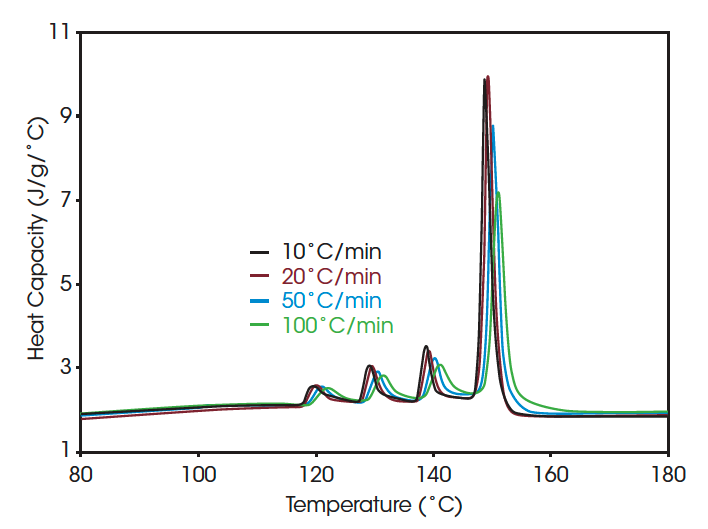
Another way to reduce experimental time is by increasing the heating rate of the final heating step. Figure 6 shows the melting pattern obtained at heating rates ranging from 10 to 100 °C/min. In order to facilitate direct comparison of the curves at different heating rates, heat capacity units are plotted. This is possible since the DSC allows direct measure of heat capacity (8). Even at the very high heating rate of 100 °C/min the multiple peaks fingerprint is still clearly established, and the ratio of the different peaks remains essentially unchanged. This is made possible by the extremely good resolution obtained by employing Advanced TzeroTM DSC technology (7).
Conclusion
The step annealing DSC technique yields a very sensitive tool to detect small variations in the molecular structure of PVDF. The experimental time for step annealing measurements is sufficient fast that the technique can easily be implemented for quality control (batch to batch variation) purposes.
References
- L. Judovits and S. M. Dounce, Proceedings of the 57th Annual Technical Conference, Society of Plastics Engineers, 1999, p. 2334.
- M. L. Arnal, V. Balsamo, G. Ronca, A. Sanchez, A. J. Müller, E. Canizales and C. Urbina de Navarro, Journal of Thermal Analysis and Calorimetry, 2000, 59, p. 451.
- B. Fillon, J. C. Wittmann, B. Lotz and A. Thierry, Journal of Polymer Science: Part B: Polymer Physics, 1993, 31, p.1383.
- S. Heyez, C. Doneux, J. C. Wullaert, A. Ghanem and G. Vanmarcke, European Physical Society, Conference on Morphology and Properties of Crystalline Polymers, 2001, Eger (Hungary), poster presentation.
- S. Heyez, C. Doneux, J. C. Wullaert, P. Drouillon, N. Breton and G. Vanmarcke, “Step Annealing Applied to PVDF Homopolymers”, 12th International Congress on Thermal Analysis and Calorimetry, 2000, Copenhagen (Denmark).
- R. L. Danley and P. A. Caulfield, “DSC Baseline Improvements Obtained by a New Heat Flow Measurement Technique”, Proceedings of the 29th Conference of the North American Thermal Analysis Society, 2001, pp. 667 – 672.
- R. L. Danley and P. A. Caulfield, “DSC Resolution and Dynamic Response Improvements Obtained by a New Heat Flow Measurement Technique”, Proceedings of the 29th Conference of the North American Thermal Analysis Society, 2001, pp. 673 – 678.
- L. C. Thomas, “Practical Benefits of Using Heat Capacity Versus Heat Flow Signals”, Proceedings of the 29th Conference of the North American Thermal Analysis Society, 2001, pp. 818 – 823.
Acknowledgement
This paper was written by Els Verdonck at TA Instruments.
Click here to download the printable version of this application note.

