Keywords: DSC-Raman, Differential Scanning Calorimetry, Thermoset, Spectroscopy, Epoxy Cure
TA436
Abstract
This paper illustrates the analysis of an epoxy thermoset cure with simultaneous differential scanning calorimetry and Raman spectroscopy (DSC‐Raman).
Introduction
The curing of an epoxy thermoset resin is quantified in DSC by measuring the exothermic cure reaction peak on heating. The amount of heat evolved is proportional to the degree of cure. The data in this paper demonstrate that simultaneous Raman spectroscopy can be used to track the curing process in a simple two‐part epoxy and can also be used to investigate the specific chemical process involved.
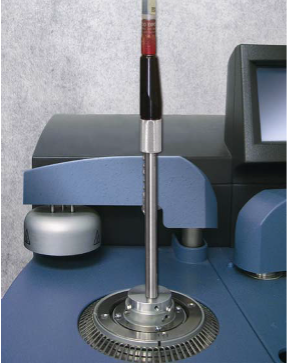
Spectral DSC is a term used to describe the combined technique of DSC with either Near IR (NIR) or Raman spectroscopy. This technique yields both vibrational and heat flow information simultaneously for materials that undergo thermally induced solid‐phase transitions. The vibrational spectroscopy can provide information on the chemical or structural changes that are occurring in the material and this information compliments the heat flow data measured by the DSC. A TA Instruments Universal Optical Accessory interface was used to support the Raman fiber optic probe and position it over the sample in the DSC. Figure 1 shows a Raman probe from Kaiser Optical Systems1 interfaced to a Q2000 DSC. Probes from several different NIR/Raman manufacturers are compatible with this accessory.

Results and Discussion
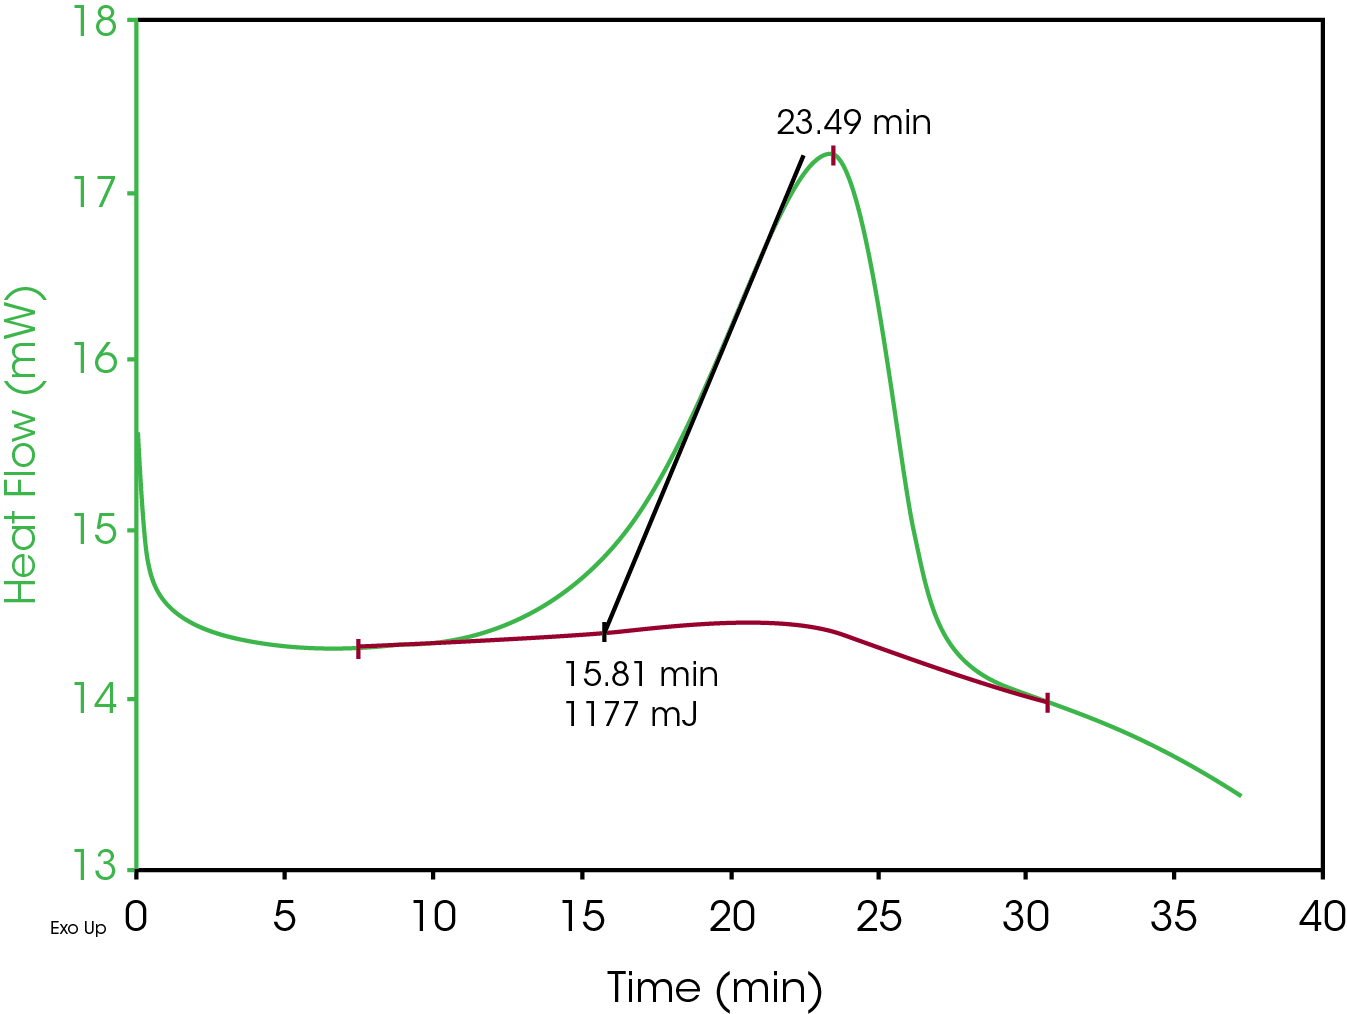
A simple two‐part epoxy consisting of a resin and a hardener was used in these investigations. DSC data was collected on a TA Instruments Q2000 with a RCS90 attached. Approximately equal quantities of resin and hardener were mixed and then a small drop was place in the center of a DSC pan with no lid. This pan was then placed in the DSC and a method was executed that first equilibrated the cell at ‐25 °C and then ramped the temperature to 50 °C at a rate of 2 °C/min. The DSC results are shown in Figure 2 (plotted versus time). The peak has been integrated to measure the heat evolved during the reaction.
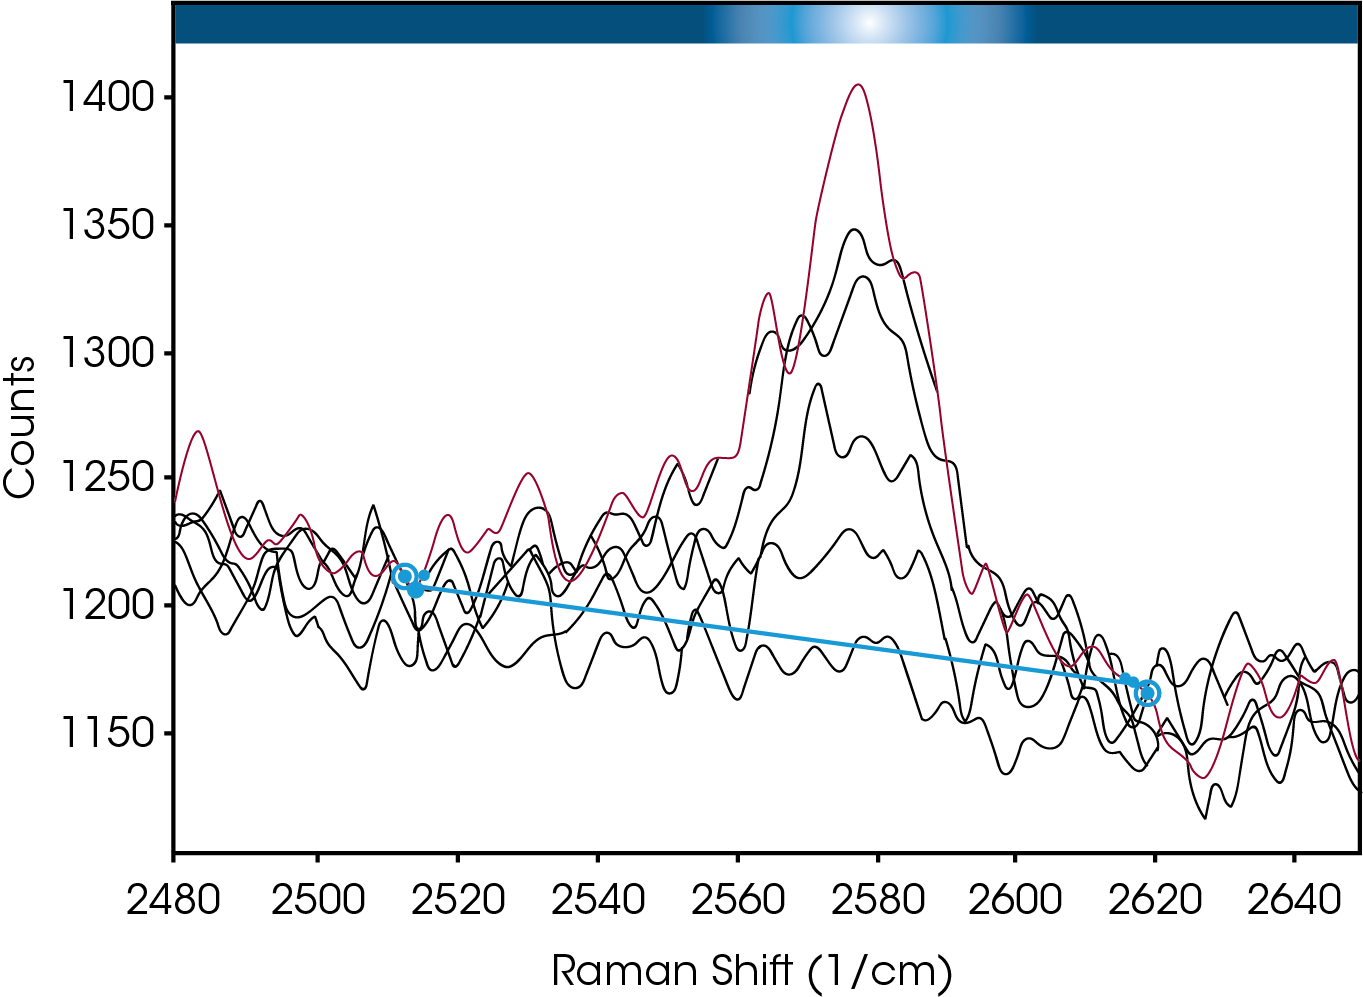
Simultaneous Raman data collected on a RamanRXN1™ (Kaiser Optical Systems, Inc.) using a MR Probe and custom immersion1. The spectral range of the Raman instrument was 150-3425 cm-1 with a laser power of ~70 mW (25% full power) from a 785 nm laser. The Raman system was set up to collect data every two minutes; each resulting spectrum was an average of three accumulations. When analyzing spectral data, it is common to look for shifts in peak positions or changes in peak intensities. As the cure progressed during this experiment, a reduction of the intensity of a peak centered at 2577 cm‐1 was evident. The data in Figure 3 demonstrate how this peak is attenuated as a result of the curing process.
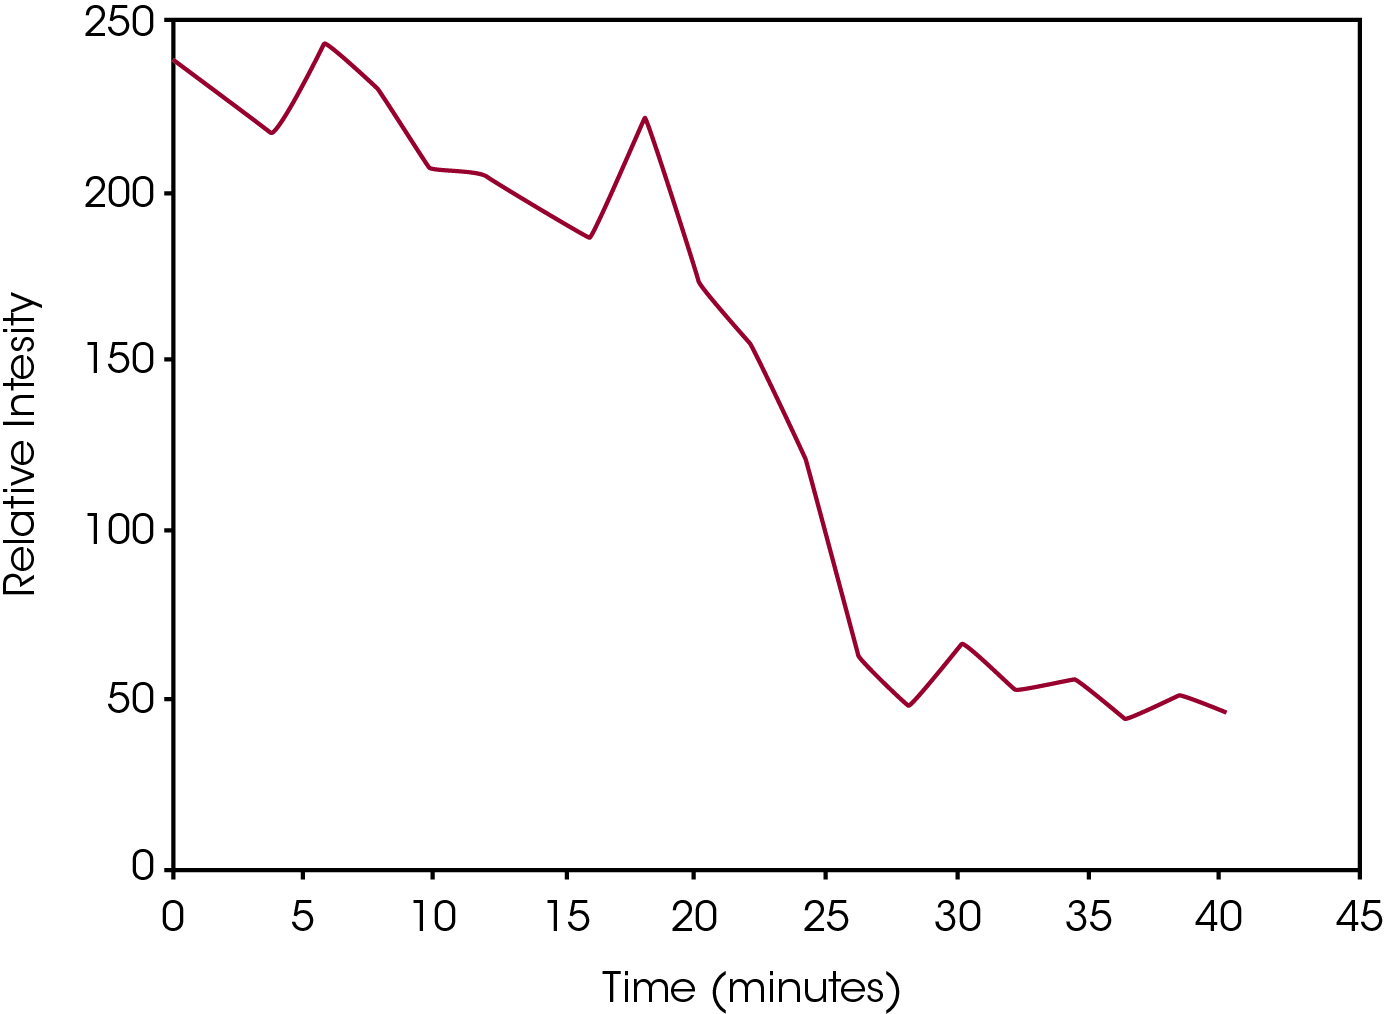
The epoxy consists of a resin that is a typical mixture of epichlorohydrin and bisphenol‐A2. The hardener is a proprietary substance, but its chemical nature is a mercaptan amine blend2.Mercaptans are also known as thiols which are organo‐sulfur compounds containing a sulfur‐hydrogen (S‐H) bond. Raman peaks between 2560 – 2590 cm‐1 are typically due to the S‐ H stretch of the thiol. Thus it is reasonable to conclude that the changes in the 2577 cm‐1 peak track the chemical conversion of hardener due to the curing process. Figure 4 contains a plot of the peak height versus time of the 2577 cm‐1 peak amplitude, and confirms the reduction in amplitude. The data compares well with is the DSC results in Figure 2 regarding the onset and end of the transition.


Conclusions
The data presented illustrates the utility of spectral DSC in investigating the chemical and thermal processes involved in the curing of a two-part epoxy system. The DSC data provides information on the heat evolved and thus could be used to determine percent cure, while the Raman data allows for the nature of the chemical change to be investigated.
References
- Kaiser Optical Systems, Inc, 371 Parkland Plaza, Ann Arbor, MI 48103.
- MSDS PowerPoxy®
- Kaiser Optical Systems Technote #1103, Characteristic Raman Vibrational Frequencies of Organic Groups.
Click here to download the printable version of this application note.

