Keywords: Thermoplastic, Polymer, Crystallization, Fractionation, Discovery X3 DSC
TA439
Background
This note will discuss the use of the Discovery X3 DSC for the thermal fractionation of the crystalline structure in polymer materials. These are generally long tests so the ability to run multiple samples immediately improves the throughput.
Discovery X3 Differential Scanning Calorimeter
The Discovery X3 DSC is a multi-sample differential scanning calorimeter allowing the simultaneous analysis of up to three samples. This approach has immediate advantages with regards sample throughput giving benefits for quality control type environments where sample throughput is important for product release. However, that increased throughput can also be advantageous when more in-depth research and development applications are being considered. Whilst conventional methodologies will remain the backbone to the DSC thermal characterization of materials, more in-depth focused methodologies can add benefit to the material detail obtained. These advanced methodologies can often have an increased test time which, whilst not ideal, is often a necessity for the data required. The ability to run three samples simultaneously goes some way to mitigate that time impact.
Stepwise Annealing of Polymers
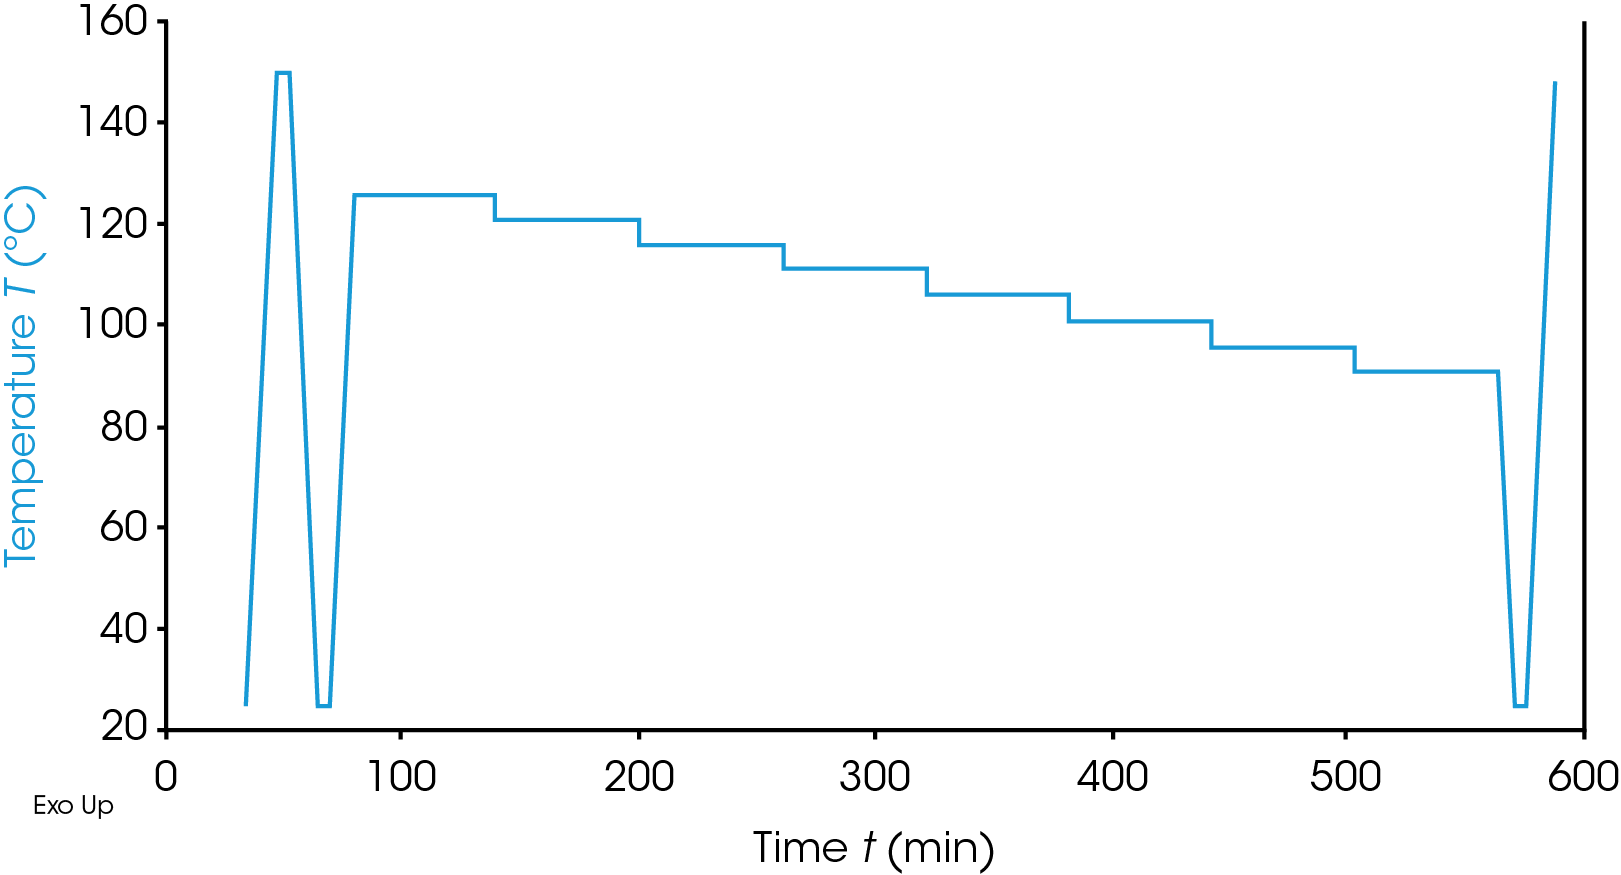
When studying polymers for processing, simple techniques such as Melt Flow Index (MFI) may be used in which the polymer is heated to a controlled temperature and then the mass rate of flow through a controlled size orifice under a fixed load is measured. This simple test gives a first pass check for a material. However, this may miss more subtle differences in materials and Differential Scanning Calorimetry (DSC) may be used to give a fuller characterization of the material. In general, in DSC characterization of a polymer the sample is heated (or cooled) and the glass transition, melt behavior and crystallization behavior (or one of these) are studied. This type of characterization may be used to check incoming material, investigate processing effects, compare competitive materials or as a starting evaluation of an alternative material. For a given polymer type differences in crystallizable chain lengths can lead to differences in crystalline morphology and ultimately physical properties. Initial simple heat – cool – reheat studies by DSC would highlight some differences however, more in-depth DSC studies, using thermal fractionation techniques can yield more data. Two main approaches for this are the Stepwise Isothermal Segregation Technique (SIST) and the Successive Self-Nucleation and Annealing (SSA) test. These two techniques have been used to characterize the crystallizable molecular fingerprint of a range of polymers including polyolefins and poly(vinylidene fluoride) [1-8]. In both techniques the materials are heated to above their melt temperature to remove any thermal history and then cooled to impart a controlled thermal history. The samples are then reheated to a chosen temperature within the melting range. In the SIST approach the sample is then held isothermal for a period to allow crystallization to occur. The sample is then stepped down in temperature (usually by 5 or 10 °C although this can be refined by the operator) and held isothermal again. This process is repeated as many times as is required covering the melting region of the polymer. The sample is then cooled to well below the melt and heated back through the melt to study the crystal structure formed. An example of the temperature profile is shown in Figure 1.
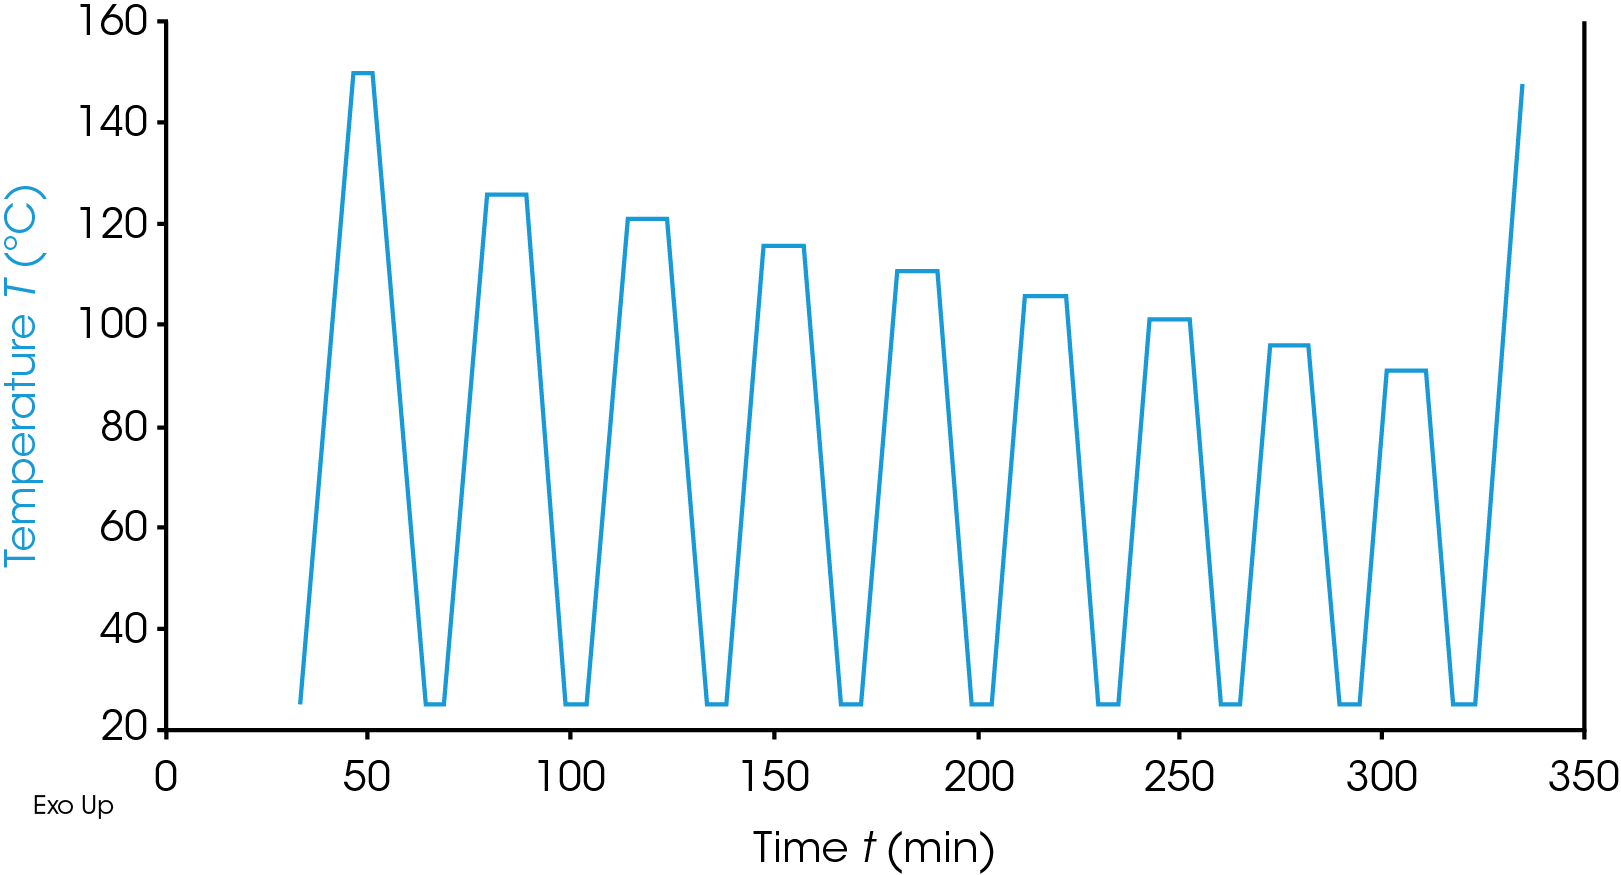
The SSA approach uses a different temperature profile in that the sample is heated to some chosen temperature in the melting range held, isothermal for a shorter period (5 to 10 minutes), and then cooled back to the lower temperature at a controlled rate, it is heated again to a temperature in the melt region but lower than the previous temperature. As with the SIST approach a reduction of 5 to 10 °C is common. Again, this process is repeated as desired, and the sample is then heated back though the melt to study the crystal structure formed. An example of the SSA temperature profile is shown in Figure 2.
It is immediately obvious that these tests are quite extensive with the examples above taking between five and nine hours. Whilst isothermal times and temperature ranges may be optimized the experimental time will still be significantly greater than a typical polymer characterization methodology and we cannot get away from these extended experimental times. Use of the Discovery X3 DSC, where three samples are run simultaneously will increase throughput three-fold.
Experimental
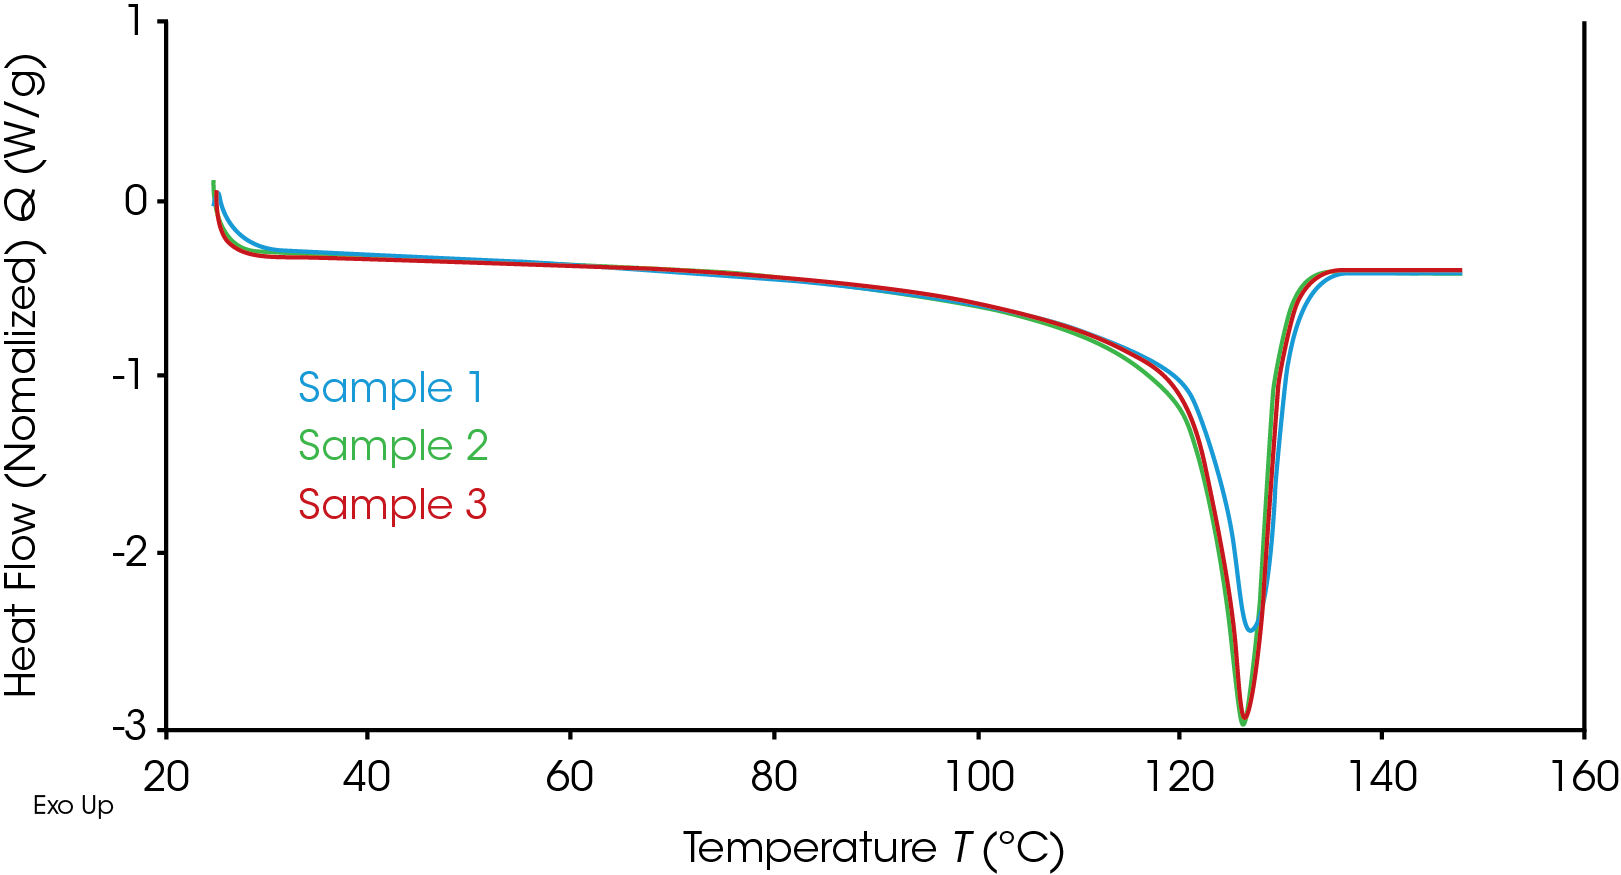
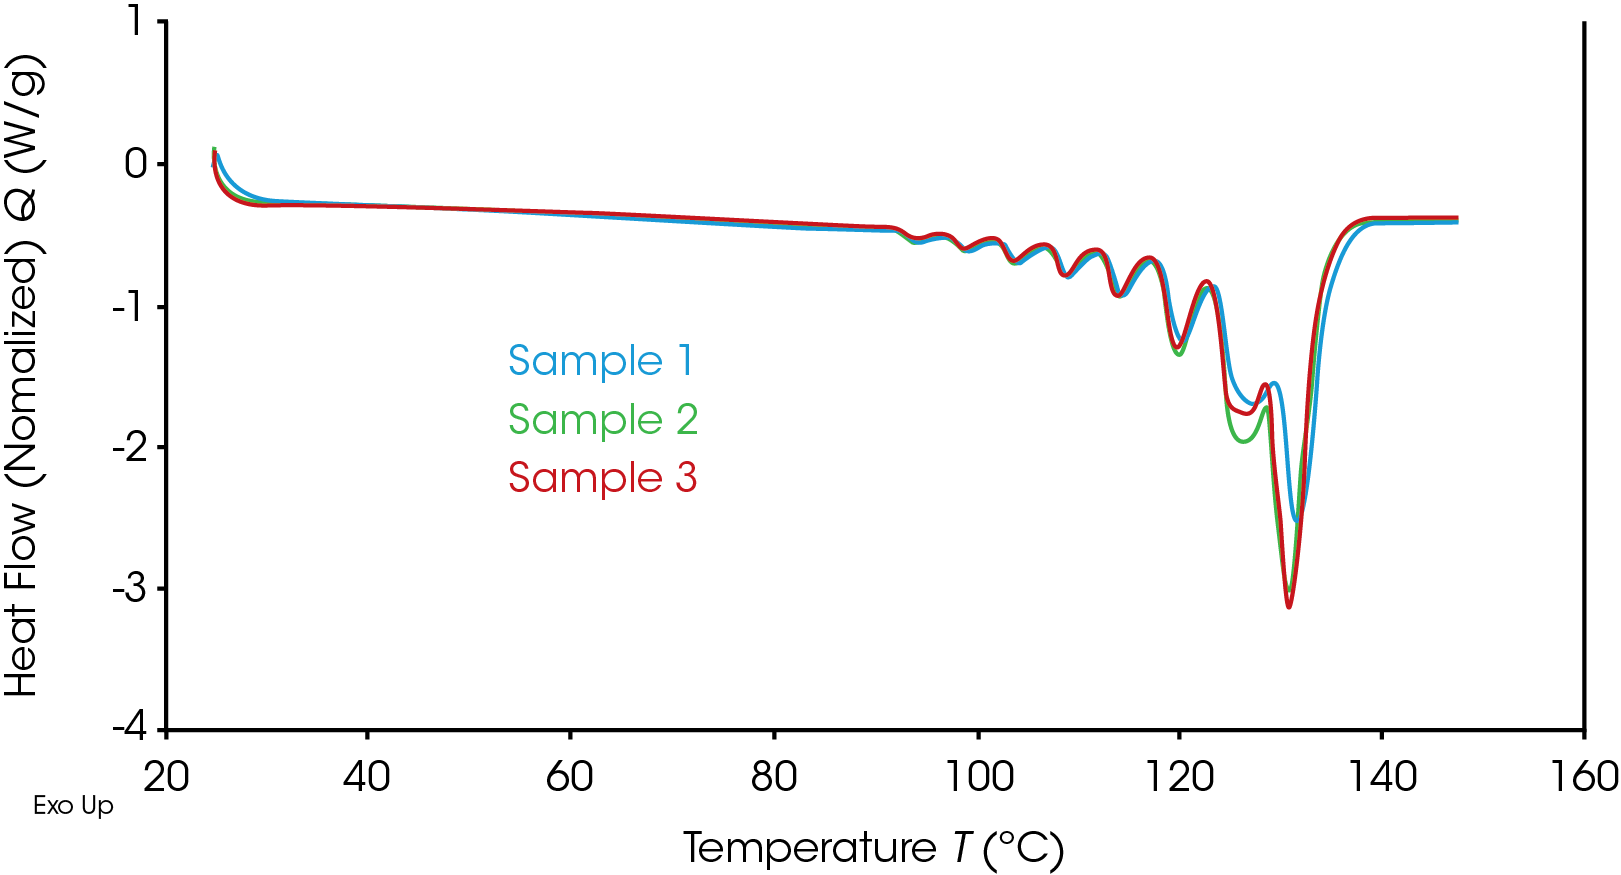
Three polyethylene resin samples designed for injection and rotational molding were characterized using both the SIST and SSA methodologies. Initial heat – cool – reheat data at 10 °C/min was obtained for the samples to define the temperature profiles to be used for the thermal fractionation methods. An overlay of the reheat data for the three samples is shown in Figure 3.
It is worth pointing out that, whilst the melt region is broadly the same and the melting temperatures (defined as the peak temperature) are similar, there are some visual differences in the material responses through the melting. It would be reasonable that, for a basic characterization of the materials, this data in combination with the crystallization on the cooling curve data, may be sufficient analysis. This conventional DSC data was also run in the Discovery X3 DSC, so, whilst a faster test generally we still have the added advantage of faster throughput for the full characterization.
The temperatures selected for the segregation techniques were based on these melt responses. In both tests the samples were heated to 150 °C at 10 °C/min then held isothermal for 5 minutes to remove any crystalline order. They were then cooled at 10 °C/min to 25 °C to impart a controlled thermal history. Based on the observed melt range, thermal fractionation temperatures of 126°C (just below the peak temperature of the melt endotherm), 121 °C, 116 °C, 111 °C, 106 °C, 101 °C, 96 °C and 91 °C were used in both methodologies. The samples were then cooled to 25 °C at 10 °C/min and heated back to 150 °C at 10 °C/min.
Results and Discussion
In all the results data we will just consider the final re-heat to characterize the crystalline structure formed. Figure 4 shows the resultant melt profiles of the three samples after following the SIST segregation profile.
Clear differences can be observed which could be related to the heterogeneity of the crystallizable chain segments. Based on the standard DSC data in Figure 3, the difference in Sample 1 is expected. However, differences are also observed between Samples 2 and 3 in the melt peaks generated by the annealing at 121 °C, and 126 °C. These differences may be indicative of the differences in the crystallizable chain segments. It is important also to note that whilst the full test took around 9.5 hours in total this allows a comparison of 3 samples directly. Had these three been run sequentially, 29 hours of testing would be required.
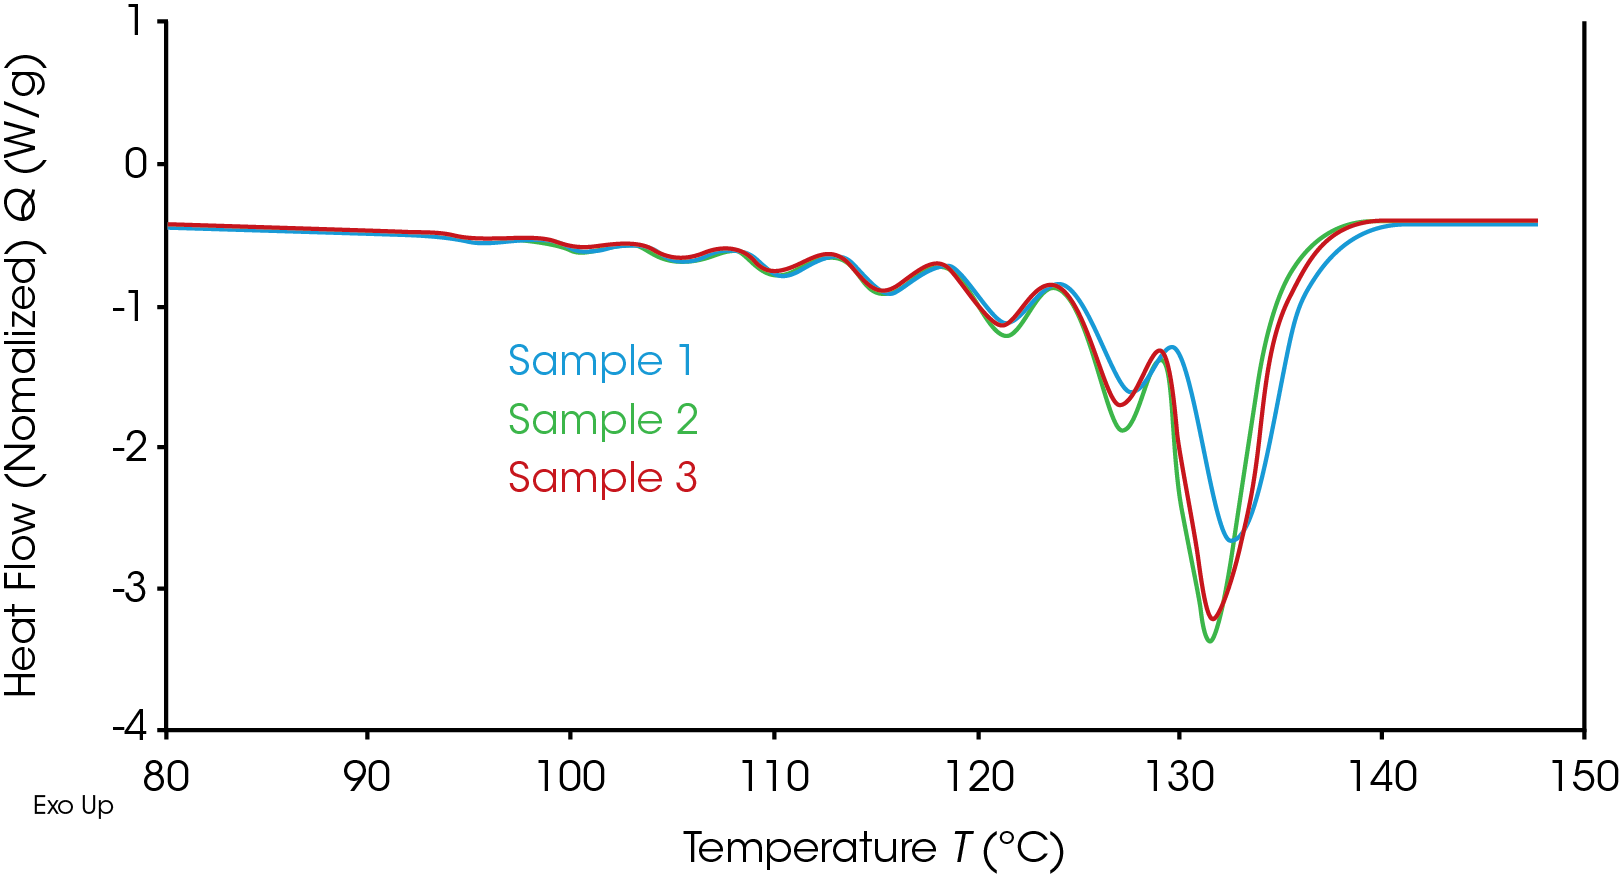
Figure 5 shows the same data overlay but for the samples characterized using the SSA methodology.
Here there is a clearer fractionation of the crystallizable polymer chains in all three samples suggesting that this approach may be more useful in picking out more subtle differences, however, it is important to note that neither approach was fully optimized. With regards to the relative melting endotherms a similar response can be observed here as was seen in the SIST analysis with Sample 1 showing the expected greater difference compared with Samples 2 and 3. The differences between Samples 2 and 3 are also seen and are clearer here than with the SIST methodology.
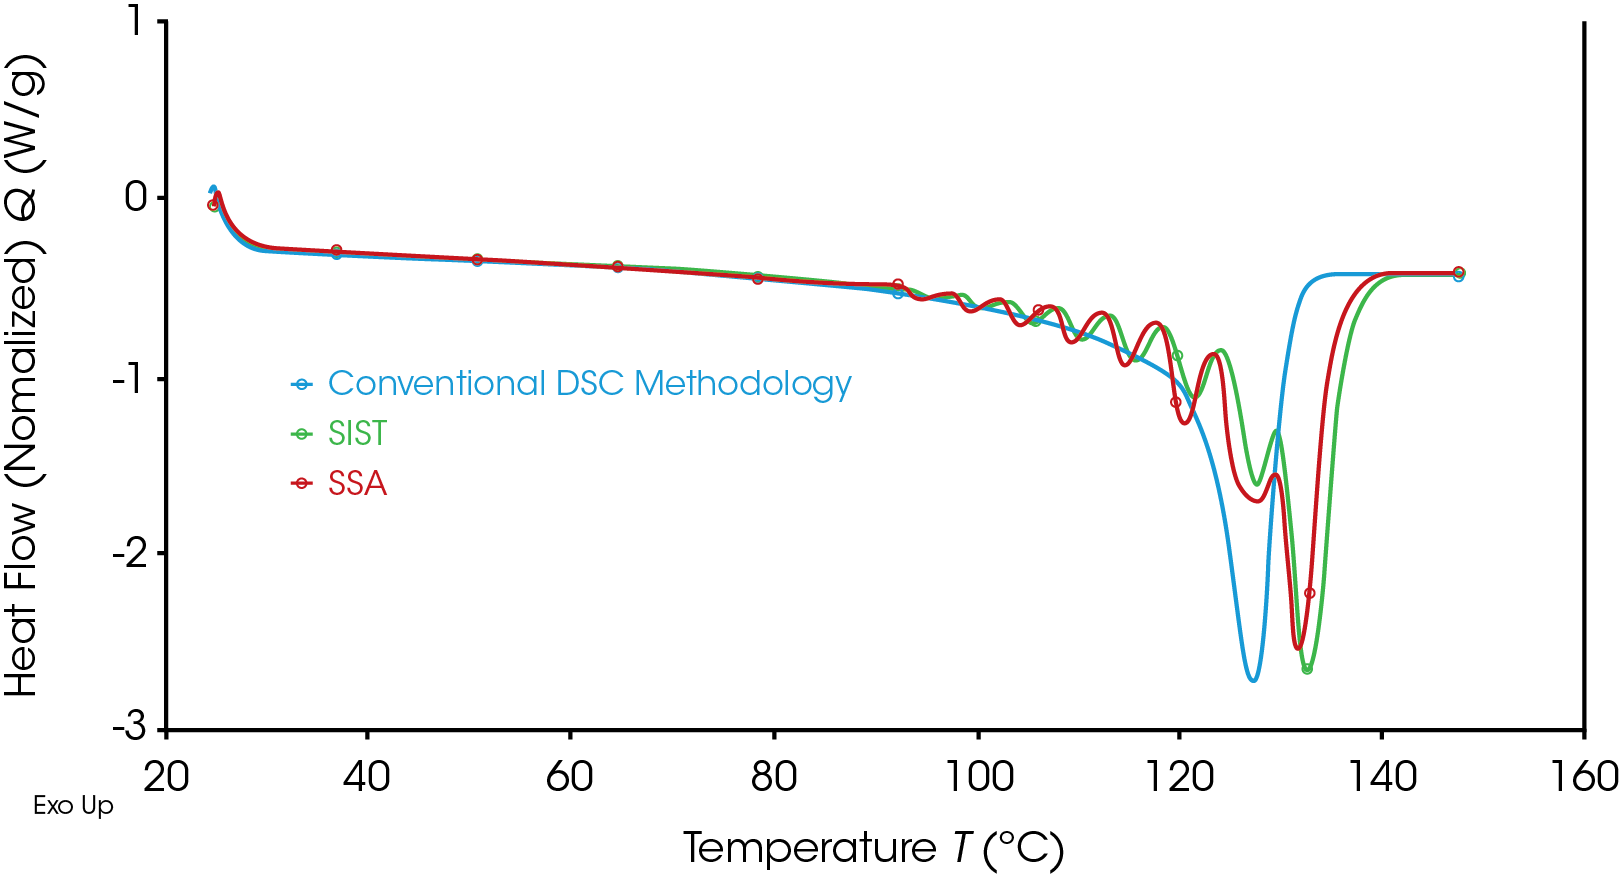
Obviously, the immediate advantage of the Discovery X3 DSC data as presented is that, for each methodology, the three data sets were generated simultaneously. It is worth noting that the control and analysis software (TRIOS) allows easy creation of overlays using a simple a drag and drop approach so quickly allowing comparison of the different thermal fractionation techniques and allowing comparison with the standard DSC data or other data files. Figure 6 shows the comparison of the two thermal fractional methodologies and the conventional DSC methodology for Sample 1.
It is clear to see that the fractionation techniques have allowed a degree of crystalline annealing and perfection to take place which has resulted in an increased melting range for the materials. Overall, the SSA methodology has improved the resolution of the data throughout the melting, although as mentioned, neither methodology was optimized.
Conclusions
The presented data has shown the usefulness of the thermal fractionation techniques in characterizing the homogeneity of the crystallizable chain segments in polymeric materials which would be indicative of potential differences in the material performance. This study selected three polyethylene samples with observable differences by standard DSC, however, there is additional utility in checking batches of theoretically similar materials to ensure that there are no thermal fractionation responses which might give cause for concern in processing and end properties.
References
- B. Fillon, J. C. Wittmann, B. Lotz and A. Thierry, Journal of Polymer Science: Part B: Polymer Physics, 1993, 31, p.1383.
- L. Judovits and S. M. Dounce, Proceedings of the 57th Annual Technical Conference, Society of Plastics Engineers, 1999, p. 2334.
- M. L. Arnal, V. Balsamo, G. Ronca, A. Sanchez, A. J. Müller, E. Canizales and C. Urbina de Navarro, Journal of Thermal Analysis and Calorimetry, 2000, 59, p. 451.
- S. Heyez, C. Doneux, J. C. Wullaert, P. Drouillon, N. Breton and G. Vanmarcke, “Step Annealing Applied to PVDF Homopolymers”, 12th International Congress on Thermal Analysis and Calorimetry, 2000, Copenhagen (Denmark).
- S. Heyez, C. Doneux, J. C. Wullaert, A. Ghanem and G. Vanmarcke, European Physical Society, Conference on Morphology and Properties of Crystalline Polymers, 2001, Eger (Hungary).
- Alejandro J. Müller, Marıa Luisa Arnal, Progress in Polymer Science. 30 (2005) 559–603.
- Els Verdonck, Serge Heyez, TA300, DSC Step Annealing for Fingerprinting Molecular Structure in Poly(vinylidene fluoride).
Acknowledgement
This note was written by Philip Davies, Ph.D., Senior Applications Scientist at TA Instruments
Click here to download the printable version of this application note.

