Keywords: Rotational Rheometer, Grease Testing, MDSC, Crystallinity, Heat Capacity
RH072
Abstract
Three test greases from different vendors were used in an ASTM “round robin” test to evaluate a method for measuring grease mobility in a defined capillary under pressure. This test is similar in nature to the creep test employed by controlled stress rheometers, but the geometry of the sample in this case is cylindrical, and the stresses involved are higher. The same greases were evaluated by the author using a controlled stress rotational rheometer and parallel plate geometry. The apparent yield point as a function of applied stress was evaluated at various temperatures as suggested by ASTM. The rheometer was used to examine the cross over point of G’ & G” as suggested by Hamnelid in a dynamic stress sweep as well as the creep compliance behavior. Modulated differential scanning calorimetry [MDSCTM] was used to examine the samples for temperature transitions of interest which might predict changes in the structure of the samples.
Introduction
Three greases were sent out to various participants as part of a “round robin” test scheme in 1997. The apparatus under scrutiny was a grease mobility apparatus as specified in ASTM D 1092, which utilizes a capillary test chamber that may be controlled at various temperatures. Of interest is the pumpability of the test greases especially at sub-ambient conditions. The device can apply a known pressure which equates to a known applied stress. The amount of grease dispensed under these conditions in a given time is measured as a weight. Controlled stress rheometry has shown itself to be useful in quantifying grease flow and yield properties at various temperatures [1,2,3] and it was decided to make such measurements on the test greases to augment the round robin data.
Methods and Materials
The three greases were designated as A, B & C and were described as follows:
Grease A — Li Synthetic grease [Texaco] — color blue
Grease B — Clay based grease [Texaco] — color brown
Grease C — Unspecified type of grease [Mobil] — color black
Grease C was said to have poor low temperature properties compared with the other two, and the test protocol called for mobility measurements at temperatures of 15 °C, 0 °C, -18 °C & -30 °C.
The rheometry testing was carried out using a TA Instruments AR 1000 N rotational controlled stress rheometer with Peltier temperature control. In addition a TA Instruments 2920 DSC with autosampler was also used to evaluate the samples using a technique known as modulated DSC or MDSC. The chief advantage of this technique for this application is that heat capacity of the sample is evaluated in a single run in real time. This parameter can be used as an index of structure, and so this structure parameter can be monitored in real time. Changes in crystallinity might be expected to cause the heat capacity to change for example.
The rheometer used has been described elsewhere [1] [2] and utilizes an induction motor to generate a known torque on its driveshaft. The geometry attached to this shaft generates a stress proportional to its surface area. Typically a cone is used in conjunction with the base plate where temperature is controlled giving a cone and plate arrangement. The gap between the two elements is fixed and set to an accuracy of 1 micrometer. For this study a parallel plate arrangement was the main geometry with a gap of 1000-1500 micrometers, although some work was done with a cone and plate. In each case the geometry was a stainless steel fixture.
The response of the sample to the applied torque is measured by changes in the rotational position of the shaft through the output of an optical encoder. This detection system has a fixed resolution of 0.62 microradians allowing for shear rate measurements as low as 1 E – 6 s-1 [reciprocal seconds]. The instrument has three operating modes: flow [viscosity measurement], creep [viscosity and viscoelasticity measurement] and oscillation [viscoelasticity]. In the first mode stress is stepped or ramped and the strain rate [shear rate is recorded], creep is a simpler experiment, consisting of a step stress during which time strain or compliance data is collected [retardation] followed by a recovery period of zero stress [relaxation]. Typically the shape of a creep curve is modeled to derive viscoelastic information [Figure 1], while the steady state gradient of the compliance versus time plot is measured to give the Newtonian viscosity at that stress [Figure 2]. As the response becomes more elastic, the gradient becomes increasingly difficult to enumerate since the line tends to the horizontal.
By performing several creep tests a series of viscosity data points can be generated at low shear to probe the yield stress region where reversible deformation of a material gives way to irreversible flow.
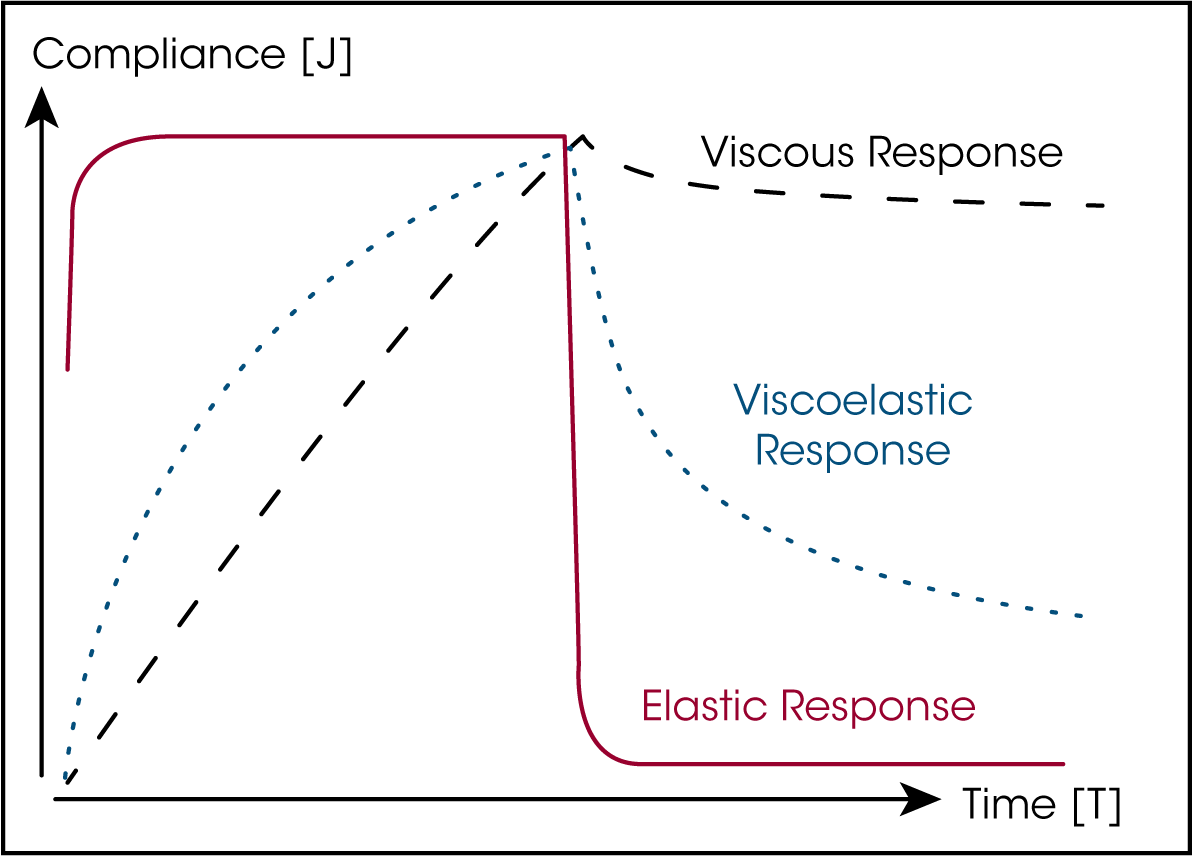
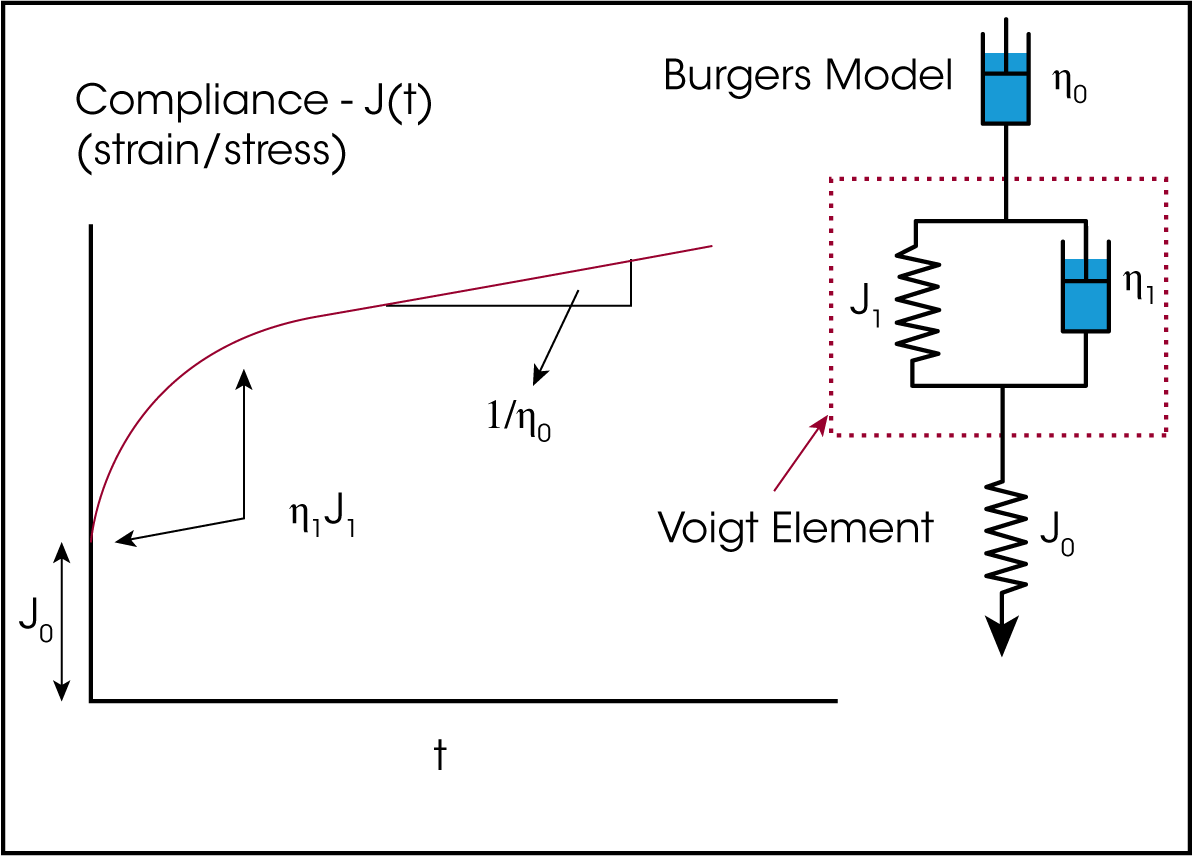
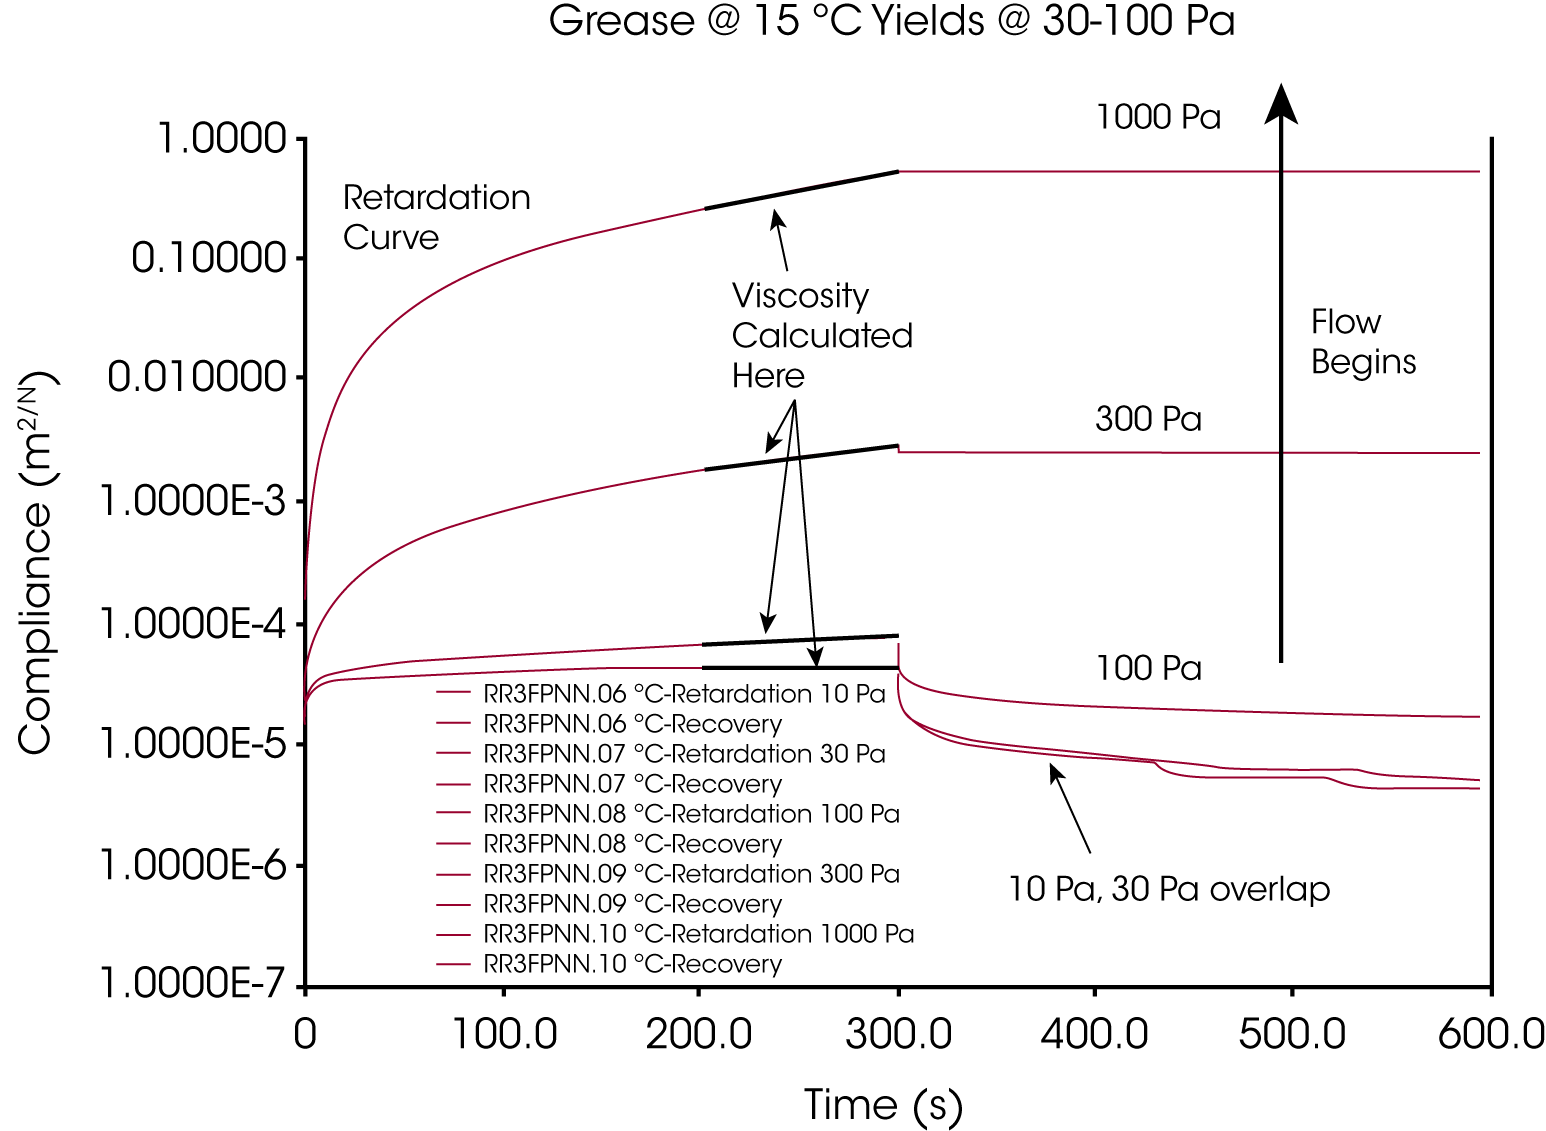
Using creep curves the linear viscoelastic region of a material’s response can be easily demonstrated, simply by plotting the compliance responses at several different stresses on the same scale. The curves will overlap one another within the linear region since stress is proportional to strain here. As the response becomes non-linear the region where an apparent yield stress will manifest is entered [2].
Finally, oscillation or dynamic tests use a sinusoidal input signal [stress] to deform a sample reversibly while the output signal [strain] and the raw phase angle between the two is used to calculate viscoelastic parameters such as G’ [storage modulus] and G” [loss modulus]. A dynamic equivalent to shear viscosity is complex viscosity [ɳ*], although the two only agree in a quantitative sense for unfilled polymers [Cox-Merz Rule]. Dynamic tests are particularly useful for monitoring viscoelastic structure in a sample as a function of time and/or temperature without disturbing the structure itself. This type of test was used to relate the viscoelastic structure of the greases as they were cooled over the temperature ranges of interest [25 °C to — 18 °C]. The use of stress amplitude sweeps allowed for the comparison of non-linear viscoelasticity onset in the samples to be compared with “yield stress” behavior from the creep tests.
Hamnelid [3] suggested that a dynamic frequency sweep test be used where the applied stress at each frequency is related to that frequency by a constant relationship or proportion. Where the storage modulus [G’] and loss modulus [G”] cross is a convenient reference point in ranking a grease for its viscoelastic properties. This test has the advantage of being easy to reproduce and therefore to automate, while lacking the traditional cone penetrometer’s insensitivity to grease thixotropy. The test as a stand alone while useful and certainly worth promoting, can potentially cause measurements to be made at stresses outside the linear region. If this occurs, the values for calculated viscoelastic parameters such as G’ are then incorrect, since most if not all rheometer software calculations assume linear behavior. It is also known that the linear viscoelastic region of a material can vary as a function of frequency, with the breadth of the stress region narrowing as frequency declines and the breadth of the strain region broadening. The test makes an attempt to avoid this problem by changing the stress as a function of the applied frequency, but it is thus changing two variables at once. To ensure rigor, it seems appropriate to first measure the linear viscoelastic response at the frequencies of interest by using stress sweeps at those frequencies. This of course enlarges the task of measurement, but preserves a quantitative approach. In this work therefore stress sweeps at a single frequency were used.
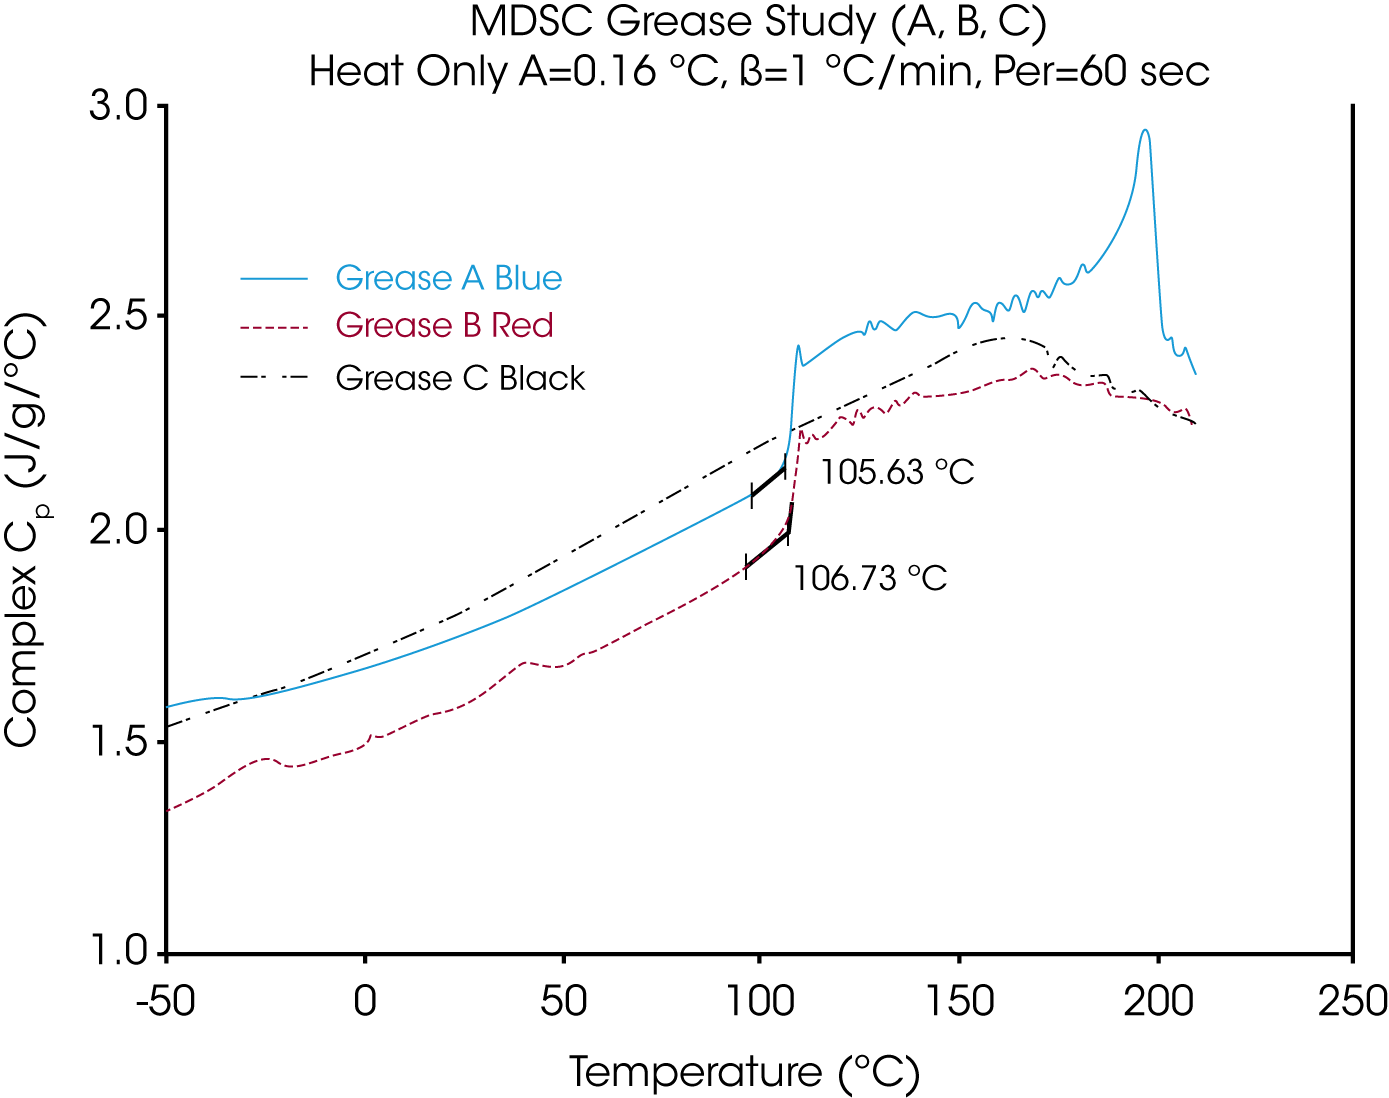
The rheometry testing was performed at all but the lowest temperature [-30 °C], while the MDSCTM testing was performed over a temperature range of -50 °C to 200 °C using heat only conditions [such that the heating rate never goes negative]. This technique prevents so-called “cold crystallization” from occurring in polymers and so was chosen to avoid any changes in structure other than those generated by the initial cooling step. The modulation conditions of the heating ramp were as follows: Amplitude 0.16 °C, underlying heating rate 1 °C /min and Period of 60 seconds. For a more complete description of modulated differential scanning calorimetry consult refs [4].
Results
The creep curve data obtained at a variety of stresses were used to calculate steady state viscosities by fitting a straight line to the last 1/3 of the data obtained in the retardation [stress is applied] curve. These values were themselves then plotted as graphs of viscosity versus stress for the temperatures covered. As temperatures declined the low stress responses tended to become noisy and also less easy to fit straight lines whose slope was meaningful. Where this occurred, data points were discarded. This highlights a potential weakness of the technique in deriving quantitative viscosity data per se, but the detection of the point of yield is still valid. Moreover the resolution of this yield point, is only limited by the number of different stresses covered. In this case, stresses of 10, 30, 100, 300 & 1000 Pa were attempted as a general rule, since the half-decade point in a logarithmic plot occurs at 3, 30, 300 etc. Figure 3 shows some typical data with the measurement reference frame for calculating viscosity at steady state. It is also worth stating that the conditions for steady state can be difficult to apply if the creep test is too short. Even visual evaluation may be misleading leading to inaccurate values for the viscosity [underestimates]. This problem can become acute at the lower temperatures, since the increased structure of the greases require longer response times.
Figure 4 through 7 show the graphs for viscosity versus stress at the 4 temperatures for all three greases. Although all the plots show a decline in viscosity with increasing stress, it is apparent that a plateau value of viscosity at low stress [zero shear viscosity] is not achieved in all cases. This is due to the problems of calculating the slope of a straight line as it approaches the horizontal.

From figure 4 it is clear that the greases can be ranked in order of viscosity, such that A > B > C and further that A yields between 300 & 1000 Pa, while C yields at between 100 & 300 Pa, while B is not yielding at 1000 Pa. It should be noted that this temperature [25 oC] was not specified in the “round Robin” protocol, but was included for an ambient reference point.
At 15 °C figure 5 clearly demonstrates some changes in the ranking of the greases, so that A & B are closely related with C having a similar starting viscosity, but yielding much earlier [between 10 & 30 Pa]. A & B seem to start yielding more gradually than C at ~ 100 Pa. Figure 6 shows the data for 0 oC.


The 0 °C data show a consistent yield stress of ~ 100 Pa but the order of the samples is now changed such that sample B is the most viscous followed by C & A at about the same level. Finally at the lowest temperature of -18 °C the data in figure 7 is seen.
At the lowest temperature both B & C seem relatively stable with B not appearing to yield at all, sample C yielding above 300 Pa and sample A yielding at the lowest stress of all -10 Pa. From the data sample A undergoes the biggest change as a function of temperature, losing structure as it cools in terms of yield stress and seeming to fluctuate somewhat in actual viscosity. Samples B & C show the expected steady rise in viscosity as temperature drops, with sample B appearing to gain more in viscosity than sample C.
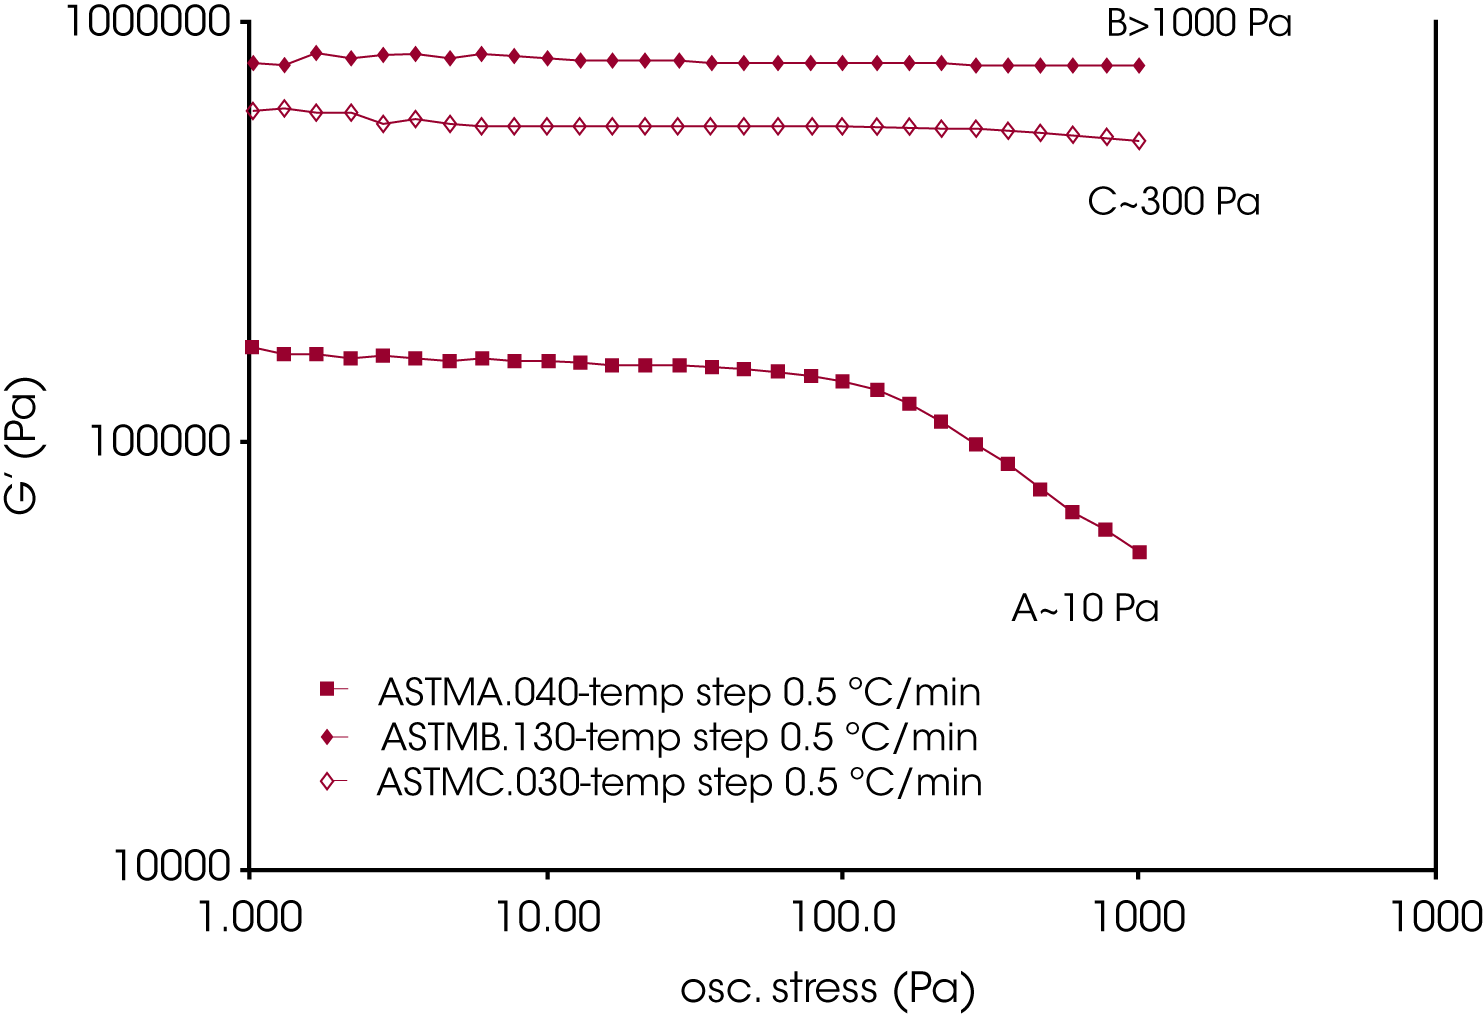
The extremely high values of viscosity encountered in these tests [1 E 8 Pa.s] mean that there are likely to be large potential errors in the measurement of the gradient of the compliance graphs since Gradient = 1/ɳ. If the gradients are as low as 1 E-8 Pa.s then this technique has an unacceptably large potential for error. To check the validity of this idea, dynamic data from two types of test were also investigated. Firstly a temperature sweep at a constant frequency and amplitude was performed on each of the samples, cooling them from 25 °C to -20 °C at 0.5 °C/min. The results of these tests are shown in figure 8. Secondly, stress amplitude sweeps at each temperature were performed to analyze the stress where the samples left the liner viscoelastic region. Typical data at -18 °C is shown in figure 9 where there was least confidence in the creep test data, for the reasons already discussed.
Finally the MDSCTM data of Cp [heat capacity at constant pressure] was also examined to see if thermodynamic structure was relevant as a predictor of viscoelastic structure. This data is presented in figure 10. It should be noted however, that in the MDSC tests, the samples were cooled first and then heated at a constant, underlying heating rate of 1 °C /min, [notwithstanding the modulation].


If the data from the above figure is examined at the four temperatures in question it is easy to rank the samples by complex viscosity [ɳ*] although numerically it does not agree with the calculated shear viscosity values from the creep tests [ɳ]. Thus at 25 °C the samples rank as A > C >/=B, at 15 °C they are A > C > B, at 0 C B > C > A and at -18 °C B > C > A. If these rankings are compared with the creep data, then there is poor agreement at the two higher temperatures, but good agreement at the two lower temperatures. It is apparent that at the higher temperatures the differences between B & C are relatively small in the data from both tests, while as temperature decreases the separation between them is enhanced and so the lack of agreement may not be significant.
The descriptions of the greases as supplied were that grease C was a poor performer at low temperature, however grease B appears to build structure at the greatest level which could lead to poor performance if structure is undesirable [poor lubrication, good coating or protection]. Grease A is clearly the most stable of the three, changing very little in viscosity value, but showing a profound drop in yield stress. This means it is likely to be mobile at all temperatures, and so is likely to be the best performer.
Figure 9 shows the stress sweep data at -18 °C for the three samples, and the values where the G’ data diverges from the horizontal is in excellent agreement with the yield stress values from the creep data [see figure 7].
The final figure shows plots of Cp as a function of temperature, and appears to rank the samples in complete disagreement with the rheology data. Consistently sample B shows the lowest Cp and therefore appears to have the lowest structure in terms of its ability to store thermal energy. This is in conflict with the ranking in figure 9 of G’ which is the ability of a sample to store mechanical energy. Clearly this result is hard to interpret in the absence of other thermal data, but it is probably unwise to dismiss the rheological data without further thermal study.
Conclusions
Rheological and thermal methods were applied to three candidate greases in an effort to compare them at various temperatures. The data produced is somewhat contradictory, but appears to be consistent in terms of creep data agreeing with dynamic results. Sample B is seen to have the least desirable low temperature properties, followed by sample C. Sample A which is relatively insensitive to temperature as far as viscosity is concerned, has a yield stress which diminishes significantly, while the other samples show this property to a much lesser extent. The very nature of the viscosity measurement from the creep data seems fraught with practical problems as temperature drops [noise in the compliance signal and a very small gradient to measure]. It would appear then that dynamic testing, either by using a stress sweep at a given temperature or by sweeping the temperature itself show the best results. The values derived however are less easy to compare with the grease mobility studies that originally prompted this study, since a mass flow rate is used under a constant stress [pressure].
References
- Whittingstall, P. Controlled stress Rheometry as a tool to measure Grease Structure and Yield at various Temperatures. 63rd NLGI Meeting Phoenix AZ
- Whittingstall, P & Shah R. Yield Stress Studies on Greases 64th NLGI Meeting Carlsbad CA
- Hamnelid, L. et al Consistency resides in the Yield stress 64th NLGI Meeting Carlsbad CA
- Modulated Differential Scanning Calorimetry
Acknowledgement
Click here to download the printable version of this application note.

