Keywords: rubber, RPA, molecular weight, molecular weight distribution, mastication, processing
RT008
Abstract
The process of mastication for naturally occurring rubbers, such as natural rubber (NR), is an industrial norm. Naturally occurring products will vary in physical and structural properties lot to lot and batch to batch. Often mastication is used to intentionally change the structural properties to maintain consistency between different batches of rubber. These structural changes are quantified through Mooney viscosity, however this test method possesses inherent drawbacks, such as providing limited information. The technical capabilities of dynamic mechanical analysis with a Rubber Process Analyzer (RPA) can be used to fully characterize the structural properties of the raw polymer as a function of mastication time, which further impacts compound processability and final product performance.
Introduction
The manufacturing process and mixing history of rubber compounds have been shown to impact properties such as processability, viscoelastic characteristics, curing properties, and physical properties of the fully cured product (1-3). Many of these differences are likely due to changes in the polymer microstructure brought about by processing operations. The traditional rubber testing method for quantifying polymeric changes is a Mooney viscometer. This test method has been used for several decades to monitor the quality of mixed batches and the effects of mastication on the viscosity of natural rubber. However, as elastomeric product performance becomes more demanding and highly engineered materials are required to meet these demands, testing methodologies with greater sensitivity are essential. In this context, quantifying subtle differences in the processability of rubber compounds is imperative to consistently obtain high-quality products with lower rate-of-reject. The testing routines can be pushed further upstream in the testing workflow in characterizing the raw material prior to its processing. Such testing can provide insight on polymer morphology and its effect on compound processability and product performance in an ad-hoc fashion, thereby making the overall process more efficient.
The most influential physical properties that can impact processability and end-use performance of rubbers and elastomers include molecular weight, molecular weight distribution, and the degree of long-chain branching (1, 4-6). Rheological characterization utilizing a Rubber Process Analyzer (RPA) provides a quick and easy method to obtain these properties thereby delivering a means to understand and develop polymer structure and bulk property relationships. The RPA is unique in this aspect as it provides a direct measure of the viscoelastic properties of the material with a high degree of sensitivity and accuracy.
In this application note, we will demonstrate the capabilities of the RPA for characterizing the rheological properties of natural rubber and correlating them to changes in the polymer microstructure brought about by mixing protocols. This valuable information can further be used to predict processing behavior, allowing operators to plan in advance, thereby increasing productivity and reducing scrap.
Experimental
A single batch of natural rubber was obtained and masticated for varying durations of time between 0 minutes and 10 minutes. All batches of rubber had a Mooney viscosity in the range of 64 to 59 MU. A TA Instruments RPA elite was used to perform a frequency sweep to measure the viscoelastic response as a function of time or frequency, to better characterize each sample. The viscoelastic properties of a single batch of natural rubber and rubber compounds were obtained in the RPA using standard oscillation testing, such as frequency sweeps and strain sweeps. Frequency sweeps were performed from 0.628 rad/s to 314 rad/s or 0.1 Hz to 50 Hz using a strain amplitude of 7% (0.5° arc) within the linear viscoelastic regime of the testing specimen. Approximately 5.5 grams of material (± 5%) was utilized and compressed in the testing cavity using a clamping pressure of 4.5 bar. Samples were allowed to relax for 10-15 minutes in the testing cavity before viscoelastic measurements were performed in order to allow ample time for any internal stresses experienced during the loading process to dissipate.
Results and Discussion
Viscoelasticity
Rubbers are essentially polymers which offer a unique set of mechanical properties. The rheological behavior of any polymer is very sensitive to small changes in the polymer structure. For example, a small amount of a high molecular weight polymer can drastically alter the behavior of the polymer and consequently the processability of the material. Because of this unique sensitivity to microstructure, rheology is a powerful method to characterize polymers. The material properties that influence the rheology of any polymer are its molecular weight (MW), molecular weight distribution (MWD) and degree of branching (5, 6).
The RPA elite (TA Instruments, New Castle, DE) is an advanced, rotorless rotational shear rheometer dedicated to the complete viscoelastic characterization of polymers, rubber, and rubber compounds at all stages of manufacturing. The RPA elite provides invaluable data related to the viscoelastic behavior of materials in the pre-cure state, through the curing process, and in situ cured state. Samples are sealed in a biconical die and compressed under high pressure forces, as is standard in the rubber industry.
This design provides a closed testing cavity which prevents melt fracture at the sample edge, and compressive forces to prevent sample slippage during testing.
When samples are mechanically perturbed in an oscillatory fashion in an RPA, the following information can be obtained:
Storage (or elastic) modulus G’ and loss (or viscous) modulus G”
The storage modulus represents the amount of energy stored in the elastic structure of the sample, commonly denoted as G’. The loss modulus represents the viscous part or the amount of energy dissipated in the sample, commonly denoted as G”.
If G’ > G”, then the material can be regarded as mainly elastic. On the other hand, if G” > G’, then the material is predominantly viscous (it will dissipate more energy than it can store, like a flowing liquid). Since rubbers exhibit both G’ and G”, they are often termed as viscoelastic, and the measurements on the RPA are termed as viscoelastic measurements.
Viscosity, η*
The viscosity of any material is the inherent resistance of the material to flow. In the same context, a viscoelastic parameter that is obtained from oscillation experiments is the complex viscosity, η. From a physical significance, the complex viscosity can be related to the viscosity measured in a steady shear test.
Damping or Loss factor
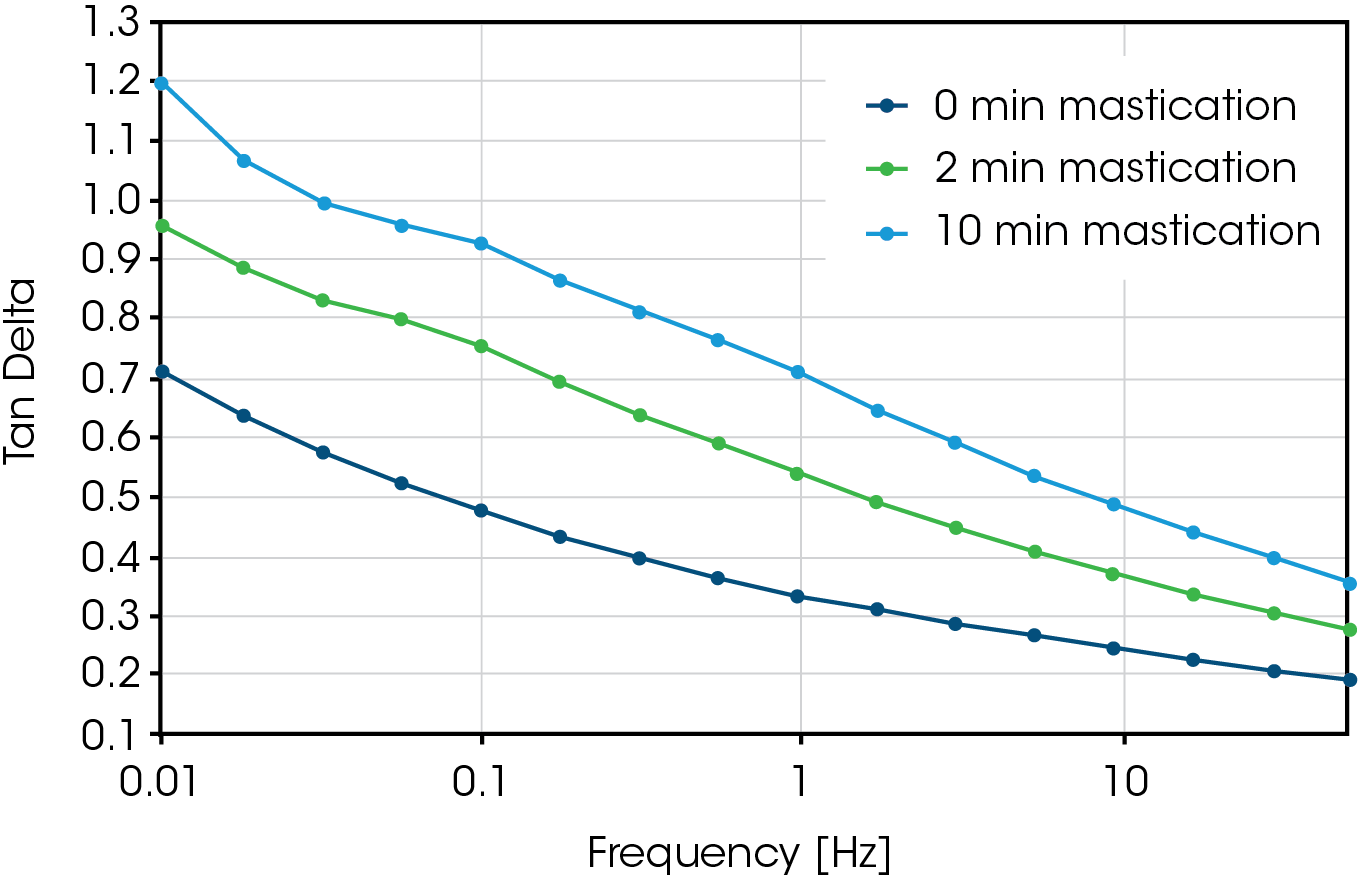
The ratio of the moduli (G”/G’) is defined as the damping factor or loss factor and denoted as tanδ. Tanδ indicates the relative degree of energy dissipation or damping of the material. For example, a material with a tanδ > 1 will exhibit more damping than a material with a tanδ < 1 because G” > G’, which means the energy dissipating, viscous modulus prevails as the defining factor of the material’s characteristics.
Significance of Viscoelastic Measurements
As can be observed, the viscoelastic parameters listed above are inter-related. When these measurements are viewed from the lens of processability or polymer structure, it provides the user with a wealth of information. For example, a lower η (or η*) can improve the overall flowability of a material making it easy to process with increased energy-efficiency. This increased flowability can further increase the surface smoothness of the final product post-processing. It can also offer more consistent finished products due to improved mold flow. At the same time, a lower η* or G’, or a higher tanδ at lower frequencies also indicates less elasticity within the material, which could have effects on die swell, toughness, tensile strength and others.
Cross-over frequency and modulus
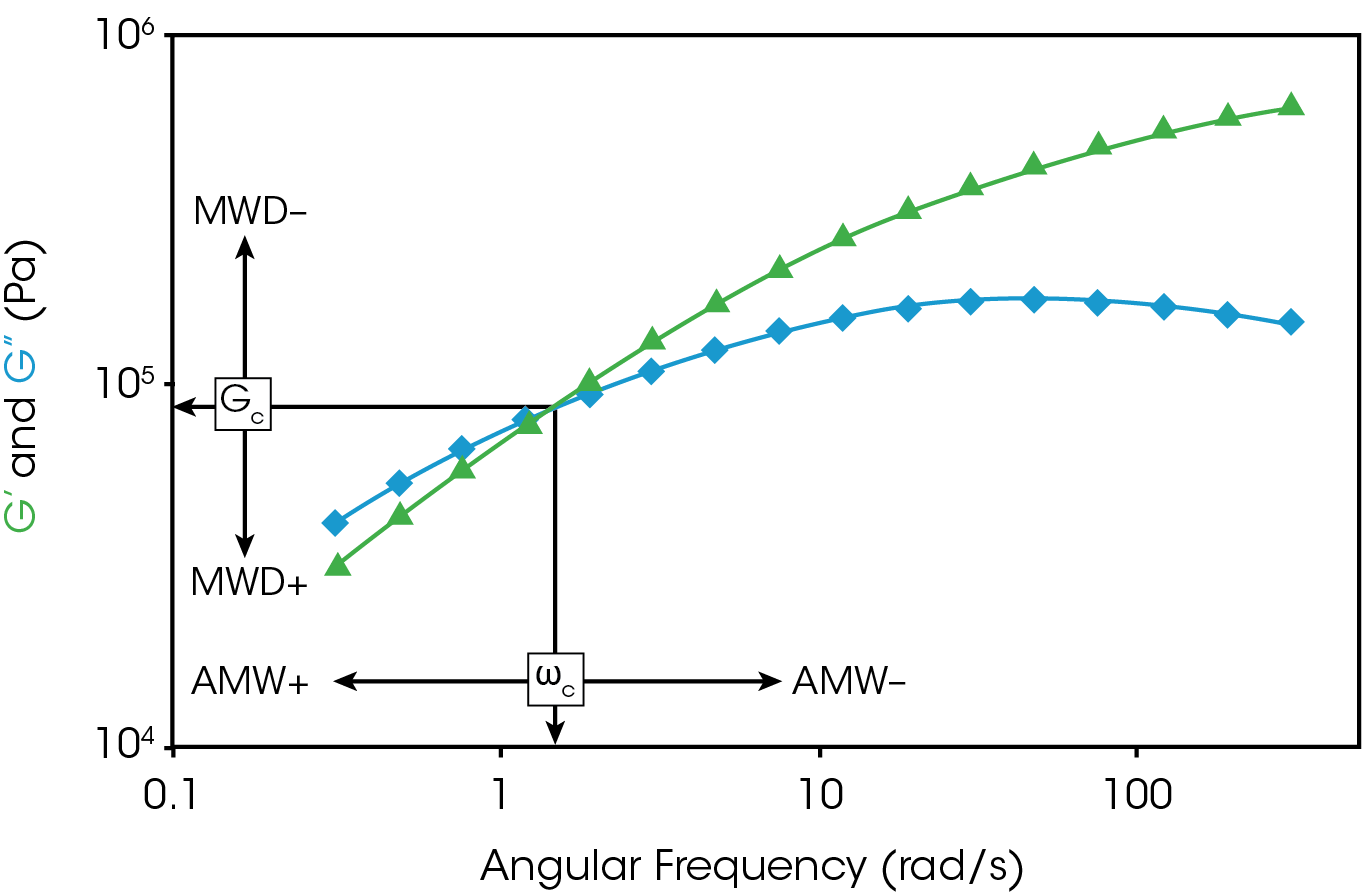
When a viscoelastic material like an uncured rubber compound is subjected to oscillatory mechanical perturbations at different frequencies as described in the experimental section, G’ can be observed to be greater than G” at higher test frequencies and vice-versa at lower frequencies, with a specific crossover frequency and modulus at which G’ = G’’. The cross-over frequency is a measure of the longest relaxation time and often used as a metric for relative comparison of molecular weight with all other parameters remaining consistent (1, 4, 5). Similarly, it has been well-established that the cross-over modulus can be used as a relative measure of the molecular weight distribution. This concept is shown schematically in Figure 1 below (4, 5).
In general, viscoelastic measurements, are very sensitive to subtle changes in the polymer architecture, especially at lower frequencies. The measurements listed above are direct metrics to quantify these differences and enable the user to:
a. define quantitative control limits to ensure product and processing consistency
b. troubleshoot processing issues in a more quantitative fashion
c. incorporate an important tool in the analytical workflow to understand subtle differences between different materials

Viscoelastic Characterization of Natural Rubber Samples with Varying Mastication Times
Figure 2 shows the elastic modulus (G’) and viscous modulus (G”) for three raw natural rubber samples with varying mastication times.
Longer durations of mastication result in lower moduli for all frequencies tested, indicating a decrease in the solid-like component as a result of the mastication. It can also be observed that the crossover modulus occurs at higher frequencies as the mastication time is increased. Note that a crossover occurring at a higher frequency corresponds to a lower average molecular weight compared to samples exhibiting crossovers at lower frequencies. The mastication process is destructive and is used to reduce the viscosity of the naturally occurring natural rubber by breaking down polymer chains using thermo-mechanical treatments. Frequency sweep testing with an RPA demonstrates that all three samples show different viscoelastic characteristics clearly showing the impact of the duration of the mastication process on the average molecular weight. This concept has been applied to study the effect of different thermo-mechanical treatments such as temperature, speed of shear, peptizers, etc. on the properties of the material prior to and post-processing (7).
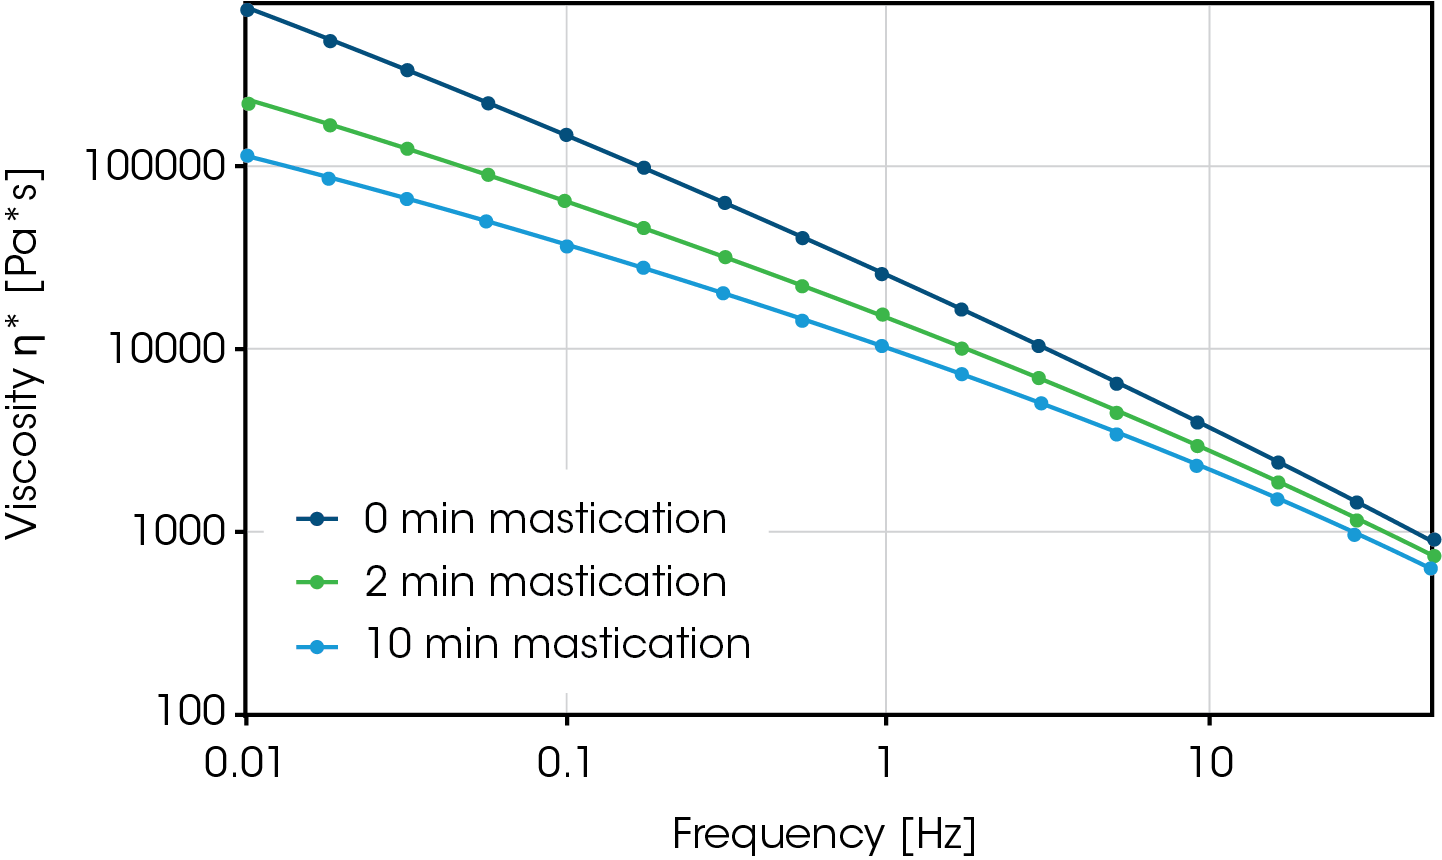
Data from a frequency sweep can also be analyzed by plotting the complex viscosity or tanδ as a function of frequency, shown in Figures 3 and 4. The complex viscosity is a measurement of a material’s ability to flow. A higher complex viscosity indicates the sample will exhibit a greater resistance to flow compared to a sample with a lower complex viscosity. Analyzing the complex viscosity as a function of frequency can be used to understand the overall flow profile of the polymer through a production process. For example, all samples show shear thinning behavior, demonstrated by the complex viscosity decreasing as the frequency increases.


Conclusion
Mastication of natural rubber (NR) is a destructive process that can significantly change the structural architecture of the polymer. Frequency sweep tests on the RPA identified significant differences in the polymer architecture undetected by typical Mooney viscosity testing. Increasing the duration, the mastication resulted in a lower average molecular weight, indicated by a decrease in crossover frequency, a decrease in the complex viscosity and an increase in the tanδ. This concept can be easily applied to study the effect of different thermo-mechanical treatments such as temperature, speed of shear, peptizers, etc. on the rheological properties of the material prior to-, during- and post- processing.
Note: Additional results of this study, including Payne effect and long-chain branching comparisons can be found in the Rubber World publication. This article can be accessed at http://www.rubberworld.com/ , January 2019 issue, pages 34-39.
References
- Barnes, H. A. “An Introduction to Rheology”, Elsevier, 1989.
- Macosko, C. W. “Rheology: Principles, Measurements and Applications” VCH Publishers, New York, 1994.
- Tschoegl, N. W. “The Phenomenological Theory of Linear Viscoelastic Behavior”, Chapter 9, pages 443-483. Springer-Verlag, 1989.
- TA Instruments application note RT002 “Rubber testing with DMA instruments”.
- TA Instruments application note AN009 “Application of rheology to polymers” and references therein
- TA Instruments application note RT006 “Using the Large Amplitude Oscillatory Shear (LAOS) Method to Characterize Polymer Long Chain Branching”.
- Dimier F., Vergnes, B., Vincent, M. “Relationships between mastication conditions and rheological behavior of a natural rubber” Rheol Acta (2004) 43: 196–202
Acknowledgement
This application note was a collective effort of the work of Sandeep Reddy, Alina Latshaw (PhD), David Bohnsack (PhD), Thomas Rauschmann, and Yash Adhia.
Click here to download the printable version of this application note.

