Keywords: Fatigue testing, tensile testing, additive manufacturing, 3D printing, Nylon, sustainable polymers, ElectroForce
EF037
Abstract
Through technological advancements, additive manufacturing has surpassed its niche application space of prototyping and is increasingly used to fabricate end-use parts. It is important to understand the mechanical properties of additively manufactured parts, including time dependent behavior such as fatigue life, to ensure performance and reliability. This work evaluates the mechanical properties and time dependent response to loading of laser sintered dog bone samples of two polyamides, bio-based polyamide-11 (PA11) and petroleum-based polyamide-12 (PA12), through monotonic pull-to-failure tensile tests and cyclic fatigue testing. The TA Instruments™ ElectroForce 3300 load frame was utilized for its versatility to execute both monotonic and fatigue testing due to its electromagnetic motor and non-contact precision sensor technologies. The results identify mechanical and fatigue life superiority of PA11 compared to PA12. The approach presented can be utilized to compare materials when it is important to evaluate both ultimate strength and durability under repeated loading.
Introduction
Additive manufacturing (AM) has quickly emerged as an innovative technology that allows production of materials with complex three-dimensional (3D) geometries [1]. It was initially used as a prototyping technique but is being increasingly adopted to produce end-use parts. Laser sintering is a common AM technique that involves using powdered material to print the desired geometry. To understand performance of the final product, as well as investigate any potential variability caused by AM, it is necessary to mechanically characterize a laser sintered sample of the material. Time and load dependent properties, such as fatigue life, are of interest to determine the material reliability for these AM parts. These properties are of particular importance in industries such as aerospace and biomedical, where a thorough understanding of the material lifetime is critical in avoiding catastrophic failures [2].
Two polymers commonly used in the AM process of laser sintering are polyamide-11 (PA11) and polyamide-12 (PA12), which belong to the Nylon family of polymers. PA11 is bio-based, derived from castor oil, whereas PA12 is petroleum-based and contains an extra methylene group between the amide groups in the polymer backbone. While the smaller carbon footprint of PA11 is desirable, the extra methylene group of PA12 results in different mechanical properties of the two materials [3] [4]. PA11 is generally stronger and more ductile compared to PA12, but the latter has better chemical resistance [5]. With this consideration, the performance properties of PA11 and PA12 must be thoroughly understood to weigh the environmental impact against the ultimate material performance.
The mechanical property differences of these two polymers have been explored, but little has been studied on the fatigue life [4] [6]. Often, mechanical and fatigue testing are performed using separate instruments, requiring greater investment and a larger space. In this application note the quasi-static and cyclic response of laser sintered PA11 and PA12 dog bone samples are examined utilizing the ElectroForce 3300 load frame. Potential variability induced by the laser sintering process is also explored.
Experimental
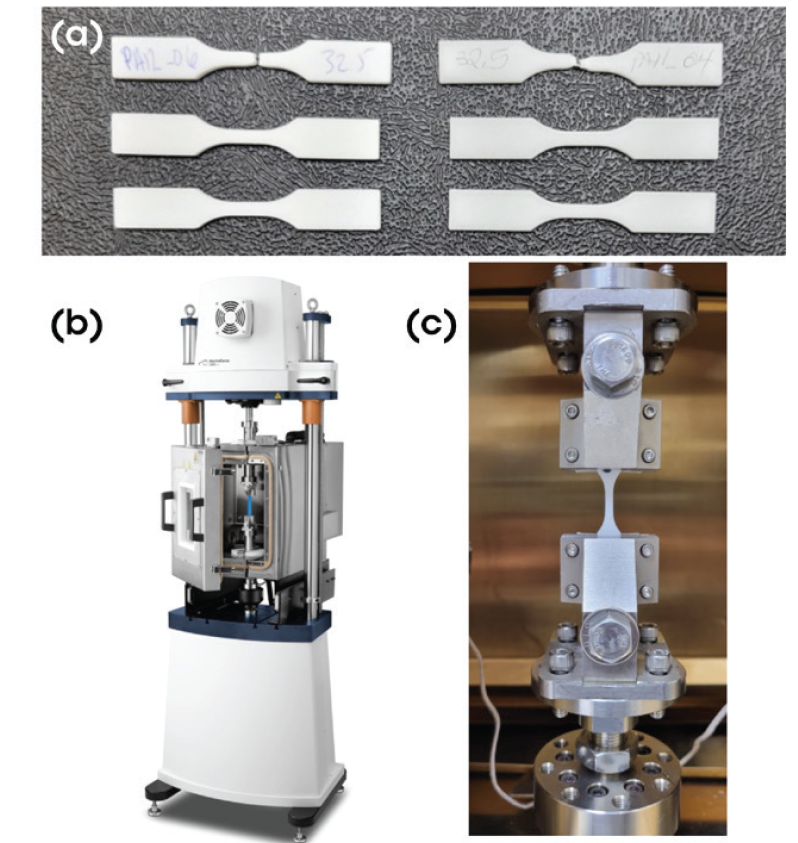
Commercially obtained PA11 and PA12 samples were fabricated into type V dog bone samples [7] using a laser sintering AM process. Figure 1a shows the PA12 (left) and PA11 (right) dog bone samples before and after testing to failure.
Monotonic and fatigue tests were performed on the ElectroForce 3300 from TA Instruments. The 3300 was selected for this work due to its versatility and ability to execute the slow testing needed to measure elongation and tensile strength, as well as fast, cyclic testing to study fatigue. Figure 1b shows the instrument with a tensile testing configuration. Sample geometry and testing conditions followed the requirements of ASTM D638-22 [7]. Monotonic tensile testing was performed at a rate of 1.2 mm/min (strain rate of 0.0018 s-1) until failure for all samples. Three samples were tested for both PA11 and PA12 to examine the mechanical property variability.
Fatigue testing was performed at maximum stress levels of 25, 30, 32.5, 35, and 40 MPa with a 25 Hz frequency. The 40 MPa stress level was approximately 80% of the ultimate strength of the stronger PA11 sample as determined from the pull-to-failure monotonic testing. An R-ratio of 0.1 was used to maintain tension in the sample. The lower maximum stress levels were chosen to systematically study how the material lifetime increases with decreasing stress. Three samples were run for each stress level to examine the variability between the PA11 and PA12 parts. The strain was monitored using an Epsilon ONE optical extensometer, model One250CE/280. A representative dog bone sample within the grips is shown in Figure 1c.

Results and Discussion
Monotonic Testing
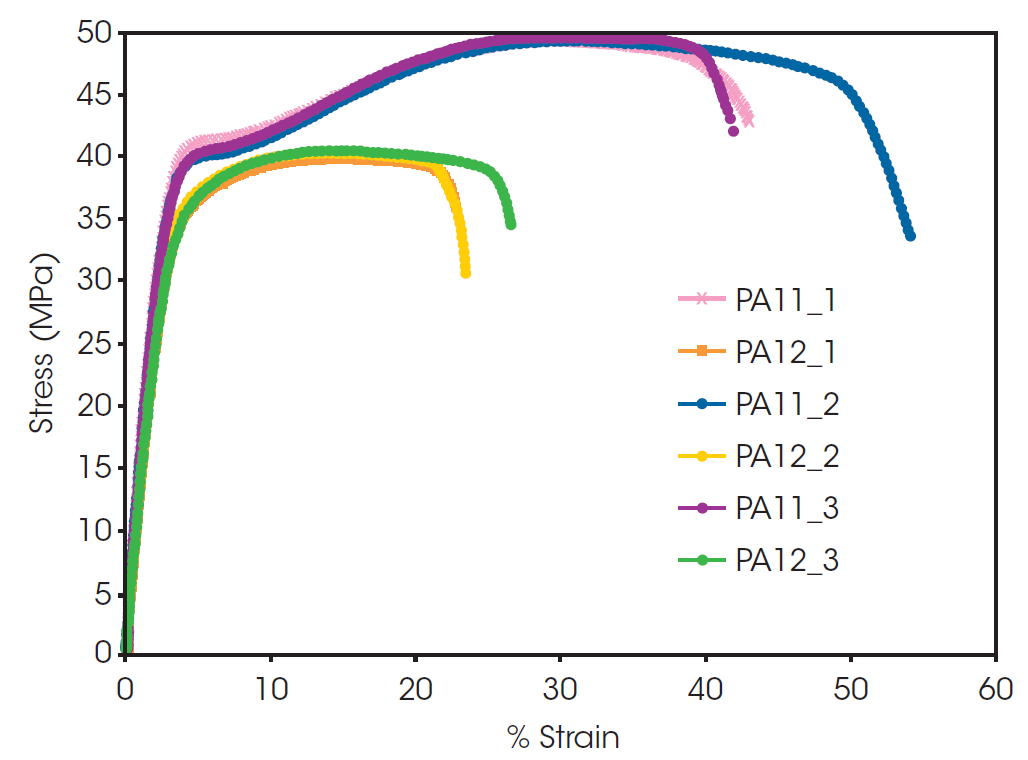
The mechanical properties of PA11 and PA12 were assessed using monotonic tensile tests. Figure 2 shows the resulting stress versus strain curves when the samples were strained at a rate of 0.0018 s-1. The PA11 sample has a greater ultimate tensile strength (UTS) and a longer percent elongation at failure for all samples.
The values for UTS and elongation percent to failure are shown in Tables 1 and 2, along with the average values from the three curves and the standard deviation.
The higher strength and longer elongation for PA11 has been observed before when a powder bed fusion process is used to produce PA11 and PA12 parts [3]. The monotonic testing results show that PA11 has a greater ability to stretch without losing strength compared to PA12. This makes PA11 a better choice for end-use parts and for applications where a stronger and more ductile material is required.
Testing the samples in triplicate provides the opportunity to look at the potential variability in the laser sintering process itself. Laser sintering is a powder bed fusion AM process and has received criticism from a reproducibility standpoint [8]. In laser sintering, variability tends to come from powder bed properties, laser characteristics, and process parameters. Table 1 shows that percent elongation to failure has the most variability, while the UTS remains consistent for both materials. The PA11 and PA12 samples each have one curve in Figure 2 that elongates noticeably further compared to the other two replicates and this imparts a higher standard deviation as seen in Table 1. Inconsistencies from the AM process can manifest as mechanical property variations, which is not desirable for an end-use product.

Table 1. Ultimate tensile strength (UTS) and % elongation at failure for PA11 with the triplicate run average and standard deviation (σ).
| PA11 | UTS (MPa) | Elongation (%) |
|---|---|---|
| 1 | 49.24 | 44.76 |
| 2 | 49.40 | 54.24 |
| 3 | 49.87 | 41.87 |
| Average | 49.50 | 46.96 |
| σ | 0.33 | 6.47 |
Table 2. Ultimate tensile strength (UTS) and % elongation at failure for PA12 with the triplicate run average and standard deviation (σ).
| PA12 | UTS (MPa) | Elongation (%) |
|---|---|---|
| 1 | 39.91 | 23.35 |
| 2 | 40.35 | 23.40 |
| 3 | 40.51 | 26.56 |
| Average | 40.25 | 24.44 |
| σ | 0.31 | 1.84 |
Fatigue Testing
Monotonic testing has been extensively utilized to characterize the mechanical properties of AM parts. As AM techniques are increasingly used, it’s important to understand the resulting part’s reliability and expected lifetime performance. This requires characterization beyond simple and quick monotonic tensile testing and requires the product to be evaluated over time under the loads and deformations it will encounter in the intended application.
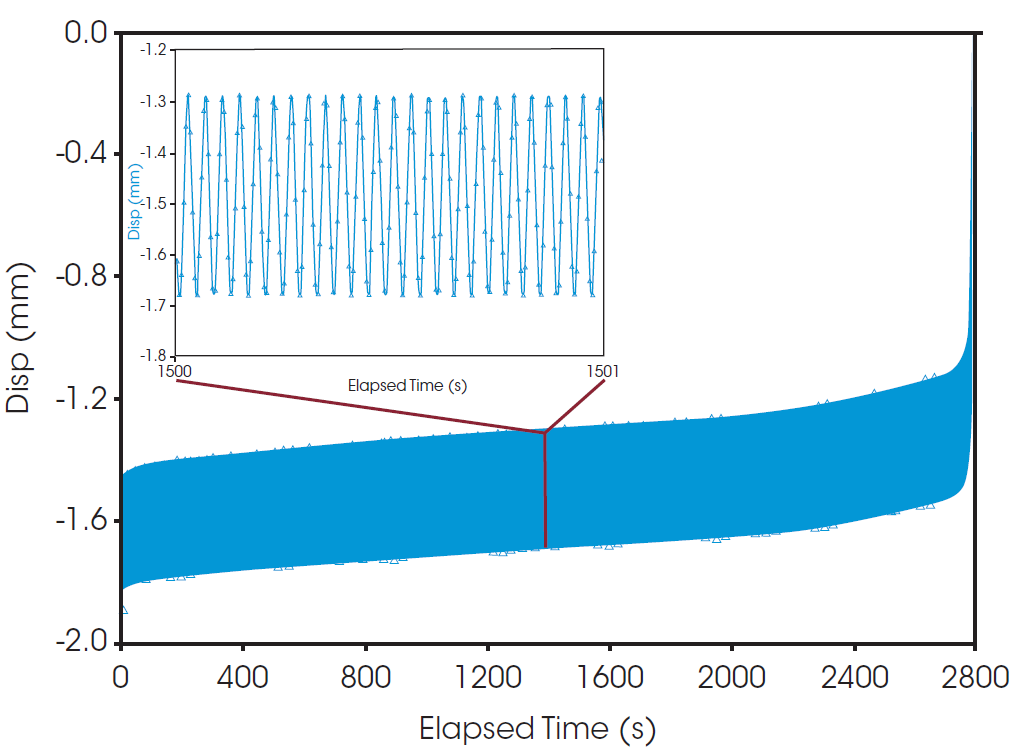
Fatigue testing was performed on the PA11 and PA12 samples to evaluate the robustness of the materials under constant cyclic loading. To illustrate this testing, Figure 3, shows the total displacement versus time for one of the PA11 samples during cyclic loading until failure at a stress level of 30 MPa. Over the entire experimental time, 0 to ~2800 s (7×10⁴ cycles), the sample length increases gradually throughout the test, as seen by an increasing displacement from its original position. Towards the end of the test, just before 2400 s (6×10⁴ cycles), the displacement begins to increase at a faster rate. This continues until the material fails, indicated by a sudden and sharp increase in displacement due to the material breaking.
The inset of Figure 3 shows a 1 s interval during testing to view what is happening to the material on a shorter time scale. All testing was performed at 25 Hz. In this one second interval, the material is exposed to 25 sinusoidal cycles with a well-defined amplitude that is cyclically stressing the material to the 30 MPa level. Viewing this test from these two different timescales shows how the continuous short time scale deformations lead to a bulk increase in sample length and this leads to the ultimate material failure.


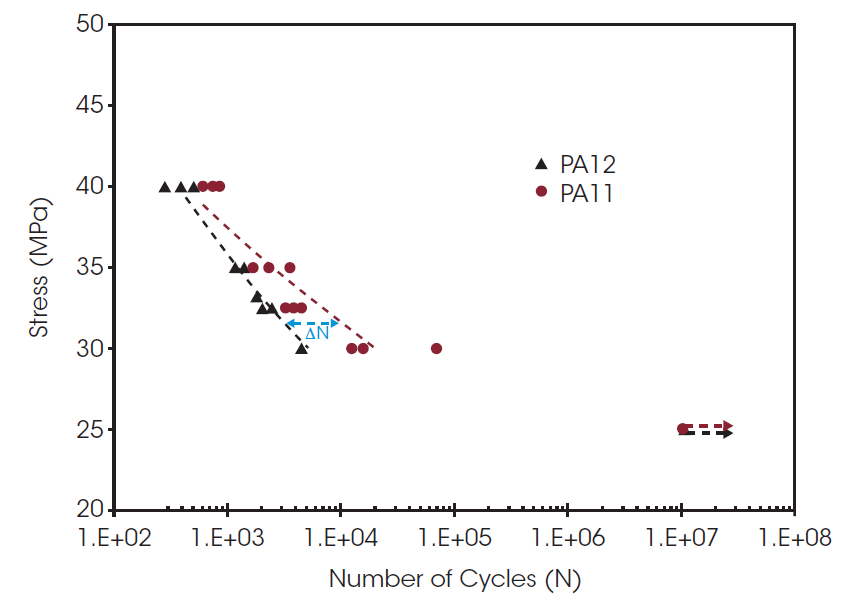
Figure 4 shows the resulting S/N curves, also called Woehler curves, with stress levels ranging from 40-25 MPa. The S/N curve plots the cyclic stress (S) amplitude versus the number of cycles to failure (N), making it useful for visualizing fatigue. At 25 MPa all samples reached 107 cycles, which was established as the run-out cycle limit for this study. When a stress level results in run-out samples, that stress level is considered to be below the endurance limit.
For both samples, the number of cycles to failure decreases as the stress level is increased. At stress levels between 30-40 MPa, PA12 reaches failure at a lower cycle number compared to PA11. Best fit trendlines were created for the curves with the data from 40-30 MPa; the 25 MPa level samples were omitted due to the absence of failure. At high stress levels, the number of cycles to failure are on the same order of magnitude at a few hundred cycles. From the trendlines, it is observed the difference in cycles to failure (ΔN=NPA11-NPA12, blue line in Figure 4) increases as the stress level decreases. This result is consistent with the monotonic data, as the stronger and more ductile PA11 is expected to be more robust under cyclic loading.
Performing triplicate tests at each stress level allows the reproducibility of the AM process to be analyzed in a similar manner to the monotonic testing. The PA12 S/N curve has little spread in the data at each stress level. However, PA11 has a noticeable spread in the data for stress levels of 35 and 30 MPa. From the monotonic data it was also observed the standard deviations on the UTS and % elongation at failure were greater for PA11 compared to PA12. This identifies that PA11 may be hindered by reproducibility issues in the laser sintering AM process and this manifests as variability in the mechanical and fatigue properties of the material.
The variability observed in this work shows that comprehensive evaluation of laser sintered PA11 parts should be carried out prior to application use. This will involve testing a larger number of samples at the given application stress levels and therefore more rigorously establishing the confidence levels of the subsequent fatigue limits. Systematic fatigue testing should also be performed between 25 and 30 MPa to establish a precise endurance limit based upon the results where the 25 MPa stress level caused run out for all samples. In addition, further characterization of the material by direct and indirect methods such as electron microscopy, X-ray diffraction, and thermal analysis should accompany this testing to identify the microstructural origins of this variation.
Conclusions
As AM parts become more widely utilized in end-use applications, it is necessary to understand the mechanical performance and reliability of the parts, as well as the potential variability caused by the manufacturing process. In this note PA11 and PA12 were examined in relation to their mechanical and fatigue life properties using the ElectroForce 3300. The ElectroForce 3300 proved well suited for these measurements, utilizing a single piece of equipment for both mechanical and fatigue tests under a wide range of test methods:
- The monotonic tensile testing identified that PA11 has superior mechanical strength and ductility properties with a greater UTS and % elongation at failure compared to PA12.
- Fatigue life testing identified that PA11 had a longer fatigue life cycle compared to PA12 at every given stress level tested. The difference between the life cycle increase of PA11 over PA12 grew as the stress level decreased.
- Performing multiple iterations for each sample allowed repeatability of part design in the AM process to be assessed.
The variation in mechanical properties, especially in PA11, identified that work still needs to be done to overcome part-to-part variability that has plagued AM processes. Based upon the mechanical and fatigue analysis, PA11 is the polymer of choice for an end-use product as it will be expected to remain robust and have a longer lifetime compared to PA12. Along with these mechanical property considerations, the low carbon footprint of producing PA11 from bio-derived sources compared to the petroleum-based PA12 makes it a clear materials choice from a sustainability standpoint as well.
References
- G. N. Mhetre, V. S. Jadhav, S. P. Deshmukh and C. M. Thakar, “A Review on Additive Manufacturing Technology,” ECS Trans., vol. 107, p. 15355, 2022.
- S. S. Alghamdi, S. John, N. R. Choudhury and N. K. Dutta, “Additive Manufacturing of Polymer Materials: Progress, Promise, and Challenges,” Polymers, vol. 13, p. doi. org/10.3390/polym13050753, 2021.
- A. Salazar, A. Rico, J. Rodriguez, J. S. Escudero and F. M. de la Escalera Cutillas, “Monotonic loading and fatigue response of a bio-based polyamide PA11 and a pertol-based polyamide PA-12 manufactured by selective laser sintering,” European Polymer Journal, vol. 59, pp. 36-45, 2014.
- N. Lammens, M. Kersemans, I. De Baere and W. Van Paepegem, “On the visco-elasto-plastic response of additively manufactured polyamide-12 (PA-12) through selective laser sintering,” Polymer Testing, vol. 57, pp. 149-155, 2017.
- S. C. Lao, W. Yong, K. Nguyen, T. J. Moon, J. H. Koo, L. Pilato and G. Wissler, “Flame-retardant Polyamide 11 and 12 Nanocomposites: Processing, Morphology, and Mechanical Properties,” Journal of Composite Materials, vol. 44, pp. 2933-2951, 2010.
- B. Van Hooreweder, D. Moens, R. Boonen, J. P. Kruth and P. Sas, “On the difference in materials structure and fatigue properties of nylon specimens produced by injection molding and selective laser sintering,” Polymer Testing, vol. 32, pp. 972-981, 2013.
- A. D638-22, “Standard Test Method for Tensile Properties of Plastics,” ASTM International, 2022.
- L. Dowling, J. Kennedy, S. O’Shaughnessy and D. Trimble, “A review of critical repeatability and reproducibility issues in powder bed fusion,” Materials and Design, vol. 186, p. 108346, 2020.
- V. Malmgren, “PA11 vs PA12-one atom different,” wematter, 01 2022. [Online]. Available: https://wematter3d.com/pa11-vs-pa12-one-atom-different. [Accessed 5 05 2023].
Acknowledgement
This paper was written by Mark Staub, PhD at TA Instruments.
Click here to download the printable version of this application note.

