Keywords: Rheology, Multi-wave, Oscillation, viscoelasticity, Harmonics, Thermoset
RH096
Abstract
Dynamic tests to monitor changes in structure are usually conducted at a single frequency. In order to perform a more detailed characterization, the rheological properties of a sample may need to be measured at multiple test frequencies. This is typically done in a frequency sweep test, where data is collected point-by-point at each frequency. The multi-wave oscillation technique is an enhancement of the single frequency oscillation technique and allows the sample to be subjected to multiple oscillation frequencies simultaneously. This approach significantly shortens the experimental time and provides increased insight into processes such as thermoset curing. One case study of monitoring the cure of an epoxy-based thermoset with this multi-wave test is presented.
Introduction to Multi-Wave Oscillation
In a dynamic oscillatory test, a sinusoidal strain or stress is applied to the sample under a certain frequency. For example, at a frequency of 6.28 rad/s (1 Hz), the instrument applies one oscillation cycle to the sample in one second. As long as the input sinusoidal strain is within the linear viscoelastic region of the sample, the output stress waveform should also be sinusoidal with a certain phase angle shift.
The viscoelastic properties of soft matters, such as pastes, gels or polymer melts are sensitive to the measurement frequency, and the rheological parameters such as storage modulus (G’), loss modulus (G”) and complex viscosity (η*) can vary significantly as a function of testing frequency. Figure 1 shows data from a dynamic frequency sweep performed on a viscoelastic material – Polydimethylsiloxane (PDMS). The data was collected point by point from 0.1 rad/s up to 100 rad/s with 5 points per decade. As can be observed, the viscoelastic properties of the material are a strong function of the test frequency.
A multi-wave test allows users to interrogate the sample with multiple frequencies within one oscillation cycle. Each frequency can be programmed to using a different oscillation strain (when using the ARES-G2) or oscillation stress (when using the DHR) so that the total peak strain/stress amplitude in the resulting multi-waveform is within the linear viscoelastic region of the sample. A schematic of the waveform construction is shown in Figure 2. In a multi-wave test using the ARES-G2 rheometer (Figure 2), a fundamental frequency is first selected at 10 rad/s. The 5th, and 10th harmonics would correspond to frequencies of 50 and 100 rad/s, respectively. The total applied strain is simply a summation of the individual oscillations at each frequency.

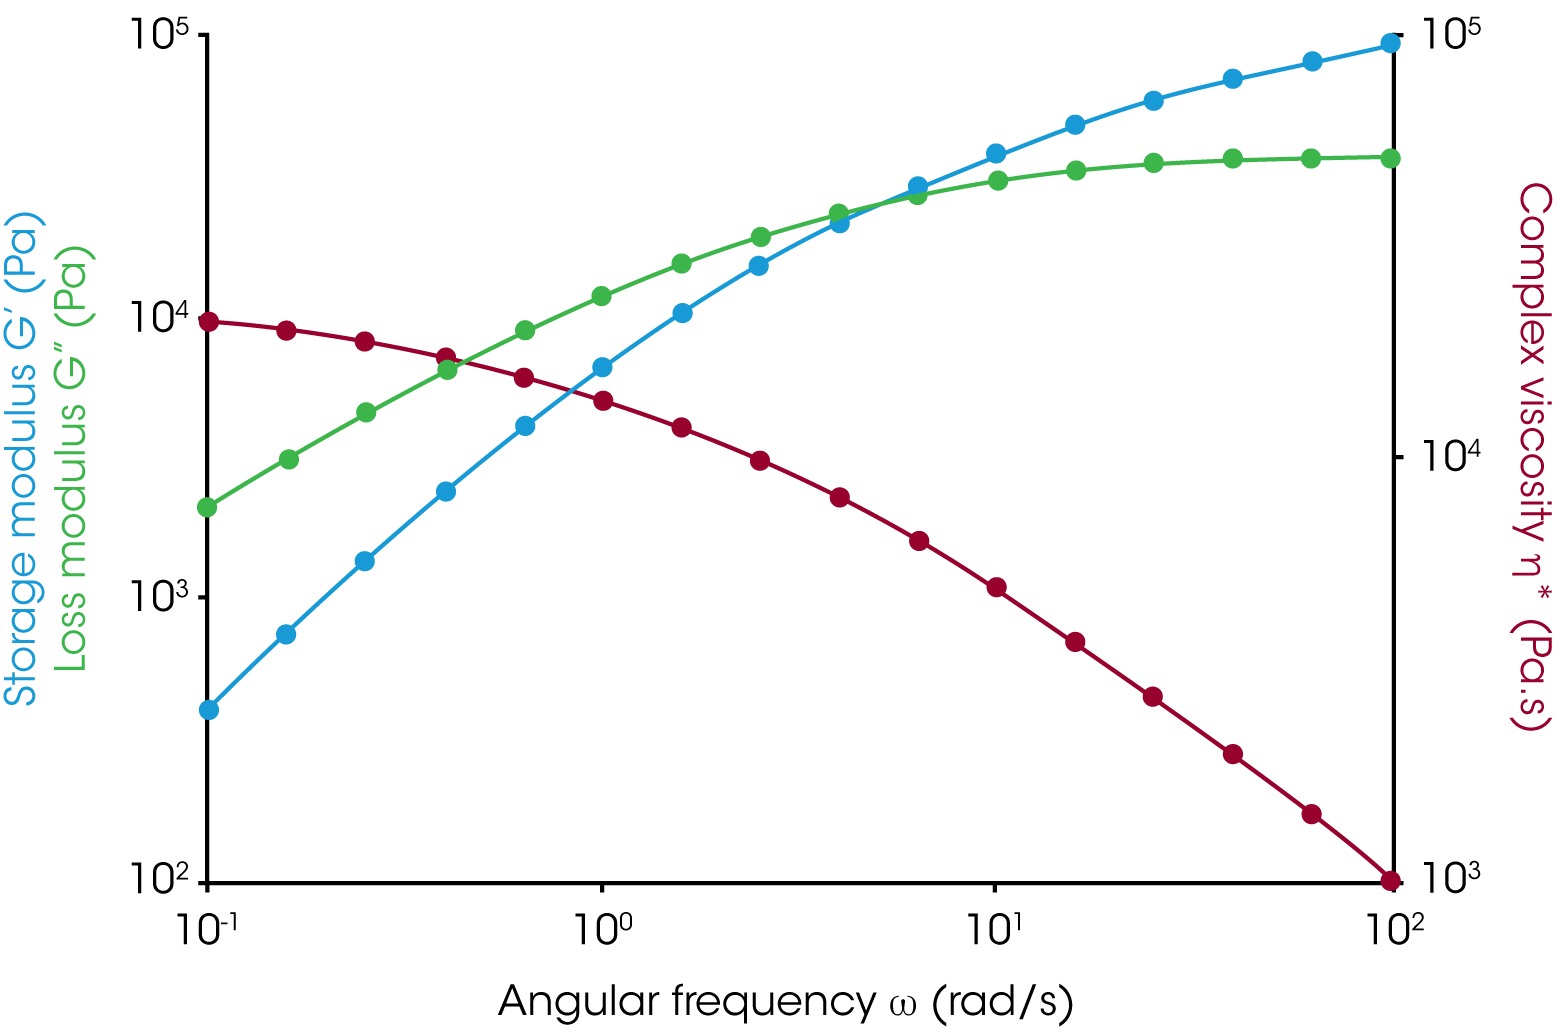
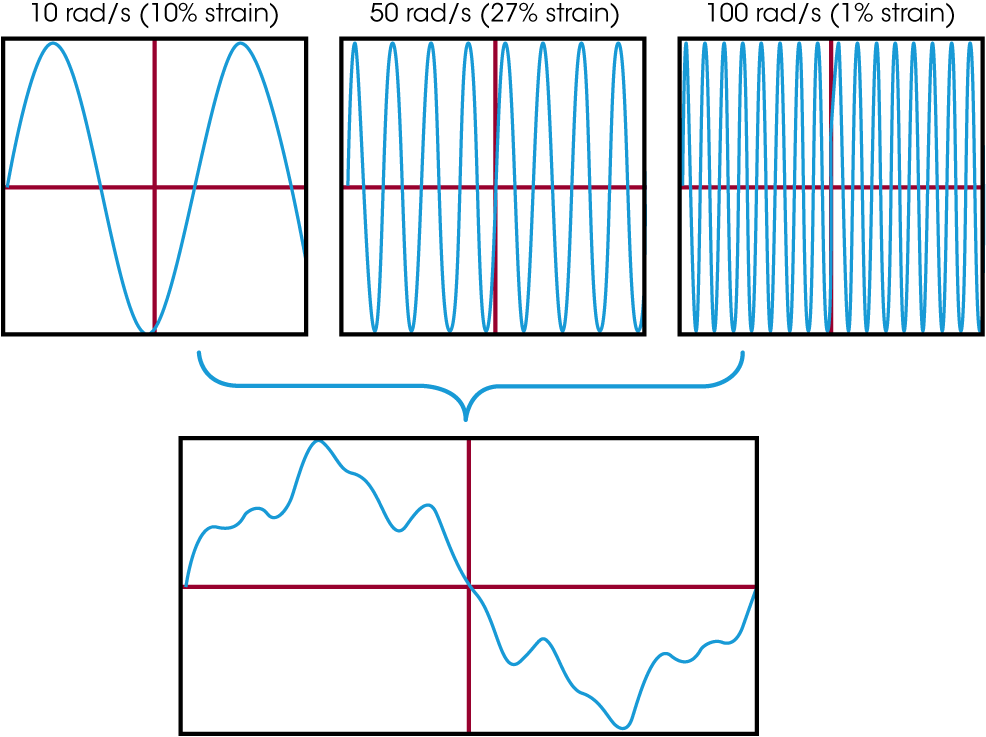
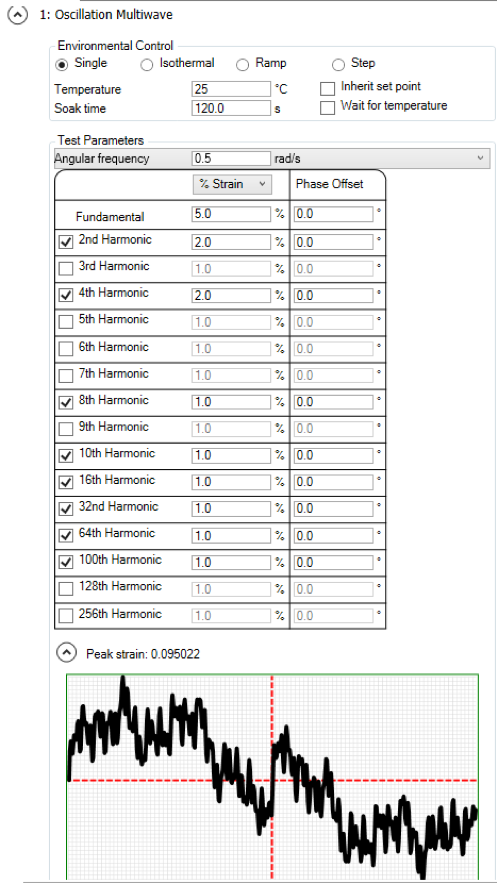
Figure 3 demonstrates how to use TRIOS software to set up a single multi-wave oscillation test on PDMS using the ARES-G2 rheometer. The fundamental frequency is set at 0.5 rad/s with 5% strain. Higher harmonics are selected at 2nd, 4th, 8th, 10th, 16th, 32nd, 64th, 100th, which correlates to frequencies at 1 rad/s, 2 rad/s, 4 rad/s, 5 rad/s, 8 rad/s, 16 rad/s, 32 rad/s and 50 rad/s, respectively. Lower strain amplitudes are used at higher harmonic frequencies to ensure the final strain stays within the linear region of the sample. Further, when using the ARES-G2, the TRIOS software also allows users to apply a phase offset to the higher harmonics. This helps in maintaining the total strain of the combined multi-wave within the linear region and in easier deconvolution of the data by separating the peak amplitude at different harmonics. The peak strain programmed in this test is at 9.5%. The total measurement time is controlled by the fundamental frequency, which is 0.5 rad/s.
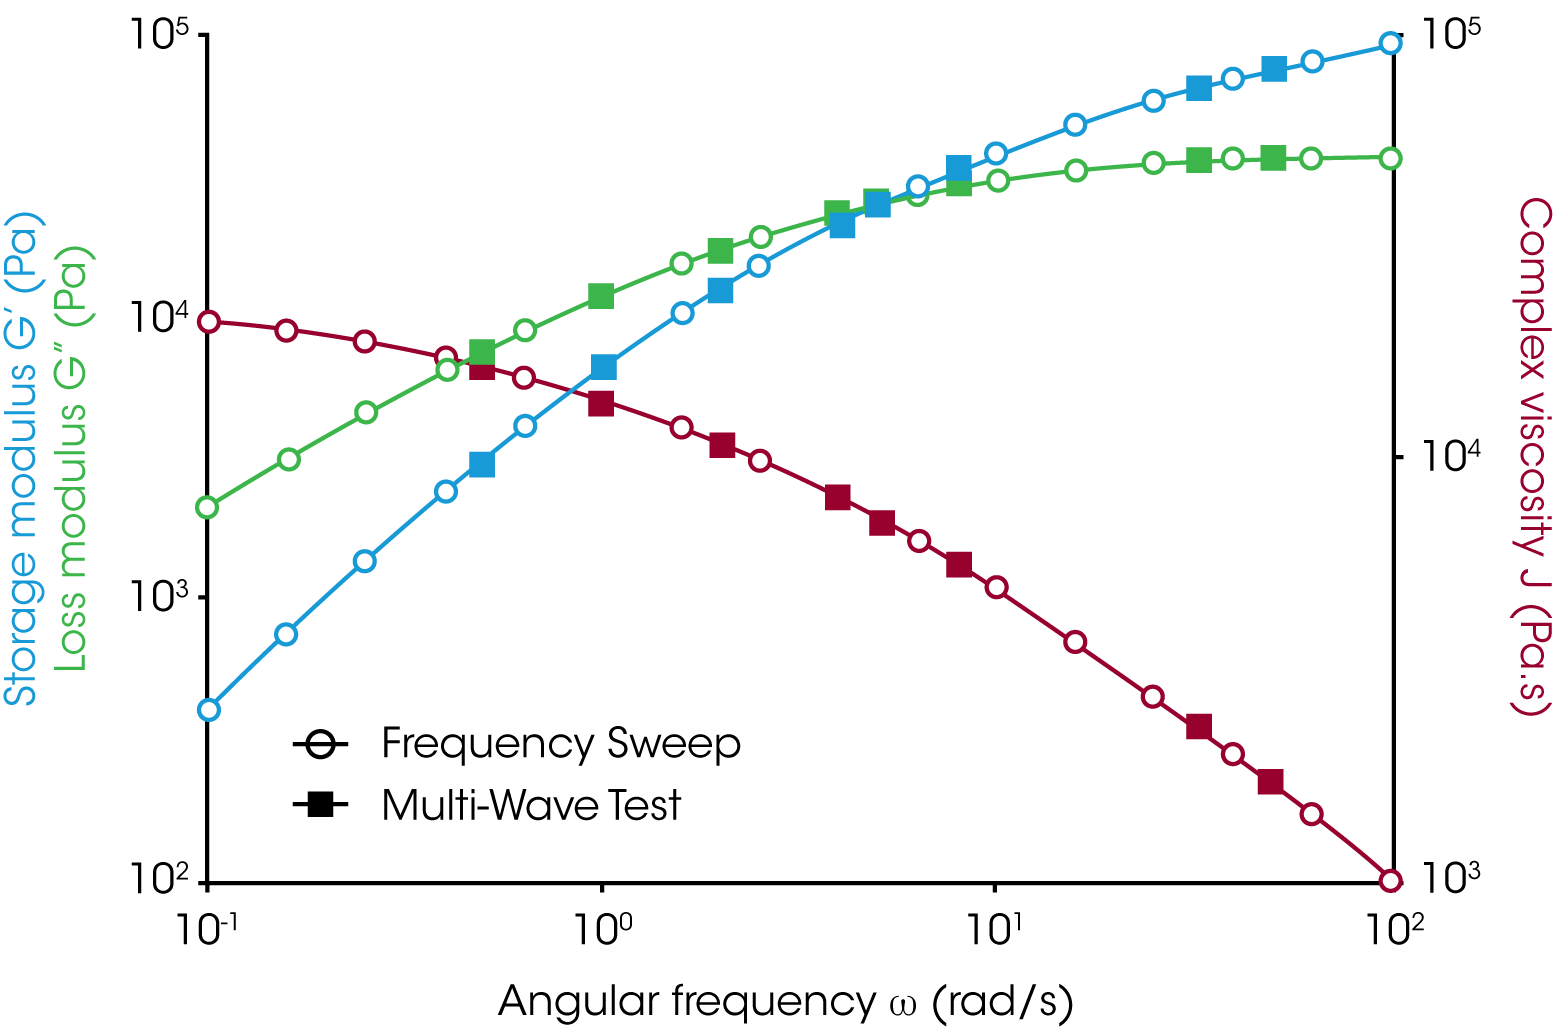
The overlay of a PDMS frequency sweep test result and a multi-wave test result are shown in Figure 4. Both tests were conducted using a TA Instruments’ ARES-G2 rheometer with TRIOS software. This overlay plot shows identical results between these two experimental tests. But the overall duration of the multi-wave test is equivalent to a signal point test at the fundamental frequency of 0.5 rad/s. Multi-wave tests can be performed isothermally, or the temperature can be ramped up and down. The advantage of multi-wave test over the time sweep and temperature ramp is the fact that the evolution of a material, or the continuous temperature change, will affect all the frequencies in the same way. In other words, the frequency response is now representative the state of a material at a given time of temperature.
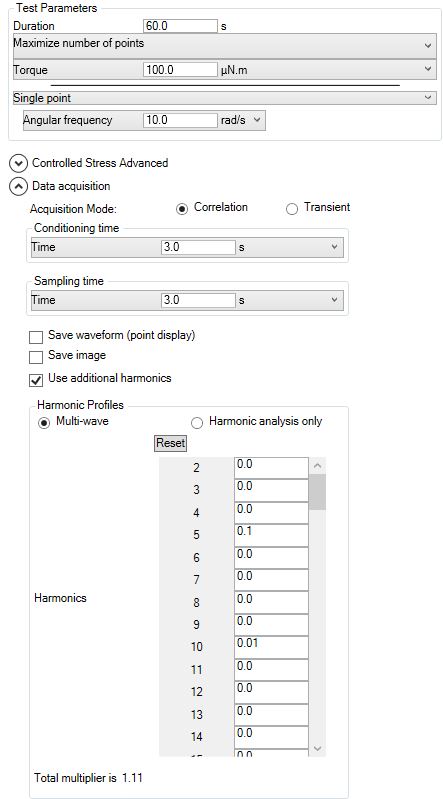
Multi-wave oscillation is available on all TA Instruments’ rheometers. The multi-wave test performed on an ARES-G2 is based on strain control, while on a DHR is based on a stress or torque control. The multi-wave feature on a DHR rheometer is built in all dynamic test procedures. For example, Figure 5 demonstrates a multi-wave test procedure build-in a dynamic time sweep. In this time sweep test, a fundamental frequency of 10 rad/s and oscillation torque of 100 µNm is setup in the main time sweep procedure. Then under data acquisition, multi-wave can be programmed as shown below. The numbers on the left represent the higher harmonic frequency multiplier factors, and the user entered numbers on the right are the multiplier factors of the oscillation torque at each frequency. Based on this test setup, the multi-wave test will be performed at 3 frequencies of 10, 50 and 100 rad/s at oscillation torque of 100 µNm, 10 µNm and 1 µNm, respectively.
Applications of Multi-Wave Experiment
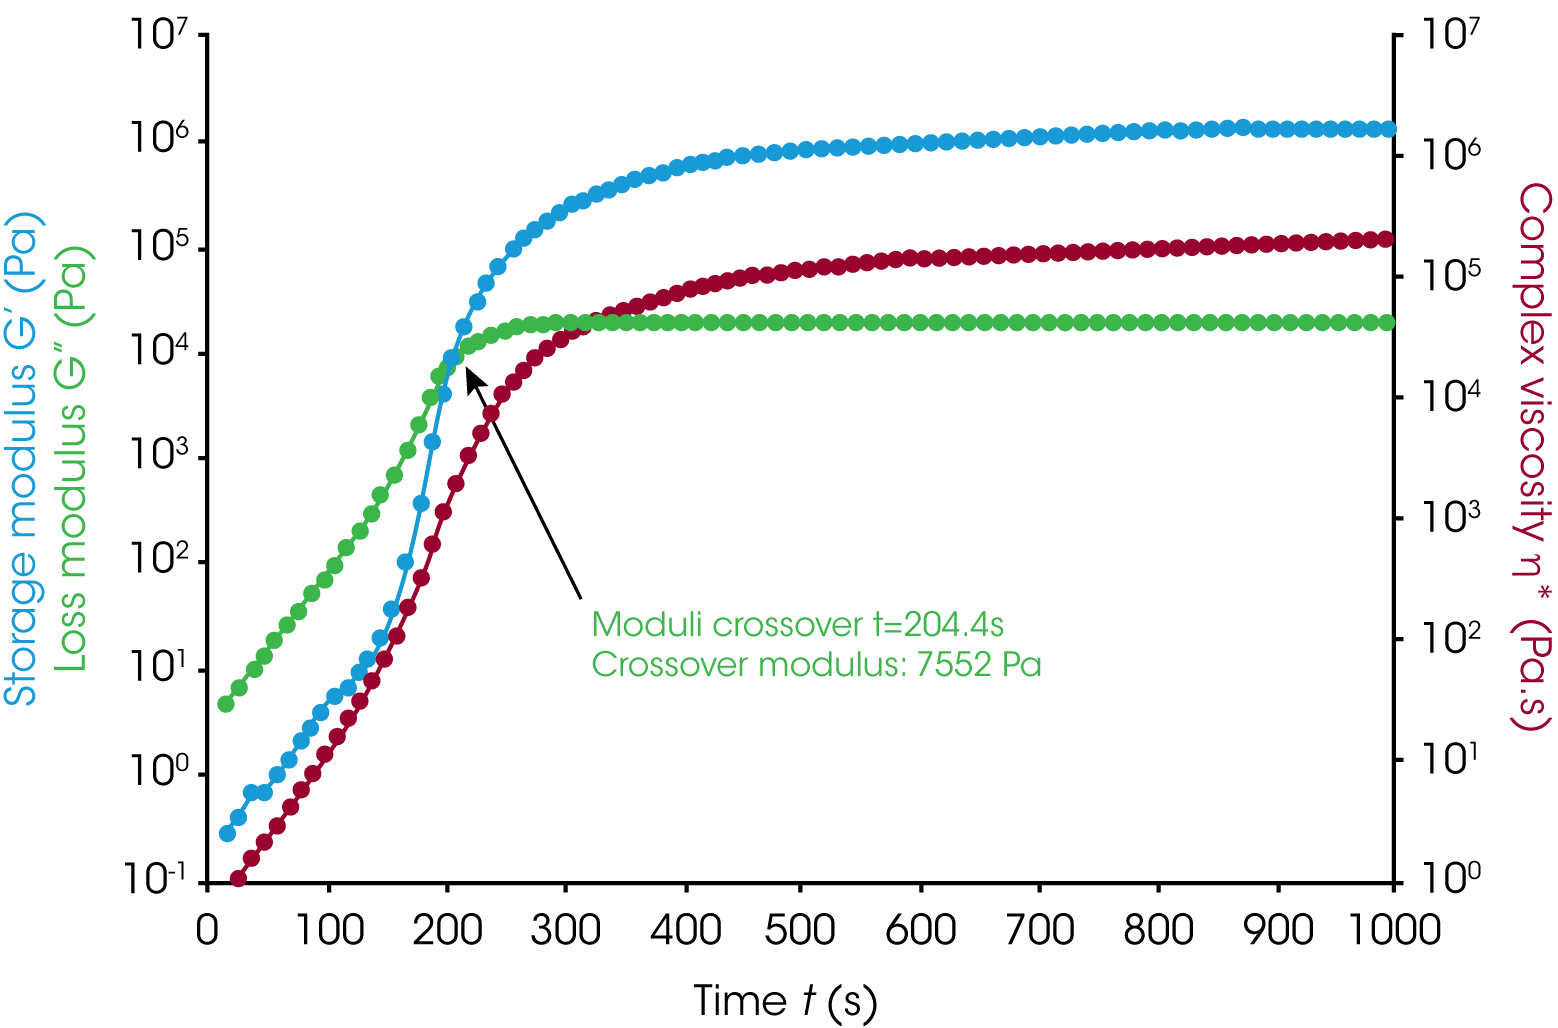
Rheology is one of the most commonly used techniques for studying thermoset curing. The polymerization and crosslinking process of a network formation can be divided into two stages separated by the “gelation point”. The gel point is one of the most important characteristics of curing. One commonly accepted definition of the “gel point” is the time or temperature where G’ and G” curves intercept and tan (δ =1 (example shown in Figure 6). In general, most rheology tests, including curing, are conducted using a single frequency such as 1 Hz. While this approach is suitable for practical purposes such as product qualification, it represents a simplistic view of the curing process but may not be applicable for all samples. For example, the initial sample structure in some prepreg samples results in G’ > G” throughout the test. In such cases, a crossover point is not present throughout the entire test.
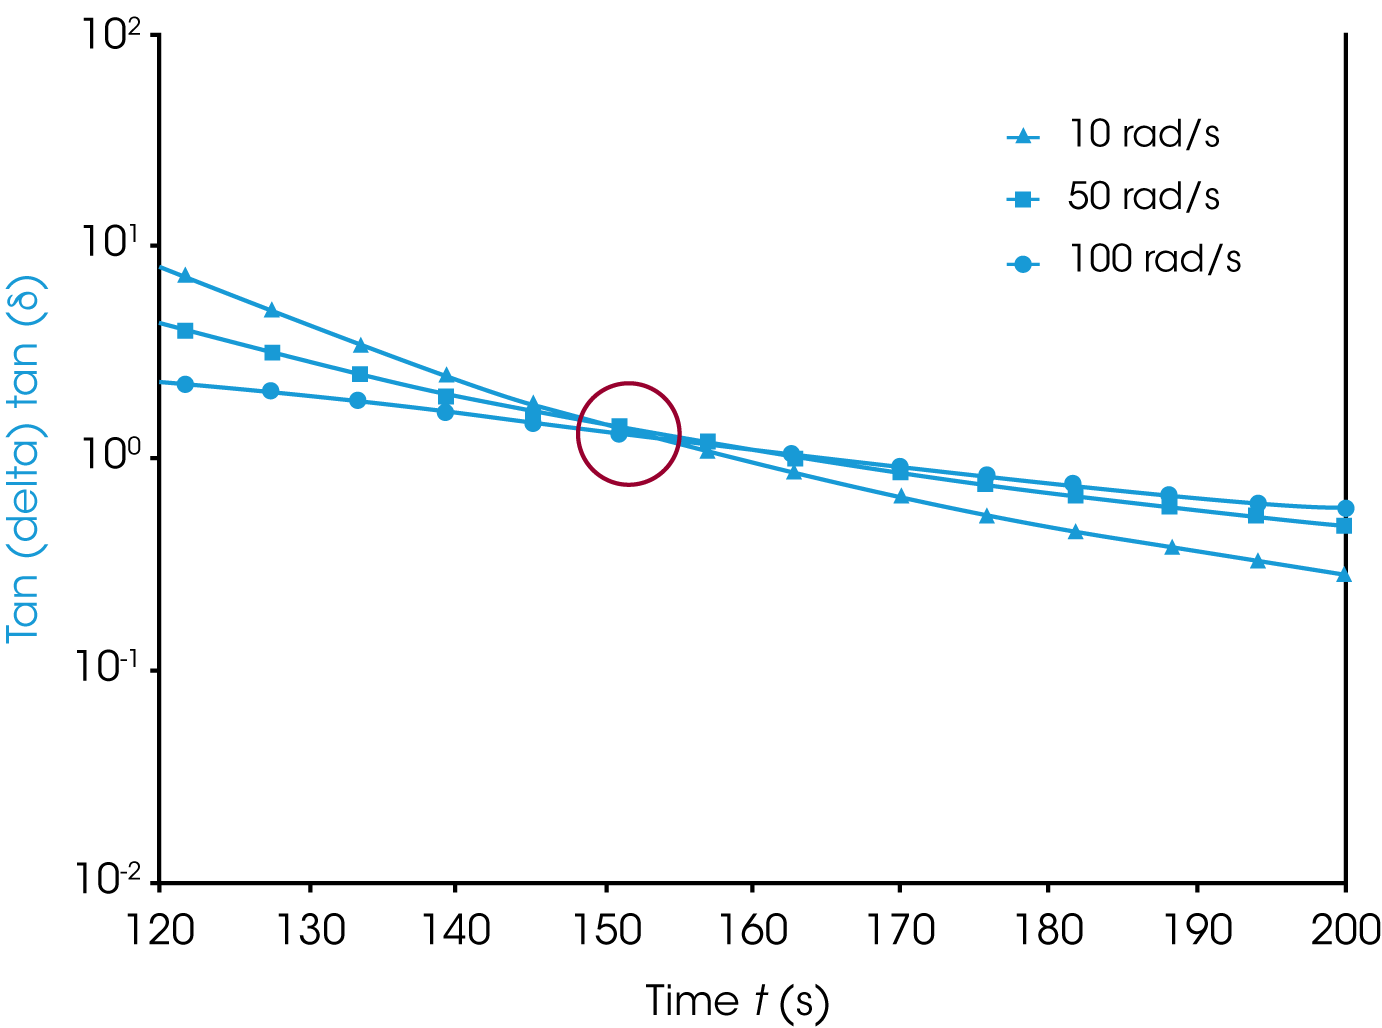
Winter et al. [1987. DOI: 10.1002/pen.760272209] have pointed out that using the G’/G” crossover point to describe the gel point of a polymer is only satisfied if stress relaxation in the critical gel follows a power law of G (t) = t-1/2. In their paper, Winter introduced a more precise method to define the true gel point by identifying the intersection of the tan (δ) curves measured at different frequencies (example shows in Figure 7). Determining the true gel point of a thermoset in this manner typically requires multiple experiments at different oscillation frequencies. However, running multiple experiments requires preparing multiple samples and has the potential to introduce variation due to differences in sample loading and trimming techniques. In addition, this approach can also be time-consuming, especially for slow curing systems.
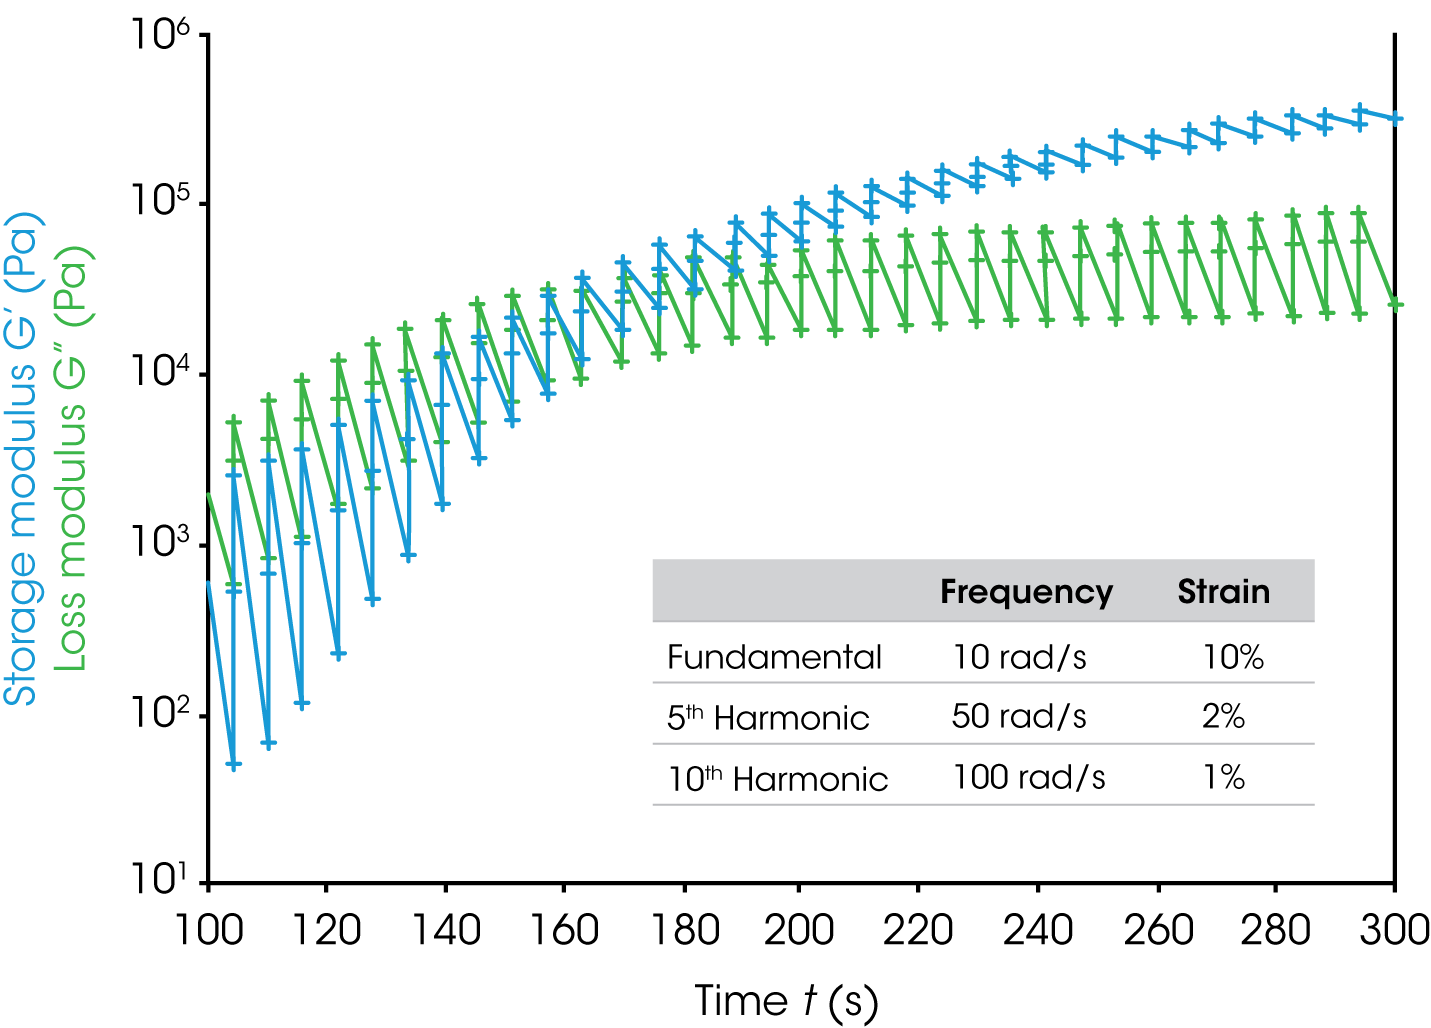
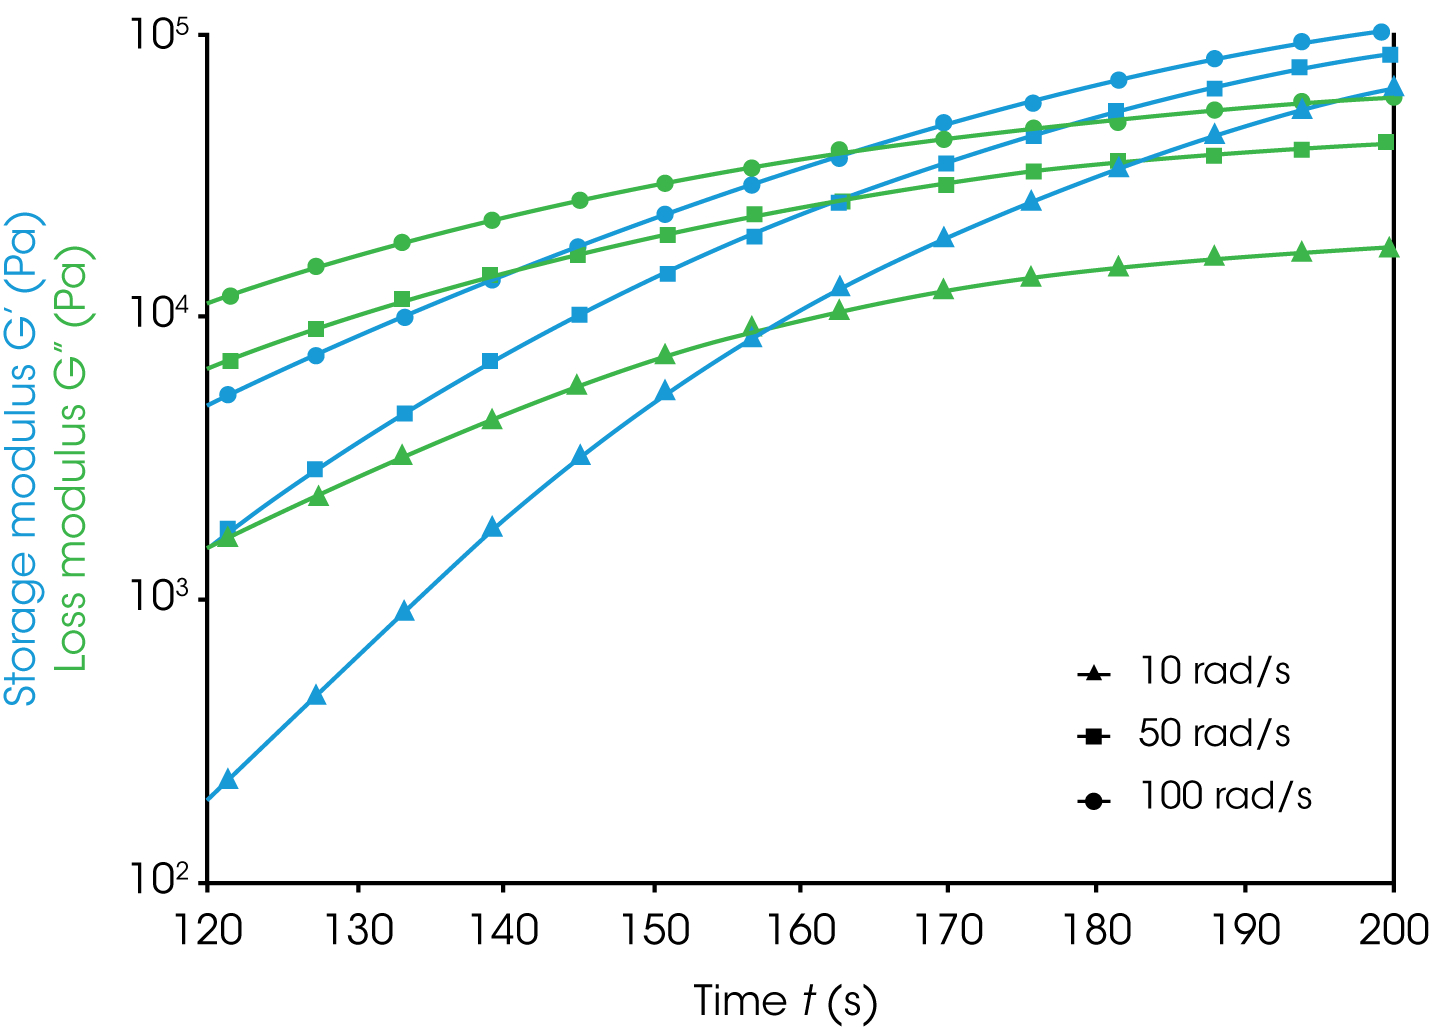
The rheological multi-wave test method provides an opportunity for obtaining the same information in a single experiment by simultaneously applying multiple frequencies. The multi-wave test method continuously tracks the material at multiple frequencies at each data point, making it ideal for studying the temporal evolution of thermosetting materials. One example raw data from a multi-wave experiment conducted on ARES-G2 is presented in Figure 8a. The three vertical points at each time point represents the simultaneous collection of data at the three frequencies in the multi-wave (10 rad/s, 50 rad/s and 100 rad/s). The material response to the applied multi-wave strain is automatically deconvoluted into the individual frequencies and the measured data points are simultaneously correlated to extract the elastic and viscous moduli for all the excitation frequencies applied in the multi-wave. The raw data were subsequently split into 3 separate time sweeps at frequencies of 10, 50, and 100 rad/s using the TRIOS software. This is presented in Figure 8b, where the data are equivalent to overlaying three separate isothermal cure experiments at each frequency.
Figure 8. Multi-wave test to monitoring epoxy curing at 80 °C. Test was conducted using an ARES-G2 rheometer at isothermal temperature of 80 °C.
Conclusions
Rheology multi-wave test is one of the standard oscillatory test methods that is available on all TA Instruments’ rheometers. The multi-wave technique allows a sample to be subjected to multiple oscillation frequencies simultaneously by merging them into one single waveform. The resulting oscillation waveform is the combination of all frequencies at each specific time. One of the major benefits of using multi-wave test method is at a reduction of experimental time.
Acknowledgement
This note was written by Tianhong (Terri) Chen, Application Support Engineer (TA Instruments)
Click here to download the printable version of this application note.

