Keywords: Rheology, Food, Viscosity, Structure Recovery, Yield Stress
RH117
Background
Yogurt is a weakly structured dairy emulsion that displays shear thinning, thixotropy, and a yield stress. Yogurt may also exhibit slip on smooth surfaces and dry at interfaces exposed to air. In order to obtain accurate and reproducible data, it is important to address these challenges.
During formulation development, rheological measurements may be used to quantify yogurt attributes such as mouthfeel, swallowability, and processability. Measurements at lower shear rates around 0.01 – 1 s-1 pertain to flow under gravity. Rates of 1 – 100 s-1 are typical in processes such as chewing and swallowing. At higher shear rates, it is important to quantify the viscosity due to impacts on processing and pumping.
Yield stress measurements aid in determining stability [1]. Yogurt flows above the yield stress, which can cause phase separation and reduce shelf life. Additionally, the yield stress helps keep fruit pieces well dispersed. Without a sufficient yield stress, the fruit will sink to the bottom.
Measurement artefacts may arise from wall slip, drying, and condensation. Structured fluids, such as yogurt, may slip on smooth surfaces because of a low viscosity boundary [2]. Additionally, yogurt is primarily composed of water, which evaporates when left exposed to air. At low temperature storage conditions (~4 °C), water may condensate. The fluctuations in composition at the air interface can significantly affect rheological measurements.
This application note helps users identify good starting parameters for yogurt and similar food emulsions. Preshear, flow, yield stress and oscillatory measurements will be discussed along with the rationale for selecting the relevant parameters.
Experimental Considerations
Important considerations for selecting a geometry and accessories include testing under a uniform thermal environment, evaporation/condensation, and wall slip. The Upper Peltier Plate for the TA Instruments Discovery Hybrid Rheometer provides a uniform temperature environment at the relevant storage (~4 °C) and pasteurization conditions (~85 °C). It also offers a solvent reservoir to mitigate evaporation and condensation. Additionally, a low viscosity oil can be applied to the edges of the sample to prevent evaporation. However, care should be taken in selecting an oil that will not affect the sample properties.
Structured fluids, such as yogurt, may slip on geometries with smooth plate surfaces, resulting in measurement artefacts. Geometries with roughened surfaces such as the sandblasted 40 mm parallel plate used in the data shown below can be used to mitigate slip effects. While a 40 mm cone may also be used, it is better suited for isothermal experiments where wall slip is not a concern.
Preshear
Yogurt, particularly at cold temperatures, resembles both a solid and liquid due to being a viscoelastic fluid. The material can both maintain its shape and flow. The microstructure of the yogurt can be broken down during loading. As a result, the sample may retain a “loading history” when it is dispensed for measurements and squeezed between the upper and lower geometries. Adding a preshear to the method removes the loading history and sets a consistent history by breaking down the fluid’s structure. Preshear may be implemented by shearing the sample in one direction or with an oscillatory motion. The shear rate should be set such that the structure is disrupted as evidenced by a decrease in the viscosity. A quick and preliminary shear rate ramp may be performed to select a shear rate, typically in the shear thinning region. It is also appropriate to allow the sample time (3-5 mins) to thermally equilibrate with the geometry.
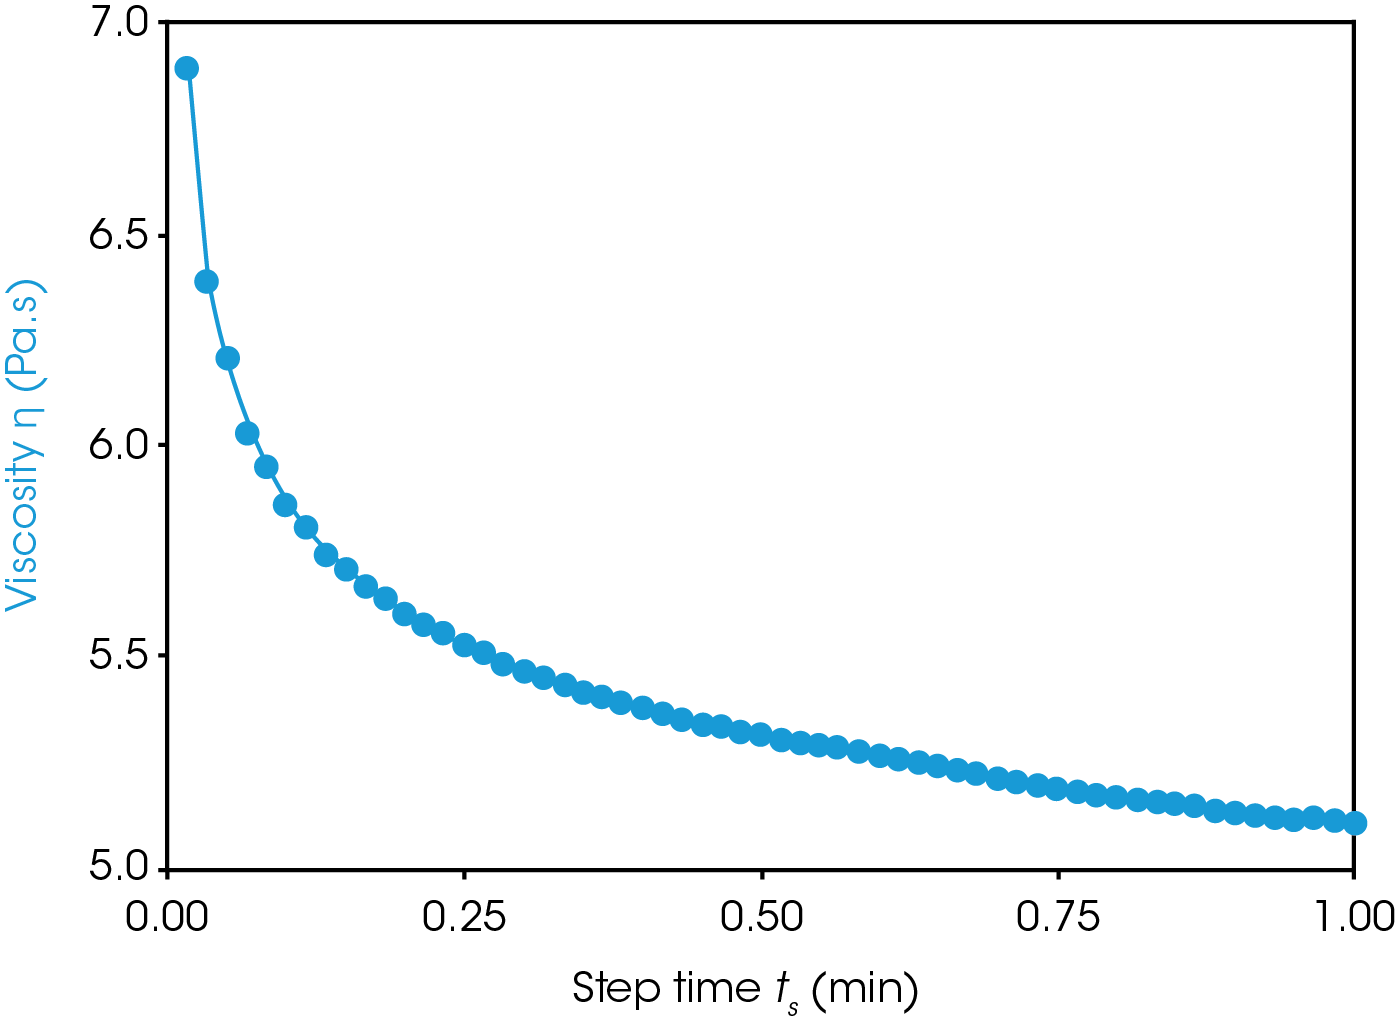
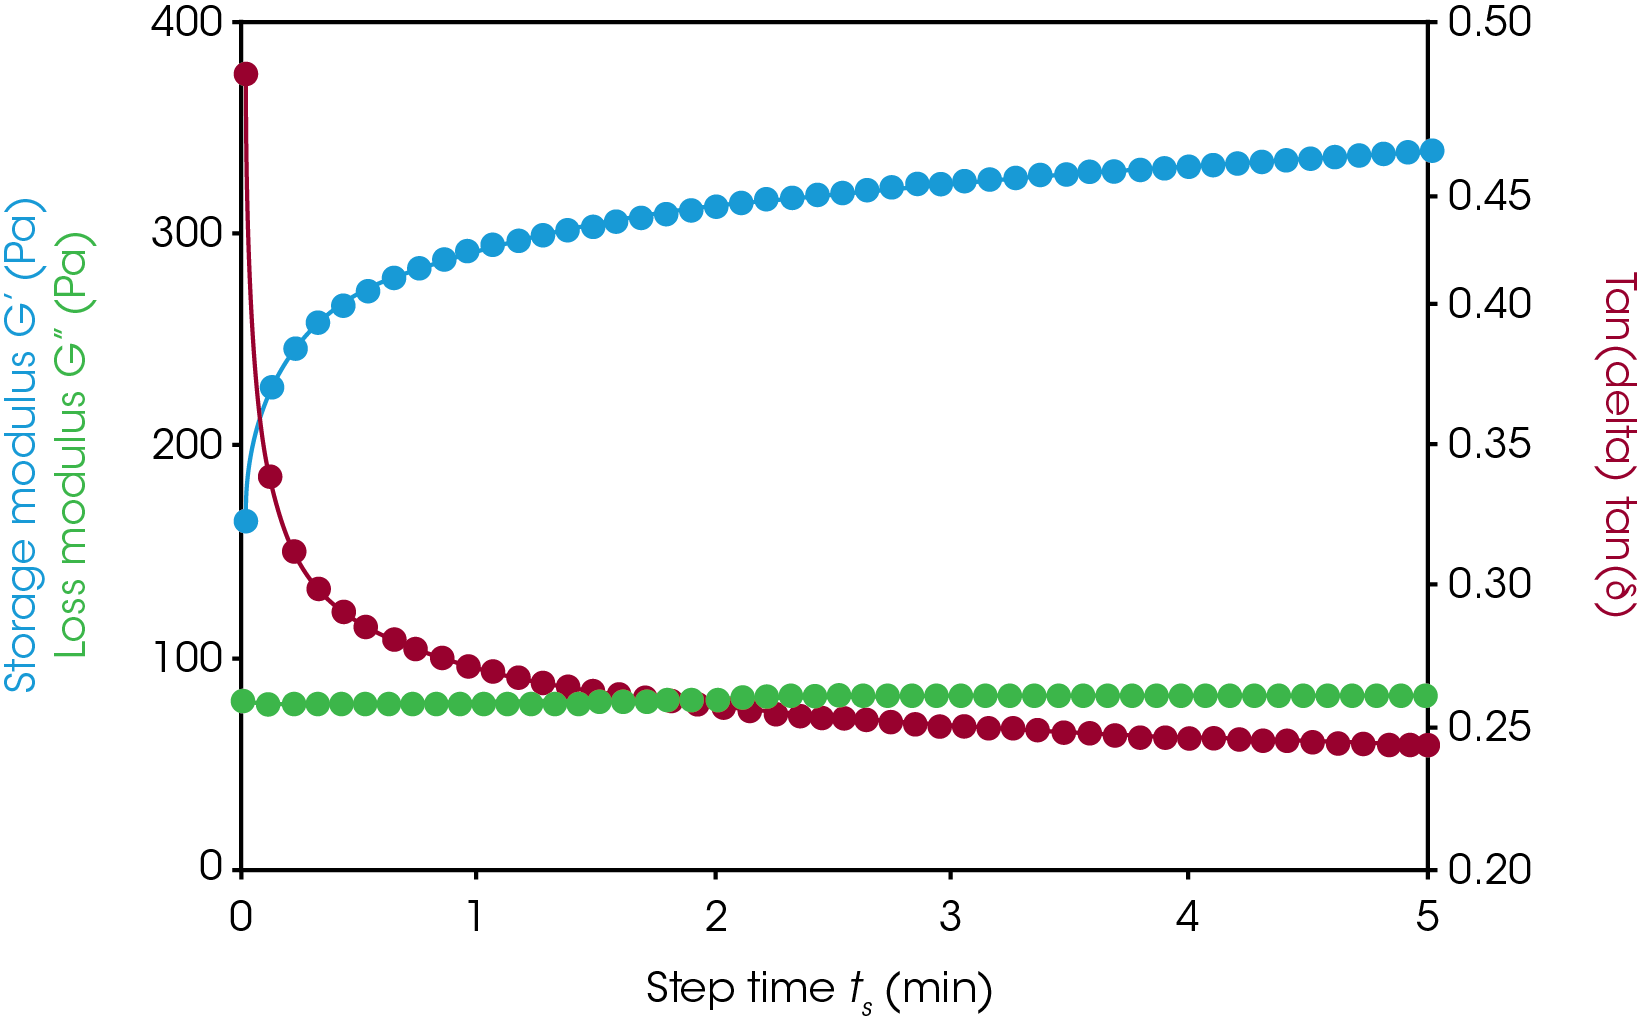
The plain non-fat Greek yogurt sample in Figure 1 was stored and loaded at 4 °C prior to a preshear at 10 s-1. The sample was sheared to erase any loading history. For subsequent samples, the viscosity starting values may vary (due to loading), but similar values should be reached at the end of the preshear. Before performing the next measurement, the sheared sample is allowed to recover. Recovery may be monitored with small amplitude oscillatory shear as shown in Figure 2. This method measures the material response under a small, fixed deformation within the linear viscoelastic region. This small motion allows users to probe the structure without destroying it and is ideal for measuring recovery.
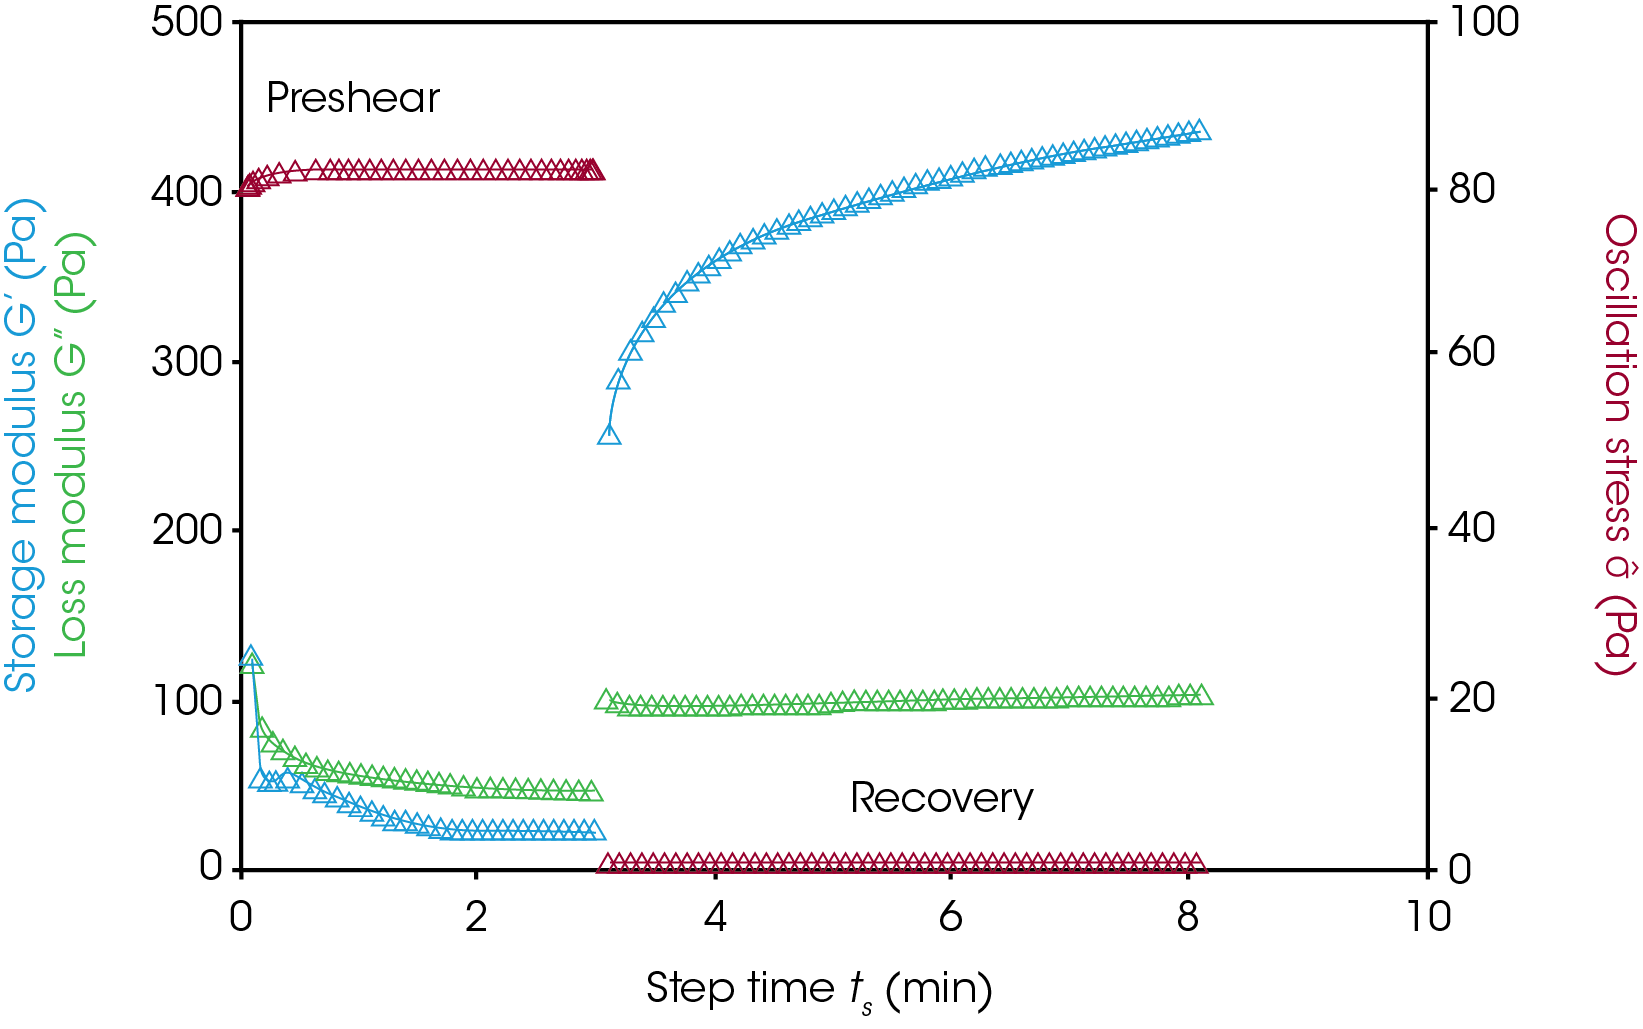
Another type of preshear may be performed with larger amplitude motion by controlling the shear amplitude (e.g. 100% strain) or the shear stress, which is above the linear region of the sample. Figure 3 shows an oscillatory preshear using ~80 Pa of stress followed by the recovery measured at 0.8 Pa. During the preshear, the structure is broken down and the loss modulus is higher than the storage modulus. When the elevated stress is removed, the storage modulus recovers as the structure rebuilds. A set time for equilibration or “soak time” after the preshear is then included in the procedure.
Flow Sweep
Figure 3. Oscillatory preshear and recovery of plain non-fat Greek yogurt. The storage modulus (blue) and loss modulus (green) are shown during and after preshear. The stress amplitude is shown in red.
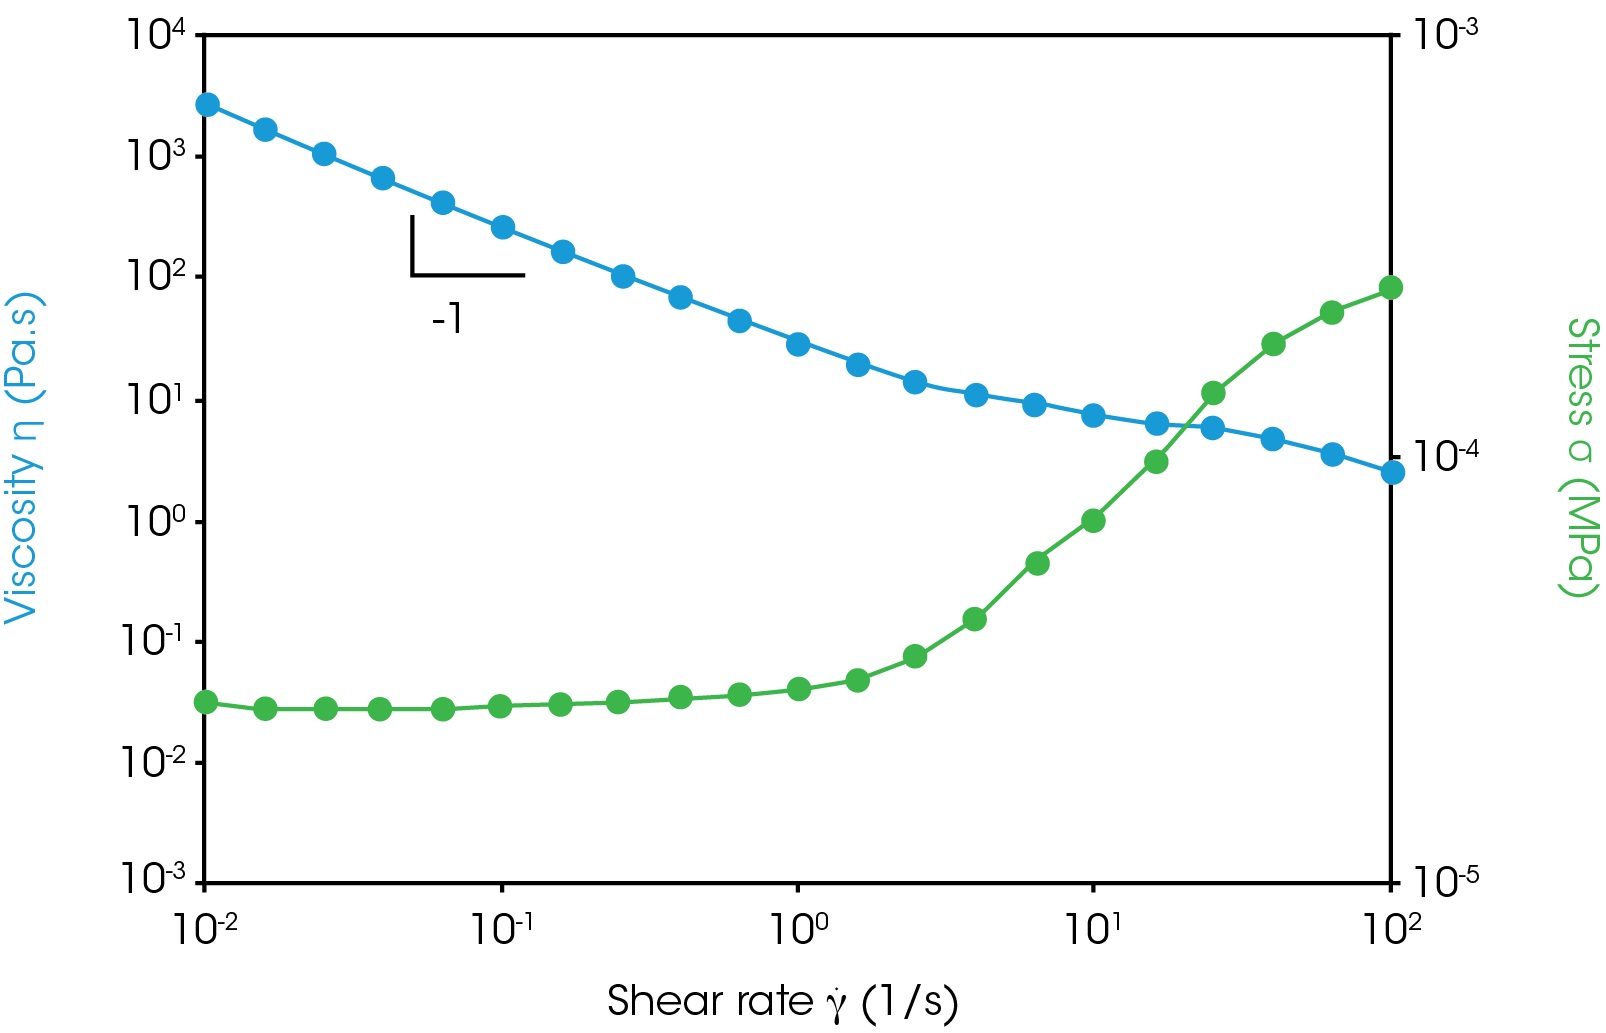
The instrument can automatically detect equilibration using steady state sensing. The example in Figure 4 is a shear rate sweep. The instrument controls the shear rate and measures the shear stress. The software may be set to take averages every 10 s and record a datapoint after 3 averages deviate by less than 5%. If this condition is not achieved in 1 minute and 30 seconds, then the software will report the data collected at the last 10 s and indicate that it was not collected at equilibrium due to time out. The instrument also records how each datapoint ended: equilibration or time out.
The shear rate range depends on the application. Yogurt may experience low shear rates of 0.01 – 1 s-1 during storage and and higher shear rates during chewing and swallowing. The shear rate sweep (Figure 4) shows shear thinning behavior and no plateau in the viscosity. It is notable that the viscosity as a function of shear rate has a slope of -1 on a log plot. The stress also decreases only slightly at lower shear rates, which is an indication of a yield stress. For structured viscoelastic fluids, like yogurt, a yield stress is expected.
Yield Stress
The yield stress is the stress at which a material starts to flow. Below the yield stress, the material does not flow. It is related to the structure of the material and the measured value depends on the experiment performed and the state of the material. As such, “apparent yield stress” is often used to report a yield stress value.
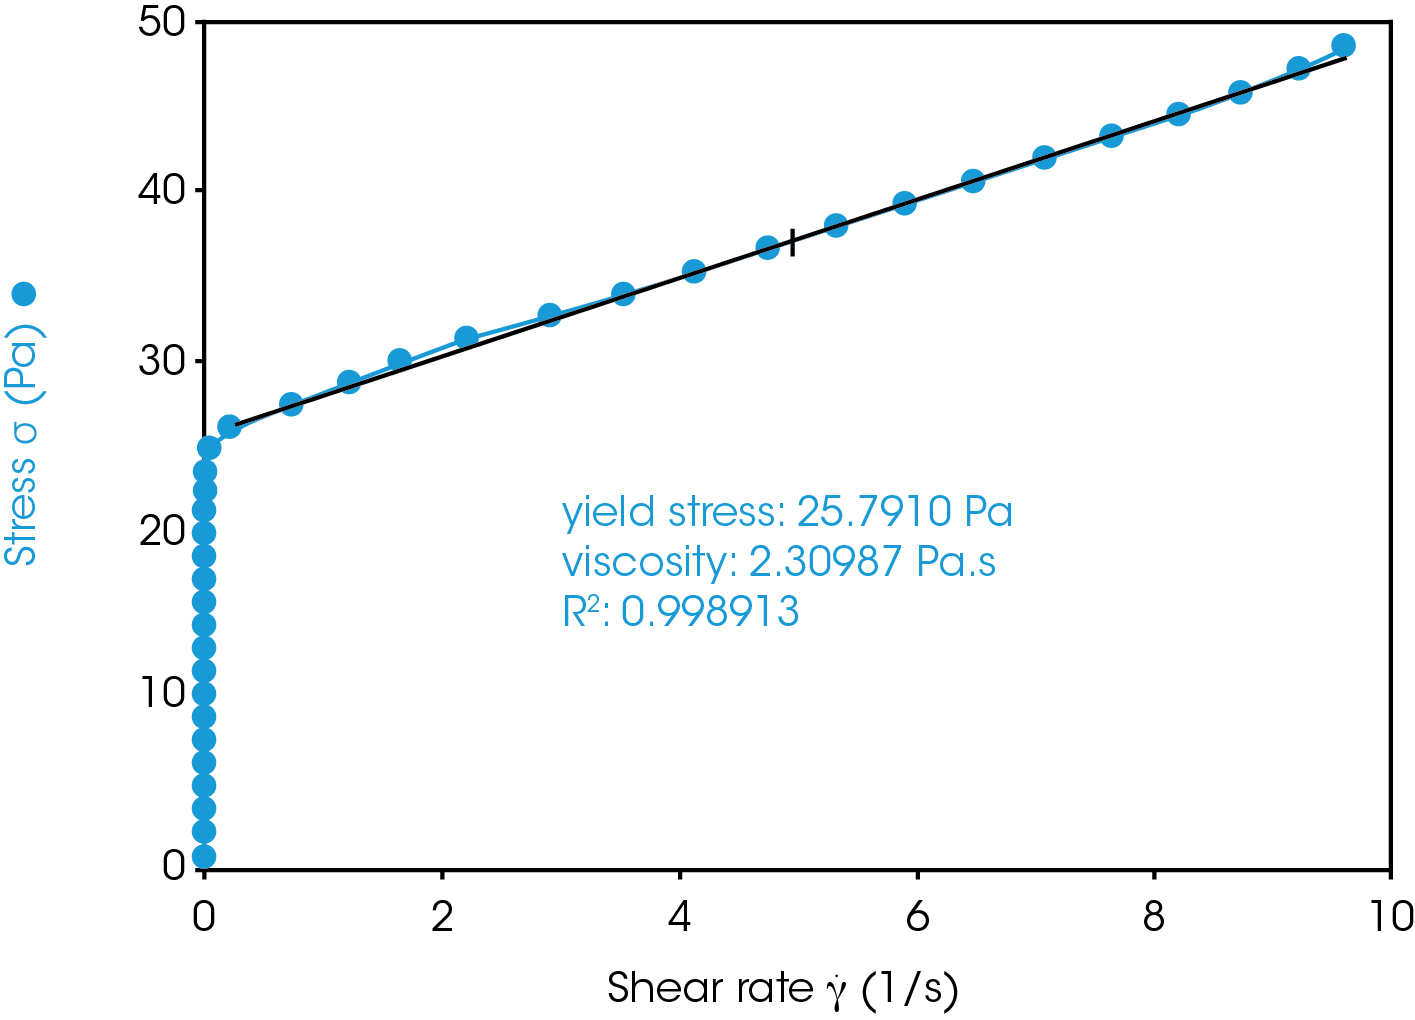
For the yogurt sample in Figure 4, a yield stress can be obtained by averaging the stress from the sweep between 0.01 and 1 s-1 giving a result of ~25 Pa. Another method to determine the yield stress is a flow ramp with stress control. Users can select the “Unlimited” mode on the experiment setup screen to control the flow ramp stress. The stress is increased linearly over time and after it exceeds the yield stress, the shear rate increases dramatically. The curve beyond the yield point may be fit to a line where the y-intercept at 0 shear is the yield stress. This fit is a Bingham model yield stress as shown in Figure 5. The yield stress value obtained is approximately the same as the value obtained from the flow sweep (~25 Pa). The result of the stress ramp can be influenced by the acceleration, or, how fast the stress increases. It is important to do the exact same experiment when comparing the yield stress of two samples. Where and how the intercept is calculated can also influence the result. Another model to mention is the Hershel-Bulkley model which fits the curve with a yield stress and power law relationship, rather than a purely linear fit after the yield.
As mentioned in the preshear section, structure recovery is time dependent. Similarly, the yield stress may be affected by when the material is measured. The yield stress would likely be measured lower just after stirring (shearing) than it would after minutes at rest. The structure of a material can often be investigated more analytically using oscillation experiments.
Oscillatory Measurements
Oscillatory measurements apply a sinusoidal deformation to the sample. The sample is sheared back and forth to determine the relationship between the stress and strain. A flow experiment gives a viscosity; stress divided by strain rate with units of Pascal seconds, Pa•s. An oscillatory measurement gives storage and loss moduli; stress divided by strain with units of Pascals, Pa. The higher the modulus of a sample the harder it is to deform. The storage (elastic) component relates to how well the sample holds its shape while the loss (viscous) component relates to energy dissipated when the material is sheared. A purely elastic material has no loss modulus, e.g. steel. A purely viscous material has no storage modulus, e.g. water or oil. Materials with some viscous and some elastic component are viscoelastic.
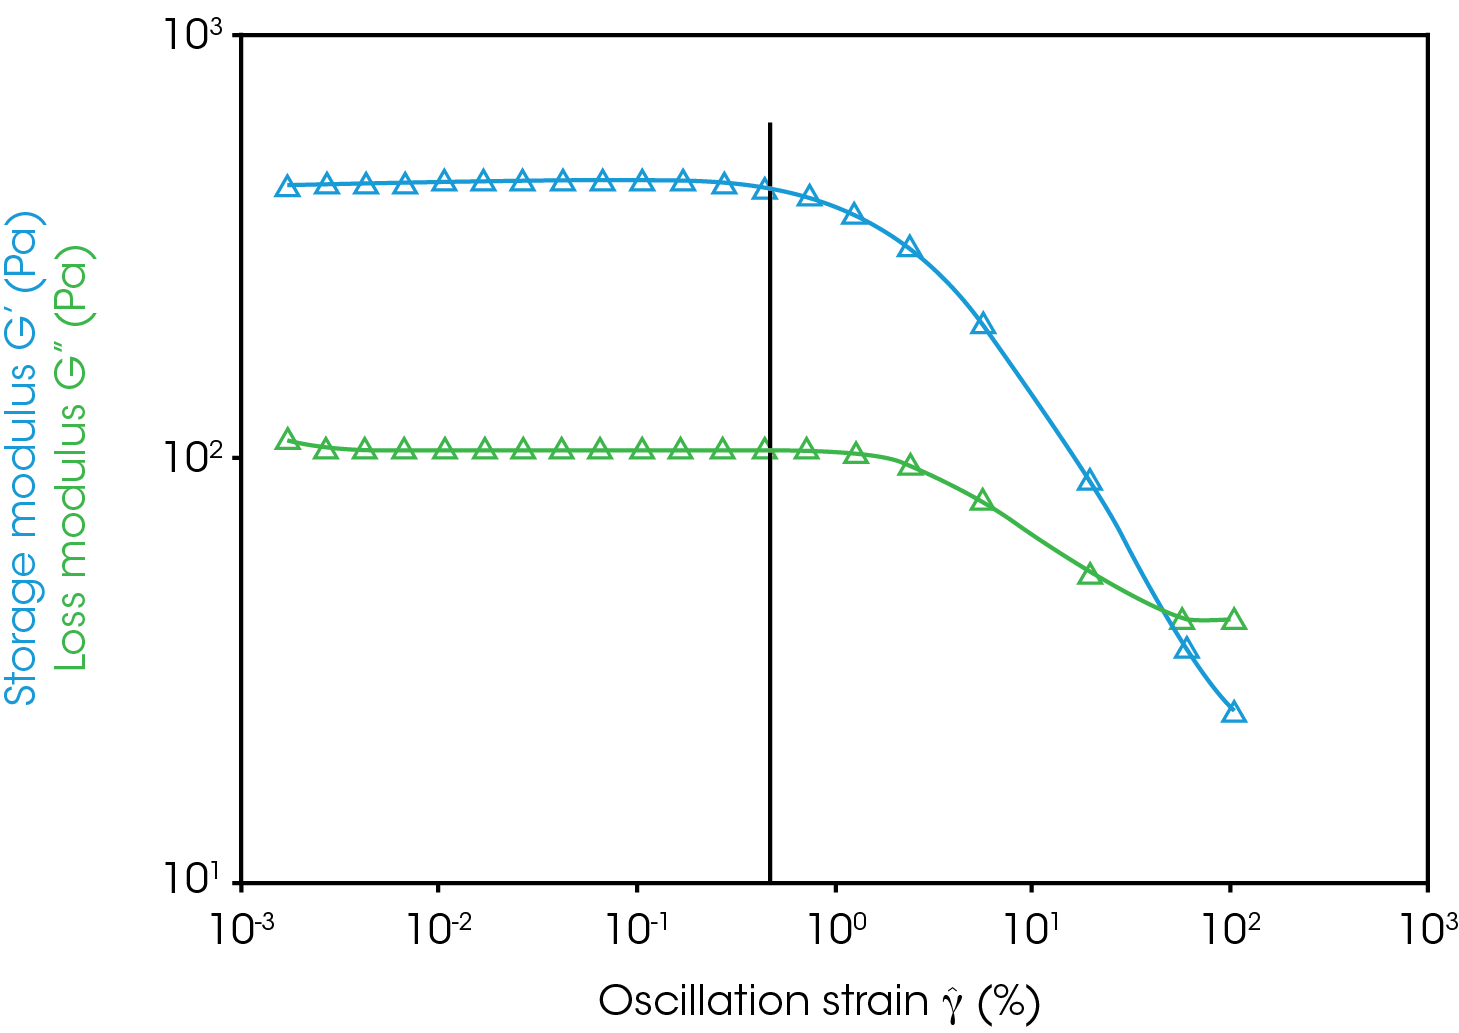
Sample structure is not broken down by small oscillations as long as the oscillation amplitude is within the linear viscoelastic region. To determine an appropriately small strain [3], a strain sweep may be performed as shown in Figure 6. Structure is related to the storage modulus and at amplitudes higher than 0.5% strain, the storage modulus decreases with increasing strain. Here, a strain of 0.5% would be considered the critical strain and the end of the linear viscoelastic region. The storage and loss moduli are independent of the strain up to the critical strain. The critical strain depends on the oscillation frequency, or how fast the sample is sheared back and forth, as well as the temperature of the sample. Higher frequencies and lower temperatures result in a shorter linear region and lower critical strain. The amplitude sweep also shows that the storage modulus is much higher than the loss modulus at 4 °C and 1 Hz. Under these conditions, the sample retains most of its shape.
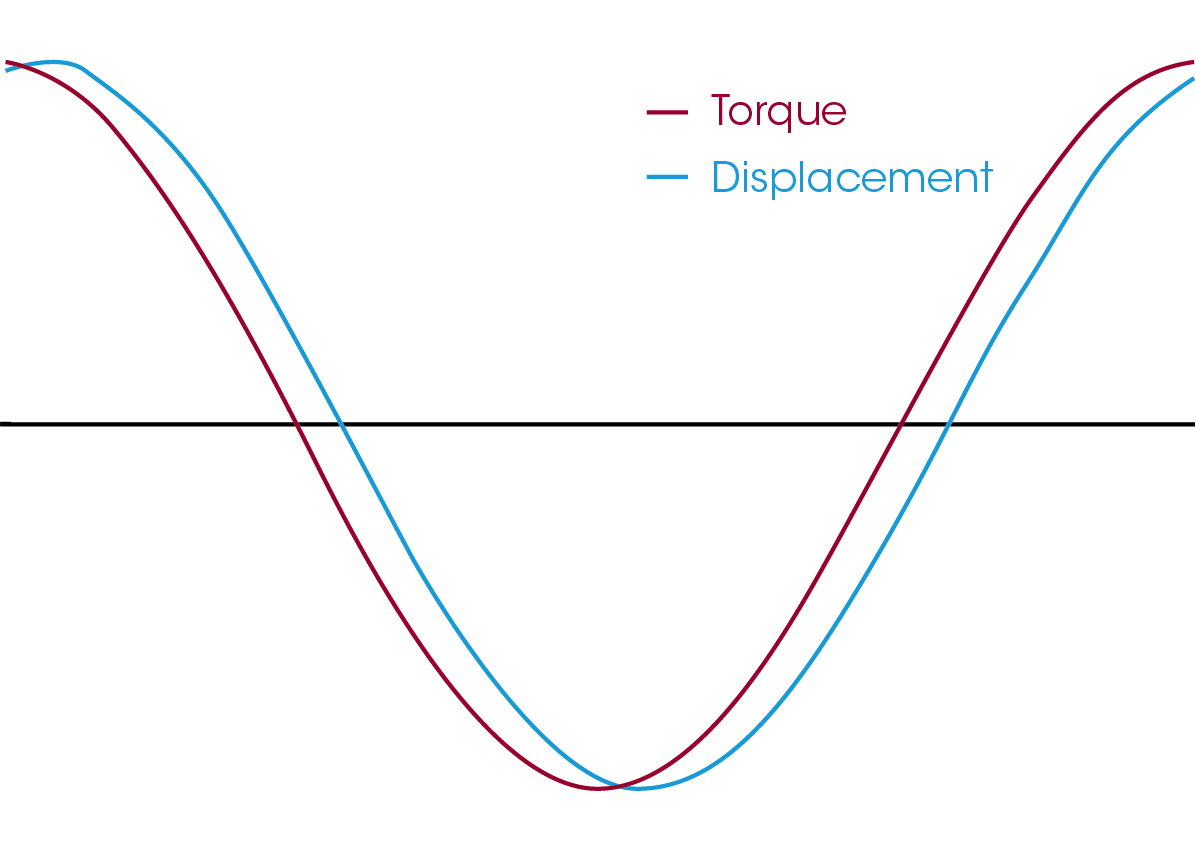
Identifying the linear viscoelastic region is important for selecting a strain that will not destroy the sample during a frequency sweep. While the sample will not be damaged below a critical strain, the signal to noise ratio is another important concern. The selected strain must also be high enough to generate good signal to noise in the torque/displacement curves. The raw displacement and torque signal can be viewed for each point with the point display available in TRIOS. A strain of 0.1% is shown in Figure 7, where the signal to noise ratio is a good example. The strain is sufficiently low that small changes in frequencies or temperature will not push the measurement outside of the linear viscoelastic region.
Conclusions
The rich flow behavior of yogurt may be determined using a TA Instruments Discovery Hybrid Rheometer. The sandblasted 40 mm parallel plate may be used to prevent wall slip and avoid measurement artefacts.
Yogurt is a weakly structured viscoelastic fluid. Care should be taken to standardize loading between samples by implementing consistent preshear and recovery times. Shear history and recovery impact the status of the material and ultimately the measured values.
A standard flow sweep shows flow behavior across the range of shear rates that yogurt may experience from gravitational settling to chewing and swallowing as well as pumping, mixing, and stirring during production. Additionally, the yield stress was determined to be ~25 Pa. Yield stress is essential for increasing shelf life and preventing settling of fruit.
The linear viscoelastic region may be identified with oscillatory flow measurements. Up to the critical strain, the moduli are independent of frequency and the structure is unperturbed. Low strains with good signal to noise ratio should be selected for future experiments.
References
- Chen, T. “Rheological Techniques for Yield Stress Analysis”, TA Instruments Applications Note, https://www.tainstruments. com/pdf/literature/RH025.pdf.
- Chen, T. “Preventing Wall Slip in Rheology Experiments”, TA Instruments Applications Note, https://www.tainstruments. com/pdf/literature/RH094.pdf.
- Whitcomb, K. “Determining the Linear Viscoelastic Region in Oscillatory Measurements”, TA Instruments Applications Note, https://www.tainstruments.com/pdf/literature/RH107. pdf.
Acknowledgement
This note was written by Kevin Whitcomb, Ph.D. and Kimberly Dennis, Ph.D., Applications Scientists at TA Instruments.
Click here to download the printable version of this application note.

