Keywords: Glass Transition, DSC, Midpoint, Fictive Temperature, Iso-Enthalpic
TA443
Background
This note will discuss the available approaches for the analysis of a glass transition by Differential Scanning Calorimetry (DSC). The options for the analysis construction and the midpoint will be discussed. In addition, the iso-enthalpic analysis options will be discussed which have benefits in situations where there is an enthalpic recovery present in the material.
Glass Transition
The glass transition occurs within amorphous materials or within the amorphous phase of semicrystalline material where the material molecules change from a rigid state to a rubbery mobile state through heating. The increased mobility results in several property changes, for example, the mechanical strength reduces and the coefficient of thermal expansion and heat capacity increase. It is this increase in heat capacity that allows the characterization of the glass transition by DSC.
Analysis of the glass transition can be important for checking the operating range of a material in which the mechanical strength is retained, defining a process temperature, for example in a freeze- drying process, or for simply checking for the presence of amorphous material which may in an application be undesirable. Approaches can also be used to determine the quantity of amorphous material.
Overview of Analysis of the Glass Transition Step
In general, a glass transition will show as a step in the heat flow trace. An overshoot in the step may be observed which is generally attributed to enthalpic recovery of the material which will be discussed later.
Figure 1 shows a schematic of a glass transition. Typically, the heat flow signal will be plotted against temperature or, if it is available, the heat capacity signal may be plotted against temperature. For consistency this note will use heat flow throughout, but it should be considered that the same analysis routines are available if heat capacity is plotted.
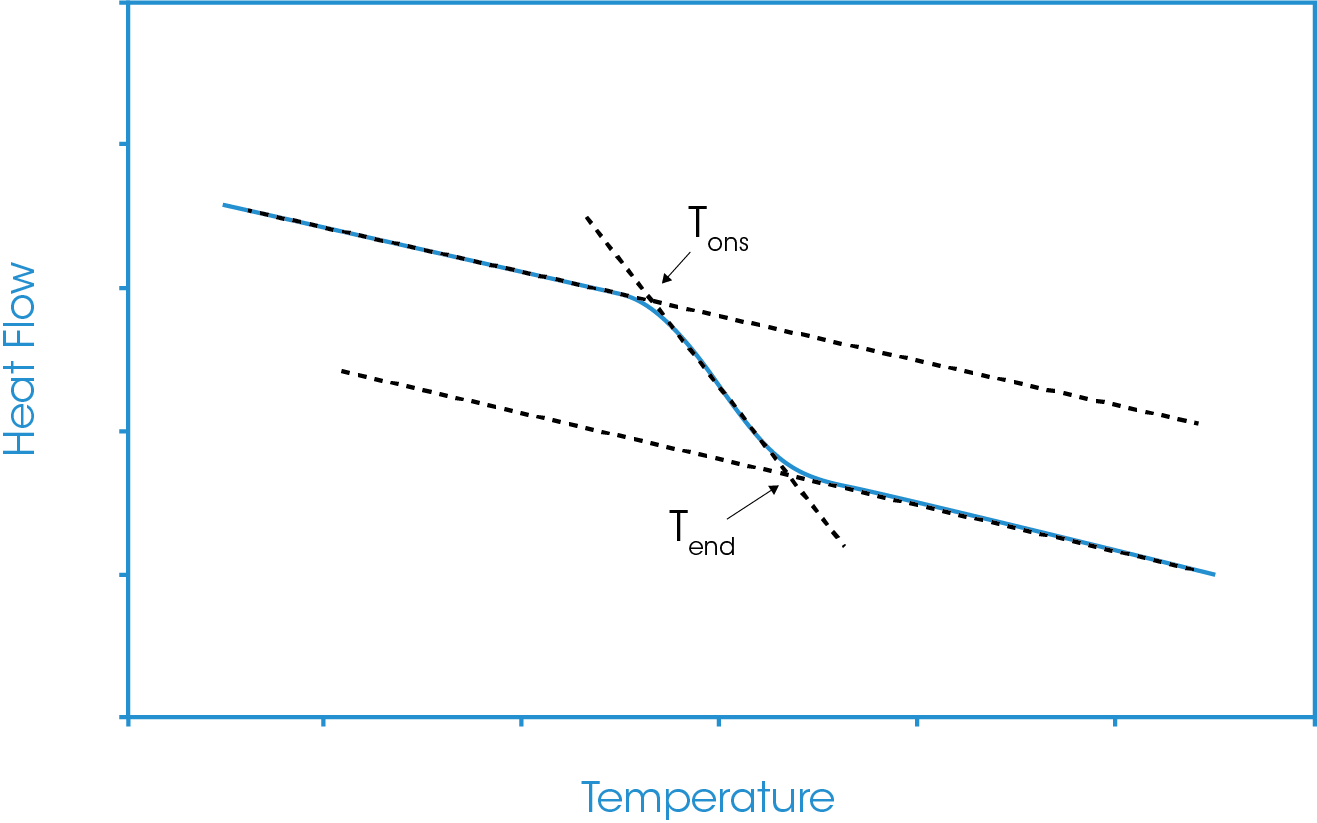
The first step for the glass transition analysis is to define the analysis constructs. The analyst will generally define two temperature points of interest, one below and one above the glass transition step. At these two points, tangents to the heat flow baseline will be defined. A third analysis construct will be defined following the step of the glass transition, either defined by a tangent or constructed through the inflection point of the step (the point of steepest slope). The tangents can be defined automatically or manually. In the automatic option one cursor is positioned and the tangent is fitted to data from that cursor point. If the manual tangent option is selected, then two cursors are used, and the tangent is fitted through those two cursors. It should be noted that the position of these constructs can have some influence on the reported data.
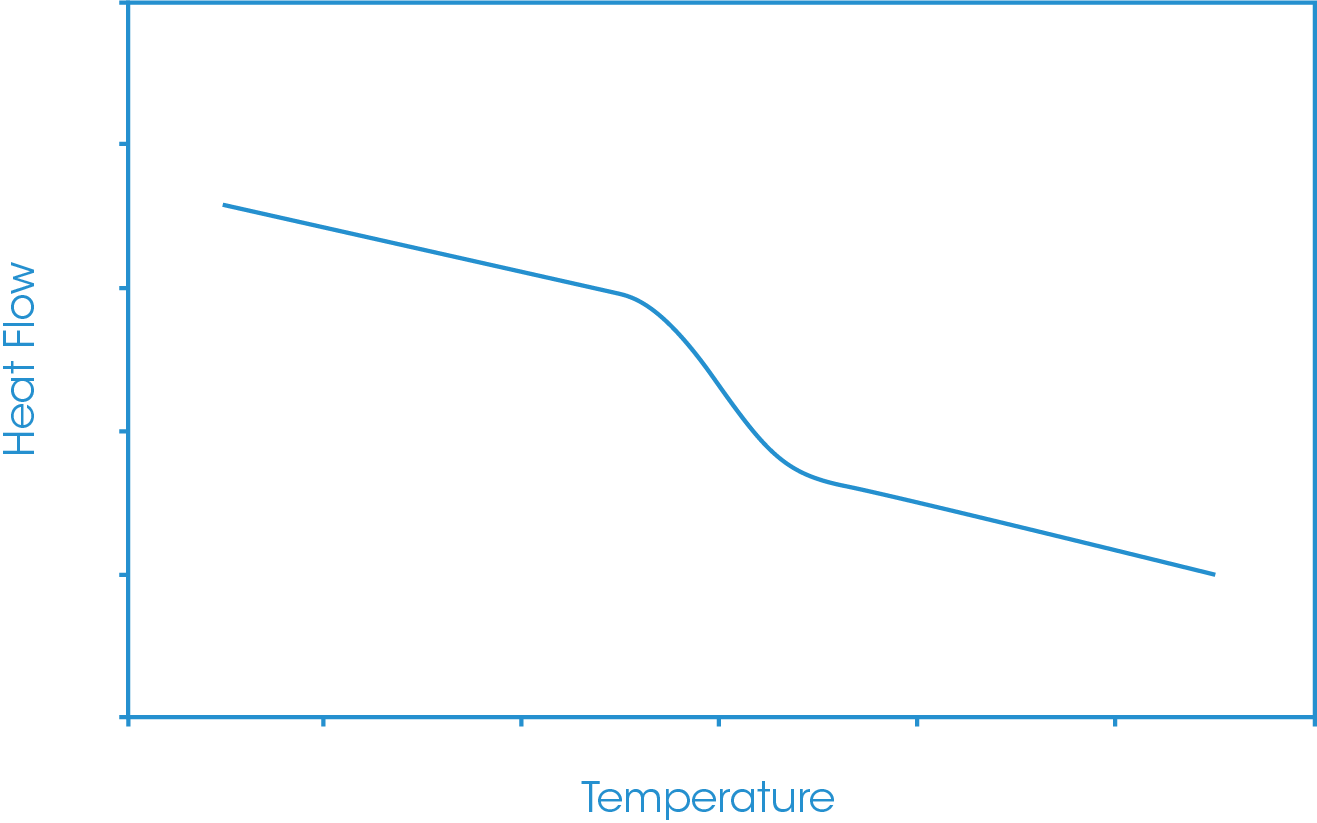
Figure 2 shows a representation of the glass transition with the three analysis construct lines present. The three analysis constructs essentially have two intersection points, these will generally be defined as the extrapolated onset and the extrapolated endset temperatures (Tons and Tend).
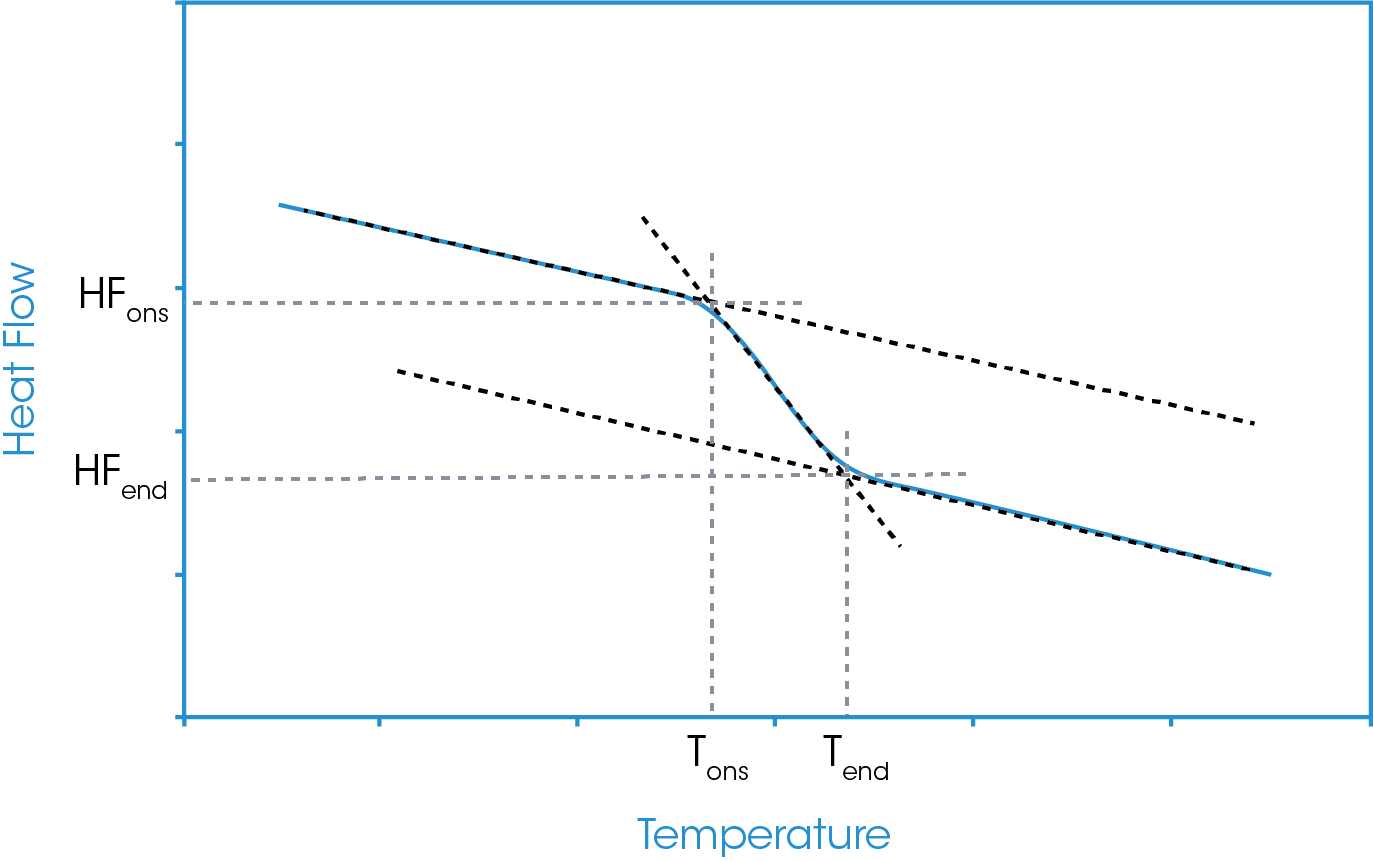
Figure 3 shows the vertical drops to these temperatures and the corresponding heat flow values at the extrapolated onset and endset values. From the defined analysis start and stop points and the extrapolated onset and endset values for both temperature and heat flow we can define our main midpoints analysis options. These are generally referred to as the inflection point, the half-height, the half-width, and the extrapolated tangents.
In addition to these four “graphical” analyses there are two enthalpic approaches to the analysis. These are the fictive temperature and the equal areas method. Both approaches define the iso-enthalpic point of the material which can be defined as the point at which the enthalpy of the glass equals that of the liquid state. These iso-enthalpic approaches are particularly useful when analyzing glass transitions showing an enthalpic recovery event, studying the effect of aging or glass formation conditions on the glass transition temperature. Theoretically the two approaches will result in the same iso-enthalpic temperature value, however, it is not unusual to see slight differences due to the construction of the tangents based on real data. For the interested reader wanting further information, references 1 & 2 provide good starting points. It is important to note that in deriving any glass transition value and comparing materials, analysis consistency is important.
Midpoint Analysis Options
In the following discussion the approach for each analysis option will be discussed individually.
Inflection Point
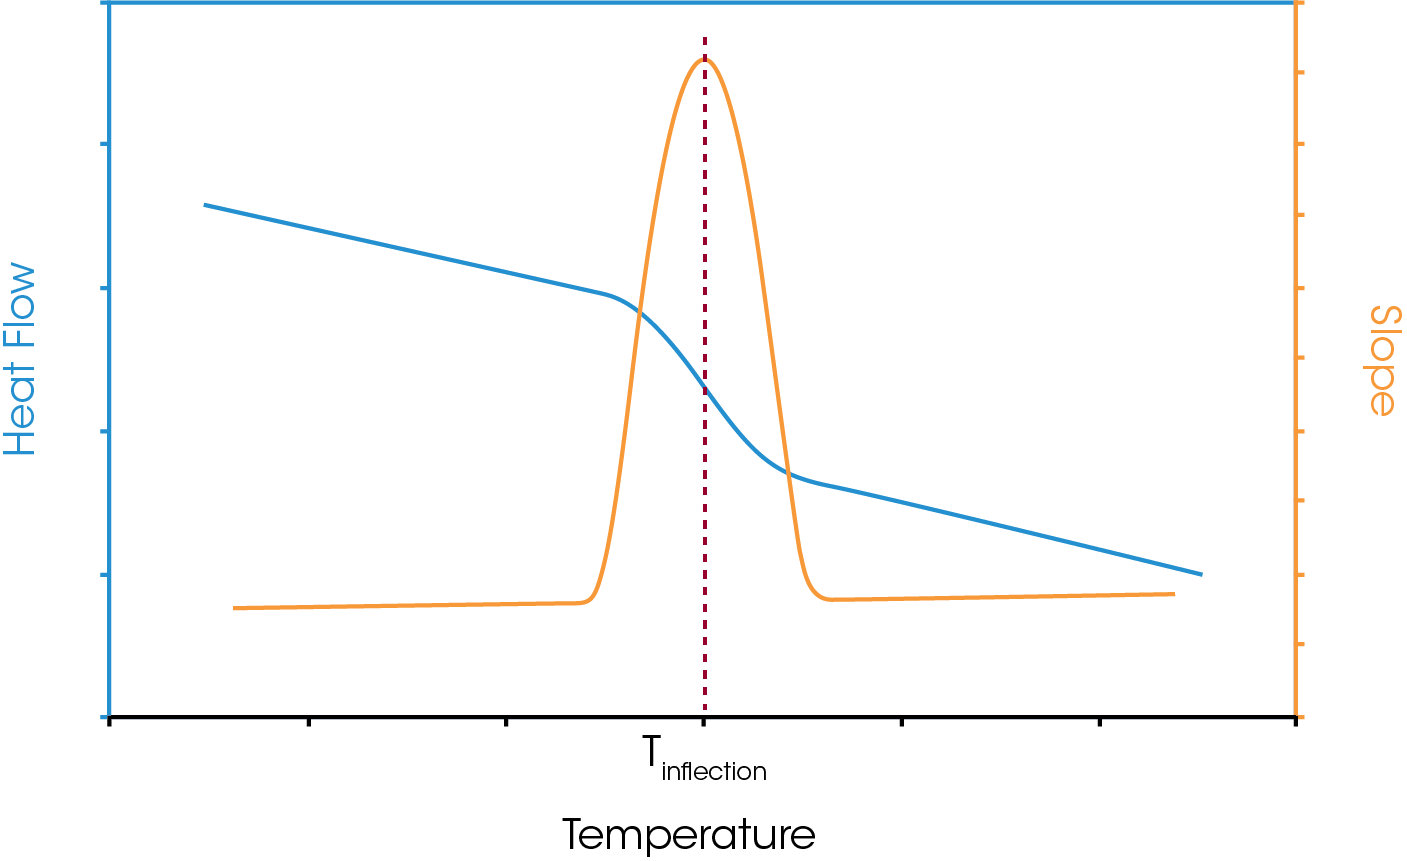
Probably the simplest analysis is the inflection point of the step. This may be defined as the steepest point of the glass transition step and is shown in Figure 4. The analyst will define analysis limits for the glass transition, and based on the width of the transition an analysis window will be defined. The slope of the data in that analysis window will be derived through a linear fit of the data. This will continue, moving the analysis window one data point at a time covering the whole region of interest. As such the steepest part of the slope may be defined.
In general, the inflection analysis lends itself well to multiple analysists since the slope analysis is a function of the data only, although the analyst should consider that the slope analysis is defined by the width of the limits chosen. However, in the event of an enthalpic recovery being present this approach should be used with caution. Since the analysis is considering the whole data set it is possible that the steepest part of the slope is offset from the true midpoint and could even be present within the enthalpic recovery peak. As such this could lead to an erroneous midpoint value.
Half-Height
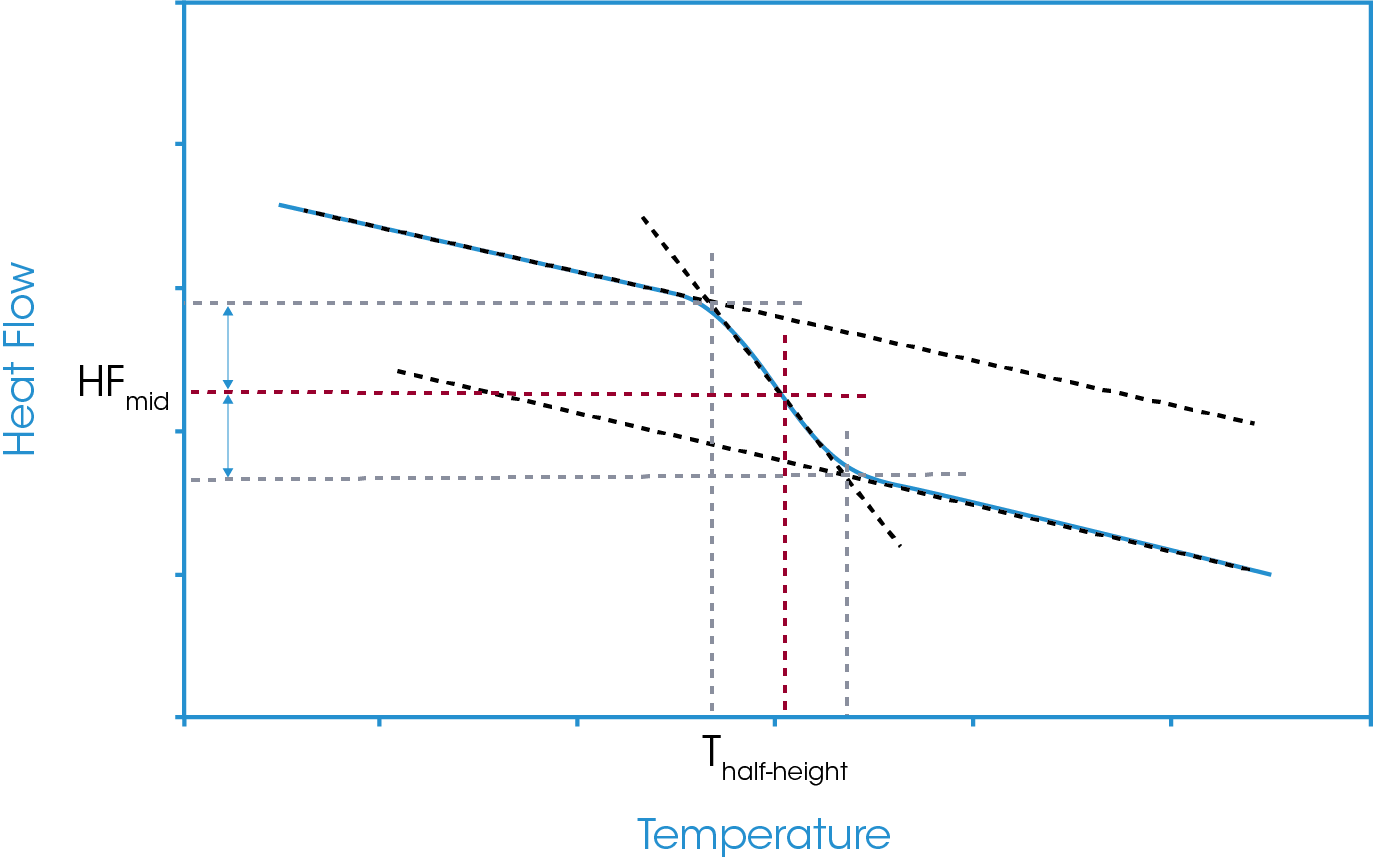
The half-height analysis takes the midpoint as the Y-axis value halfway between the calculated onset and calculated endset of the glass transition region. The temperature corresponding to that Y-axis value is reported as the glass transition. This is shown in Figure 5. Since this analysis is reliant on intersection points of the construction tangents changes to the tangents will change the reported value.
Half-Width
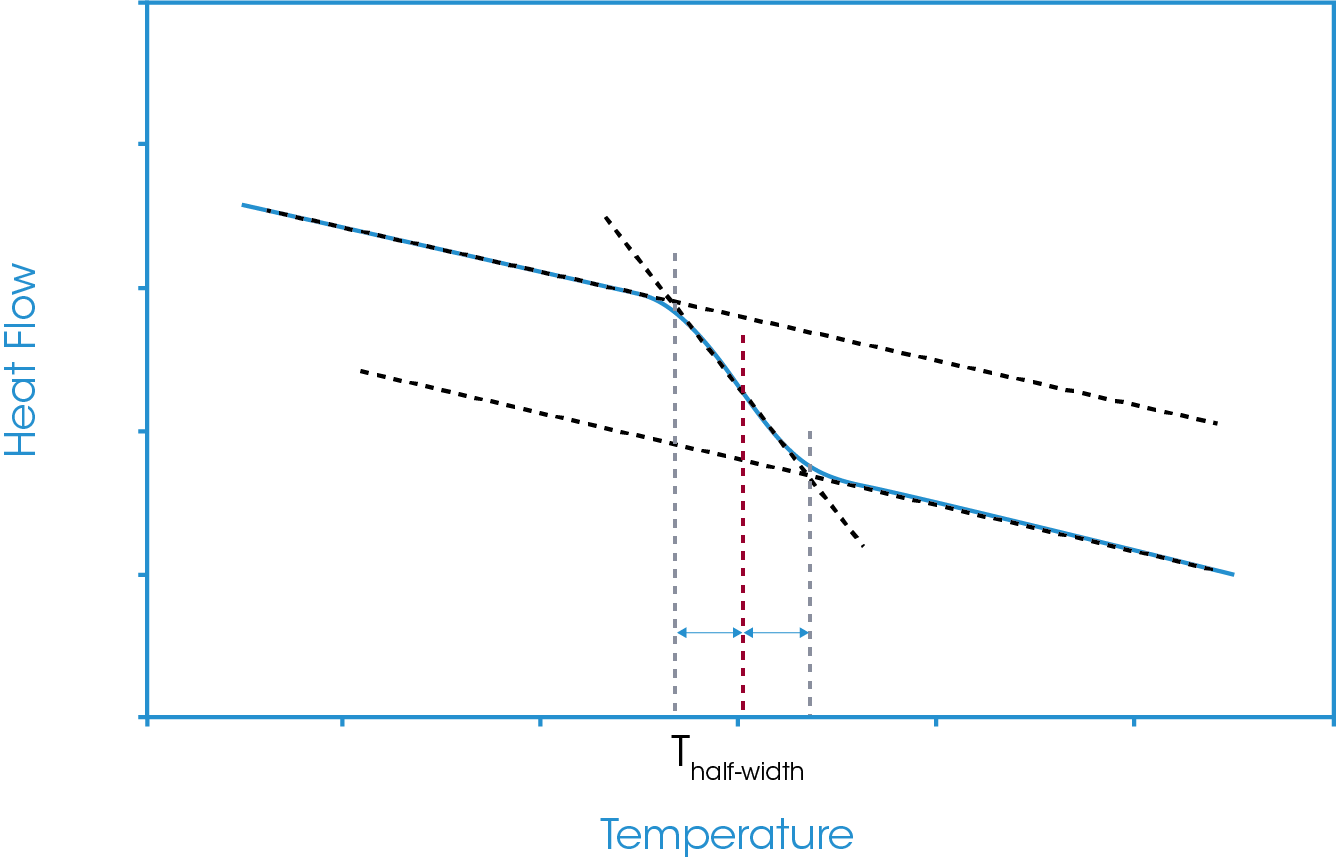
The half-width analysis takes the midpoint as the X-axis value halfway between the calculated onset and calculated endset of the glass transition region. This is shown in Figure 6. As with the half-height analysis, since this analysis is reliant on intersection points of the construction tangents changes to the tangents will change the reported value.
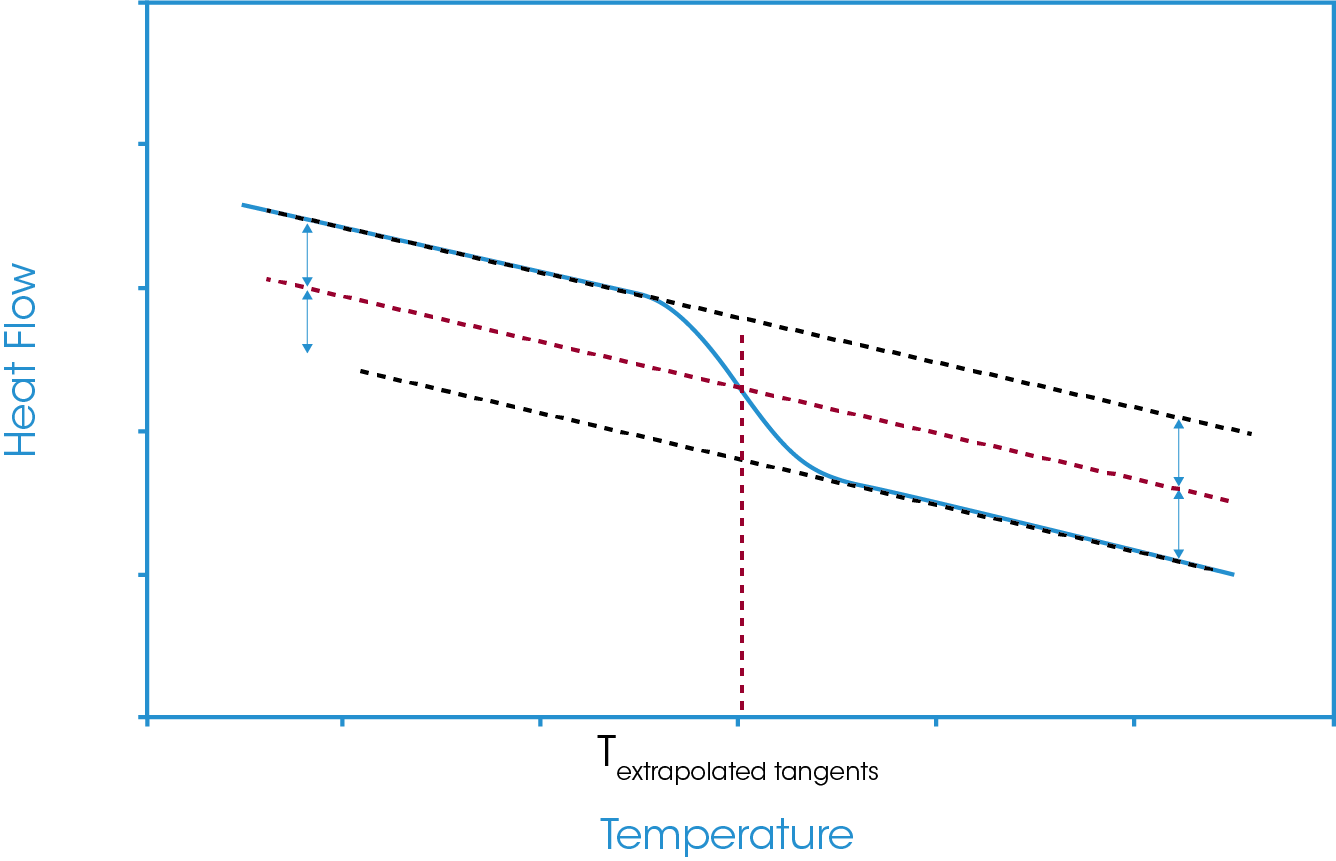
Half Extrapolated Tangents
A construction line is generated midway between the defined tangents below and above the glass transition. The intersection of this construction line with the data is taken as the midpoint value. This is shown in Figure 7.
Iso-Enthalpic Analysis Options
As mentioned, there are two general approaches for the analysis of the iso-enthalpic point, the fictive temperature, and the equal areas method.
Fictive Temperature Analysis
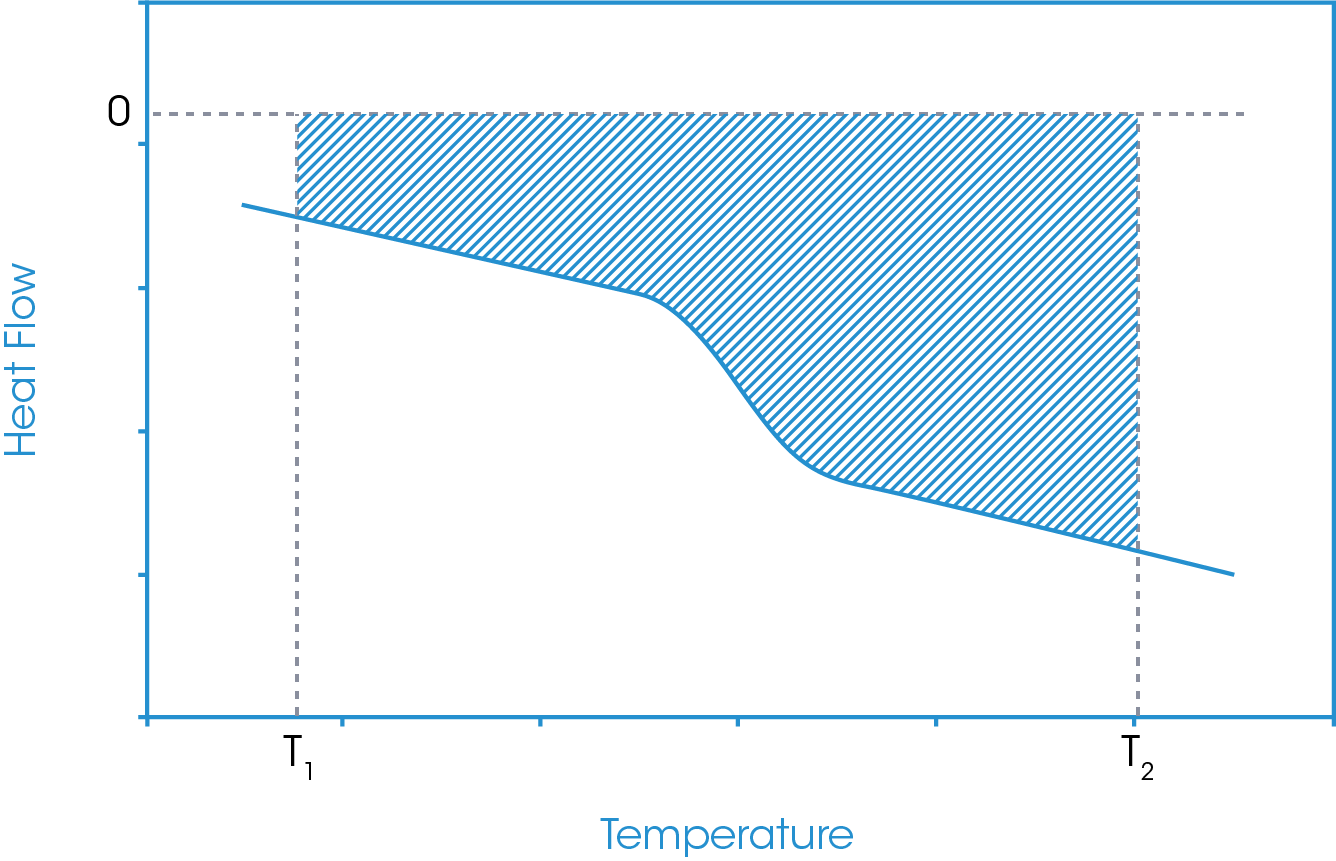
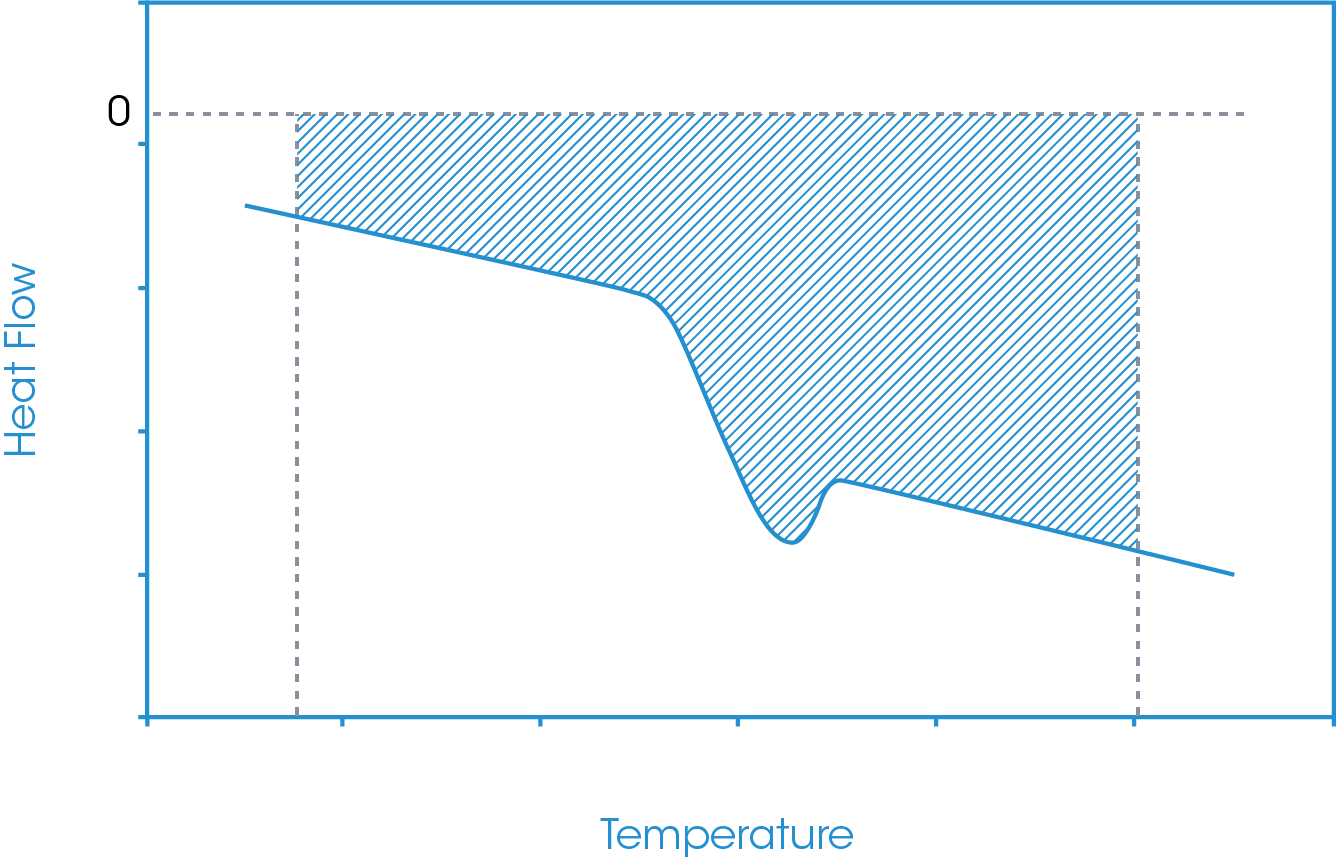
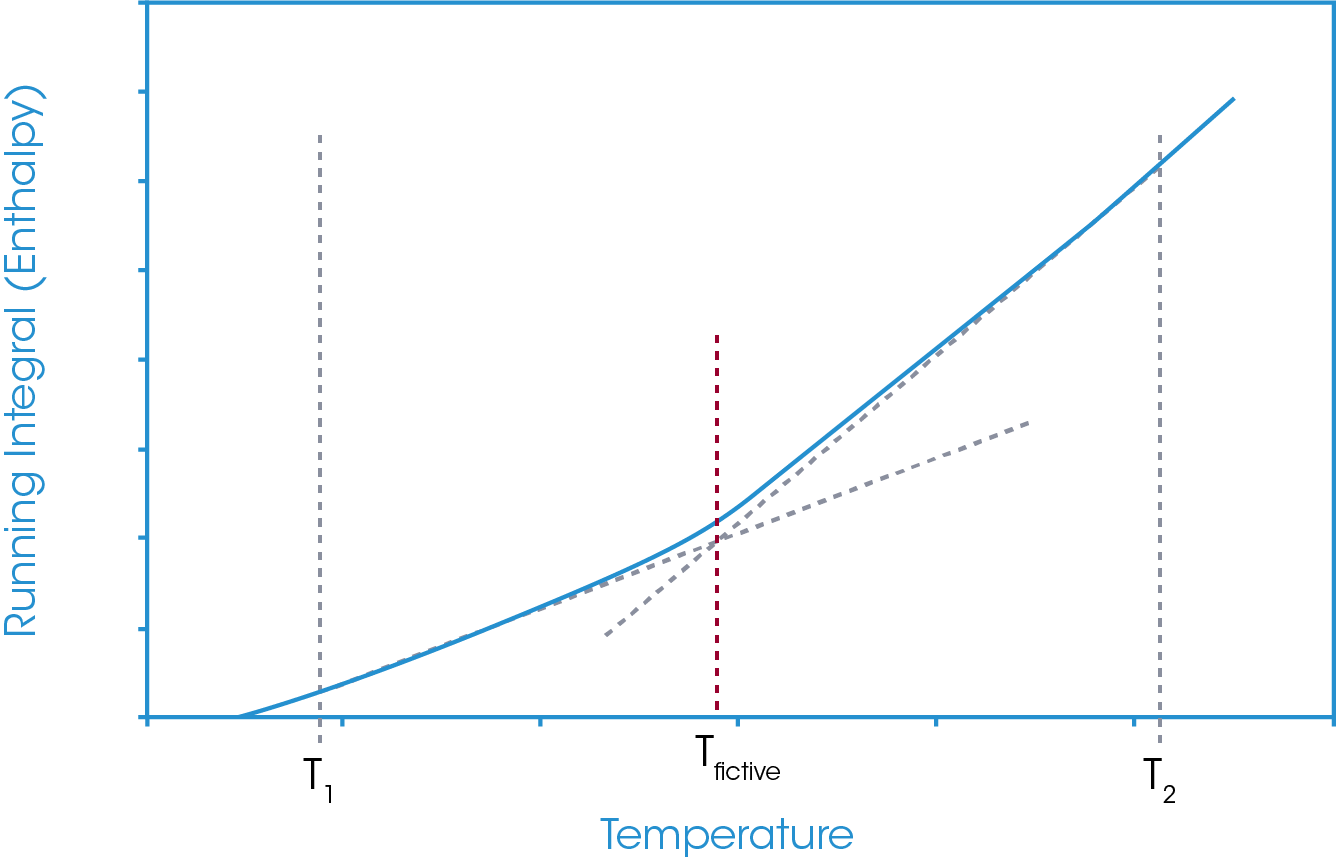
In this approach, temperature limits are defined below and above the glass transition region and an absolute running integral is carried out. The absolute running integral is taken as the total area bounded by the sample heat flow and zero heat flow between the defined temperature limits. An example of this is shown in Figure 8.
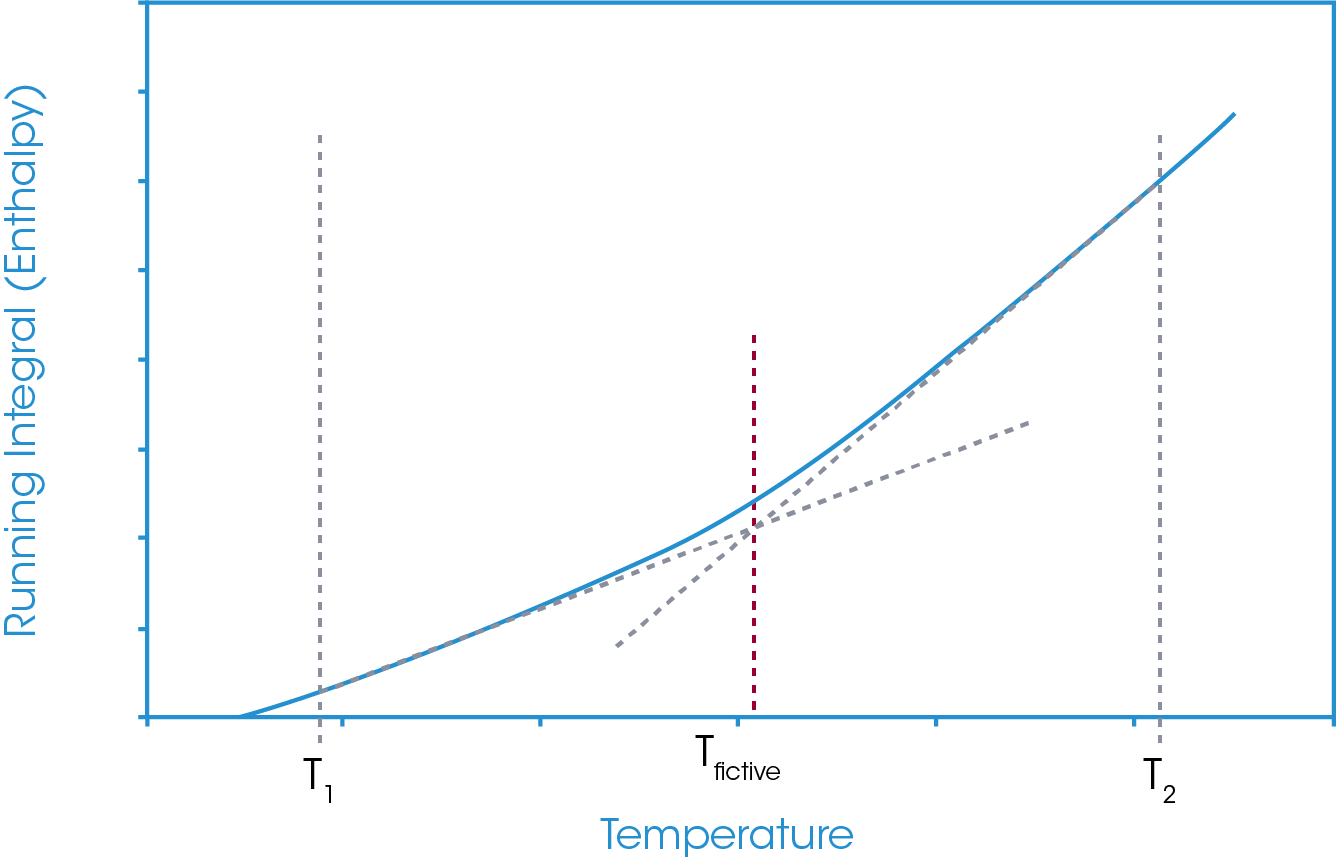
This running integral results in a relative enthalpy change plot of the sample in question between the defined temperature limits. Since material heat capacity generally increases with increasing temperature and since the increase is not generally linear (a quadratic form is more commonly used), the gradient of the relative enthalpy plot is continually changing. However, this change in gradient is generally very small. At the glass transition, where there is a step increase in the sample heat capacity there can be a notable change in the gradient of the relative enthalpy plot. Through a tangent analysis of the relative enthalpy plot the extrapolated onset of the gradient change may be derived and is defined as the fictive temperature. This is shown in Figure 9.
Equal Areas Analysis
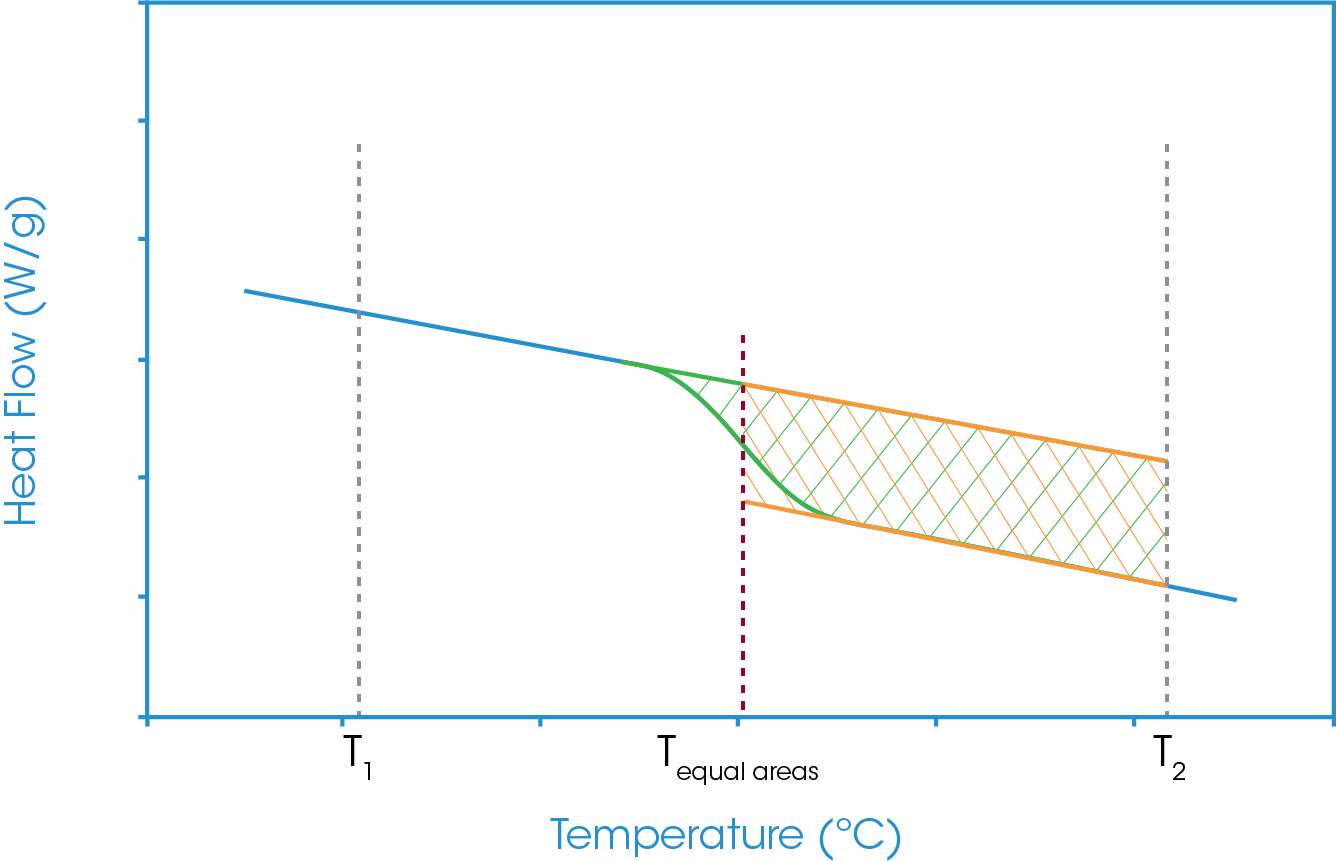
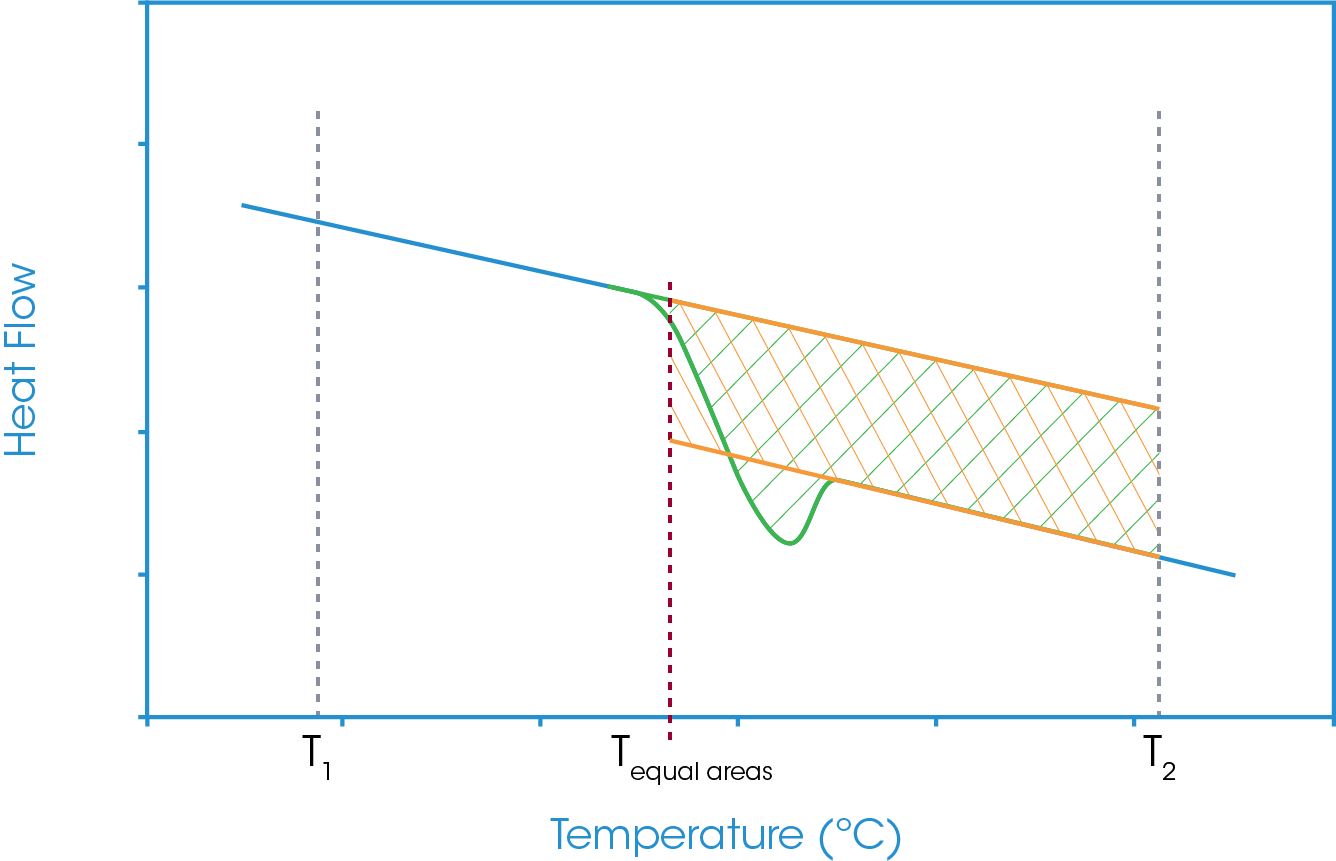
In the equal areas analysis two integral areas are considered. The first takes a tangent from the heat flow baseline below the glass transition and integrates the heat flow to a defined temperature above the glass transition. The second area takes the tangent from the heat flow baseline below the glass transition and a tangent from the heat flow baseline above the glass transition as the heat flow limits for the integration and the same temperature above the glass transition as the upper temperature limit.
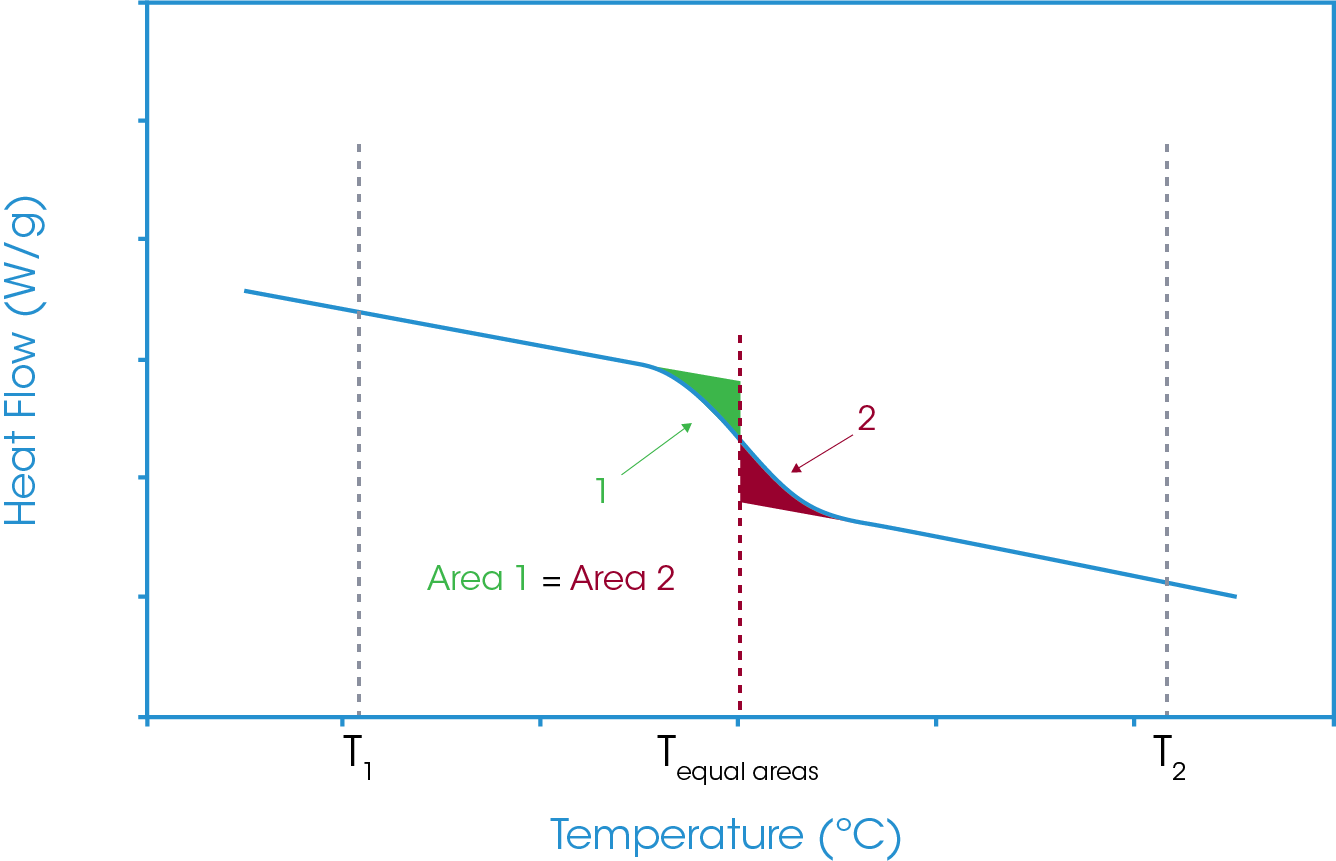
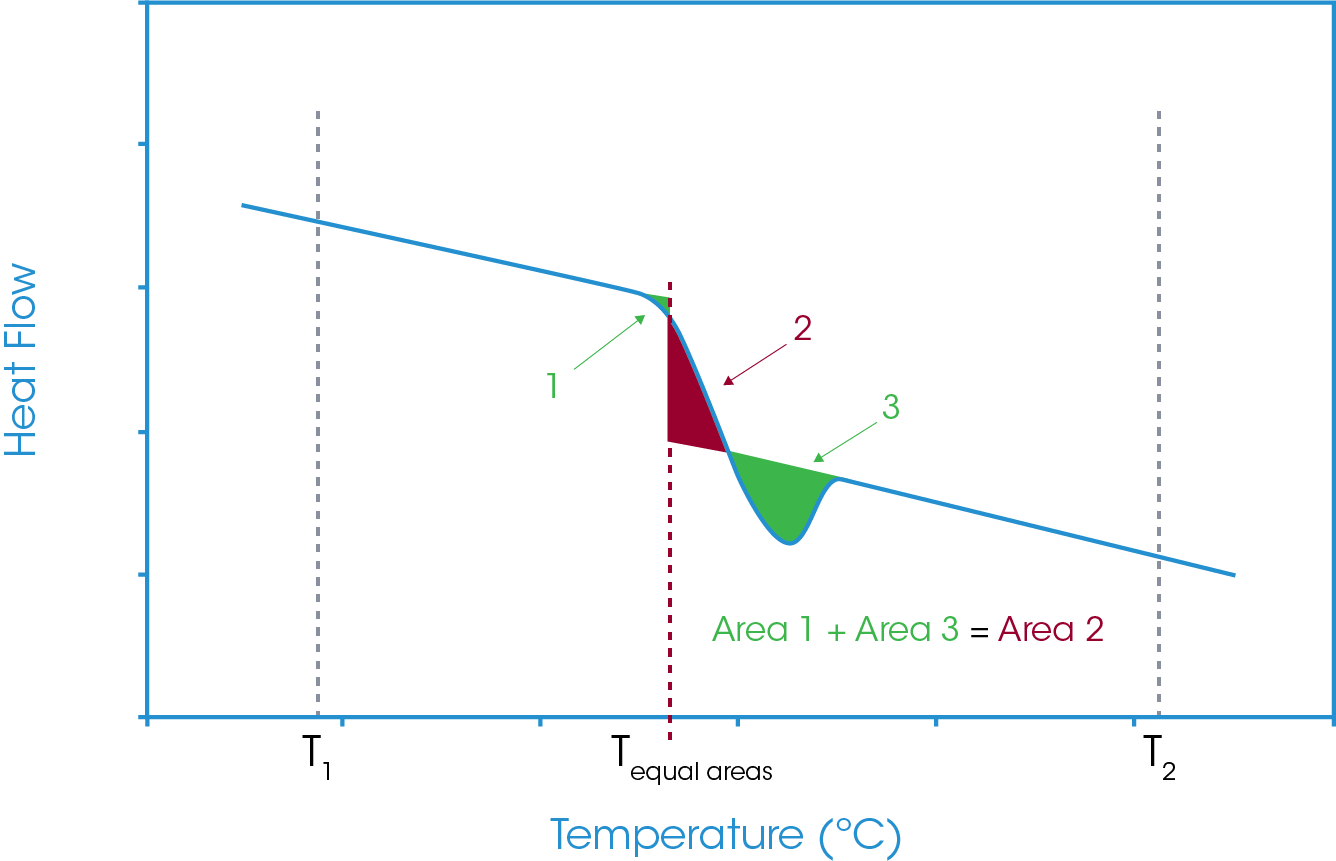
The lower temperature limit is the temperature at which the two areas are equal. That temperature is defined as the Equal Areas temperature. Figure 10 shows the schematic of that analysis. It can also be seen that there is a portion of these two areas which overlay and from a mathematical perspective cancel out. As such the analysis can be simplified to exclude that area of commonality, and this is shown in Figure 11. In essence the equal areas temperature is the temperature at which the area above the glass transition step equals the area below the glass transition step.
TA Instruments data acquisition and analysis package TRIOS does not require the user to make these integrations, they are carried out automatically based on the analysis limits chosen.
Glass Transitions with Enthalpic Recovery
The presence of an enthalpic recovery endotherm with the glass transition can complicate the analysis of the glass transition. Enthalpic recovery may occur due to aging of the material or even because of the experimental methodology being employed to study the material. As mentioned earlier the iso-enthalpic approaches are useful in these cases. The two iso-enthalpic approaches essentially remain the same with the exception that the enthalpic recovery endotherm is included in the analysis.
Figures 12 and 13 show the fictive temperature analysis approach. The enthalpic recovery can be seen in the absolute integral but since the tangent analysis for the onset is taken from the region outside this transition range the enthalpic recovery does not affect the onset analysis. Is it worth noting however, that in the event of aging there is generally a reduction in the glass transition and this will be detected by the analysis.
With the equal areas analysis, again, the same approach is used as for a standard glass transition and integral areas are considered. The first takes a tangent from the heat flow baseline below the glass transition and integrates the heat flow to a defined temperature above the glass transition. However, in this case, this integration will include the enthalpic recovery peak. The second area analysis is the same as for a simple glass transition step in that it takes the tangents from the heat flow baseline below and above the glass transition and the same defined upper temperature limit. This area will exclude the enthalpic recovery peak. As before the lower temperature limit is the temperature at which the two areas are equal. The full analysis is shown in Figure 14. Again, it is noted that there is a common area and if this common area is excluded then the equal areas analysis becomes the comparison of the three areas shown in Figure 15.
Summary
This application note has provided an overview of the reporting options for a glass transition by differential scanning calorimetry. The four mid-point analysis options and the two iso-enthalpic analysis options have been discussed. In idealized data it might be expected that all options would yield the same result, however, it is worth noting that in real data and/or in the presence of an enthalpic recovery peak subtle differences in the reported values are likely to be observed. It is important therefore that when analyzing a glass transition and comparing data the methodology and analysis used is consistent. If a standard test procedure is being followed that may provide recommendations as to the approach that should be used. Alternatively, the analyst must use their own judgement to decide on the best approach.
References
- Jean Marc Saiter et al. Macromol. Symp. (2007), 258, 152–161
- John M. Hutchinson, J. Therm. Anal. Calorim. (2009), 98, 579–589
Click here to download the printable version of this application note.

