Keywords: DMA, Thermal, Rheology, Glass Transition, Tg
RH100
Background
Transitions in polymeric materials provide invaluable information about the material. This information is often used for quality control, predicting product performance, and informing processing conditions or heat history. When heating a polymer from the glassy state it transitions from a hard and brittle material to a softer rubbery material with more viscous properties. This is the glass transition. Think of polycarbonate, polyethylene terephthalate, or polyvinyl chloride polymers for examples of a glassy polymer at room temperature. These would be everyday materials such as a plastic suitcase exterior, water bottle, or piping. Polypropylene, polyethylene, and many rubber polymers are good examples of materials in the rubbery state at room temperature and these materials are commonly found in squeeze bottles, tubing, and (obviously) rubber. The glass transition is heavily influenced by such factors as the crystallinity of the polymer, crosslinking, and plasticizers. The glass transition’s sensitivity to these factors makes it an ideal parameter to quantify for quality control purposes and to see the influence of these factors on the performance and processing of polymers. This note will detail the use of dynamic mechanical analysis (DMA) and rheology to characterize the glass transition of a polymeric material.
Glass Transitions
The glass transition occurs over a range of temperatures and is not a point or single temperature. It is helpful to define unambiguous points within the transition region to characterize the glass transition which we will refer to as Tg. Often the glass transition is reported as a single temperature but the details of how it was determined are needed to make any quantitative comparison of two materials.
The glass transition temperature depends on the polymer but is heavily influenced by many factors that will be discussed in the applications section. Dynamic mechanical analysis (DMA) is one analytical technique to determine Tg. The common experiment to determine Tg via DMA is to ramp the temperature of a specimen while applying a small-amplitude linear oscillation to measure the dynamic moduli E’, E”, and tan(δ). Similar experiments are performed on a rheometer, typically in parallel plate or torsional mode in shear deformation, which will provide G’, G”, and tan(δ). The method of determining the glass transition points is identical for either extensional or shear deformation and should yield identical results in isotropic materials. Materials that are anisotropic may exhibit differences in the measured Tg depending on the direction or type of deformation. The measured Tg is sensitive to the frequency of the oscillation but independent of the amplitude within a small region that is easily achievable.
The Tg can also be measured by other techniques, such as differential scanning calorimetry (DSC) and thermomechanical analysis (TMA), but are beyond the scope for this note. Rheological and DMA techniques are particularly sensitive to the glass transition compared to DSC and TMA. A transition that can be difficult to detect via DSC and TMA is often more easily analyzed via the methods detailed below.
There are three ways to measure or describe the glass transition temperature using rheological methods and DMA: the onset of E’/G’; taking the peak value of E”/G”, and the peak value of tan(δ). The detailed analysis methods are discussed below.
Glass Transition from the Storage Modulus
The glass transition from the storage modulus onset is typically the lowest Tg measured by DMA and rheological methods. This method is a good indicator of when the mechanical strength of the material begins to fail at higher temperatures and is particularly useful for determining the useable range for a load bearing element.
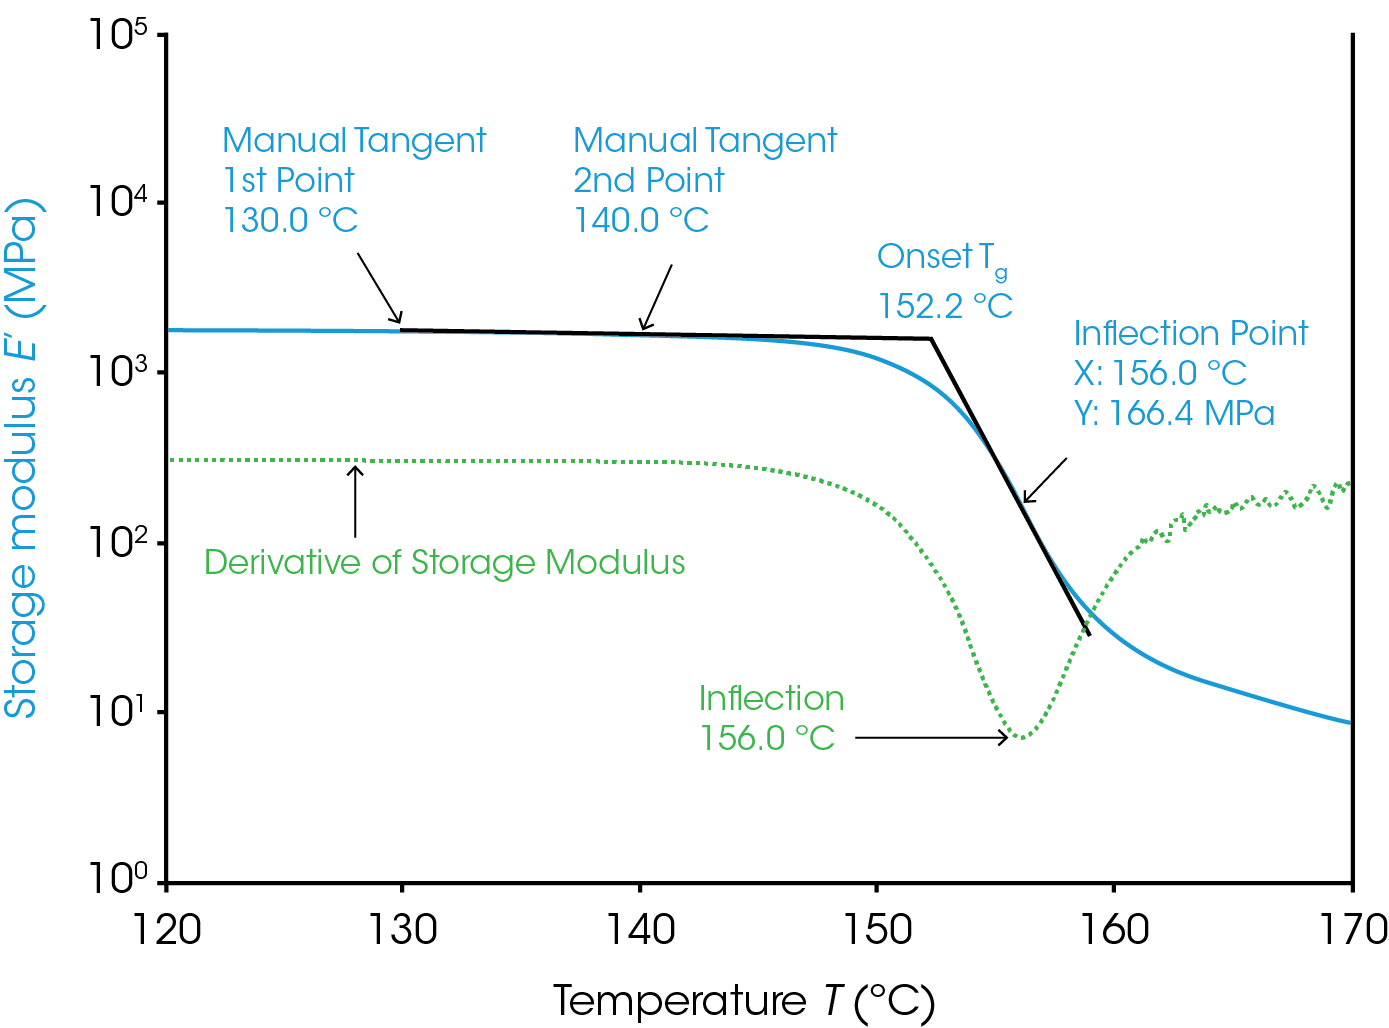
The determination of this point requires some consideration that will be discussed here. The Tg from the loss modulus and tan(δ) require much less consideration and are covered later. Conceptually the method is simple. The general method is to calculate the intercept from two lines; one from the glassy plateau of the storage modulus and the other after the sudden drop of the storage modulus in the transition region (Figure 1). There are several different mathematical ways to construct the tangent and calculate the intercept. The mathematical method chosen can change the value of Tg determined. The multiple methods to draw these tangents are why the onset Tg requires more consideration than the Tg from the loss modulus or tan(δ) signal.
An example using a “manual tangent” and “inflection” methods for the “onset” and “transition” parameters in TRIOS is shown in Figure 1. This analysis is similar to some ASTM methods (D 7028 – 07, E 1640 – 04) for the onset Tg. A tangent can be determined in two ways; a fit between two points or one point and the slope at that point. The manual tangent method has the user select two points manually and a line is fit to the data between them. Ideally these points would result in a fit from a consistently flat and linear region of the glassy plateau that isn’t too close to the transition region. These points are labelled in the figure as the manual tangent 1st point and manual tangent 2nd point. This is our first line. We will generate the second line from the inflection method. The inflection point is the point on the storage modulus with the highest magnitude slope in the transition region. This point is the labelled in the figure on the plot of the derivative of the storage modulus. The slope at this minimum and the point at which it occurs are used to create another line. Be aware that the analysis range must contain the minimum of the derivative for correct results. Generating quality data with a smooth derivative peak is also key to consistent results. The calculated intersection of the two lines is the onset Tg as shown.
The user can also manually select points for the glassy region and transition region or even have the lines determined by the endpoints of the analysis region using the default “tangent” selection in TRIOS. Selecting the “tangent” method will use the first 12.5% of the curve x axis to fit the first line and/or the last 12.5% to fit the second line and determine the intercept between them. This requires the least input from the user but is most subjective to the analysis region chosen.
The observed Tg from any rheological/DMA technique increases with the oscillation frequency. It is important to consider this when using the Tg measured from the storage modulus to determine the useable temperature range for a material. The material begins to soften significantly at the Tg for deformations on the timescale of 1/frequency, or 1 second for the results in Figure 1. The storage modulus will drop at higher temperatures for faster deformations and slower deformations would experience a drop in the storage modulus at cooler temperatures.
Glass Transitions from the Loss Modulus and Tan(δ)
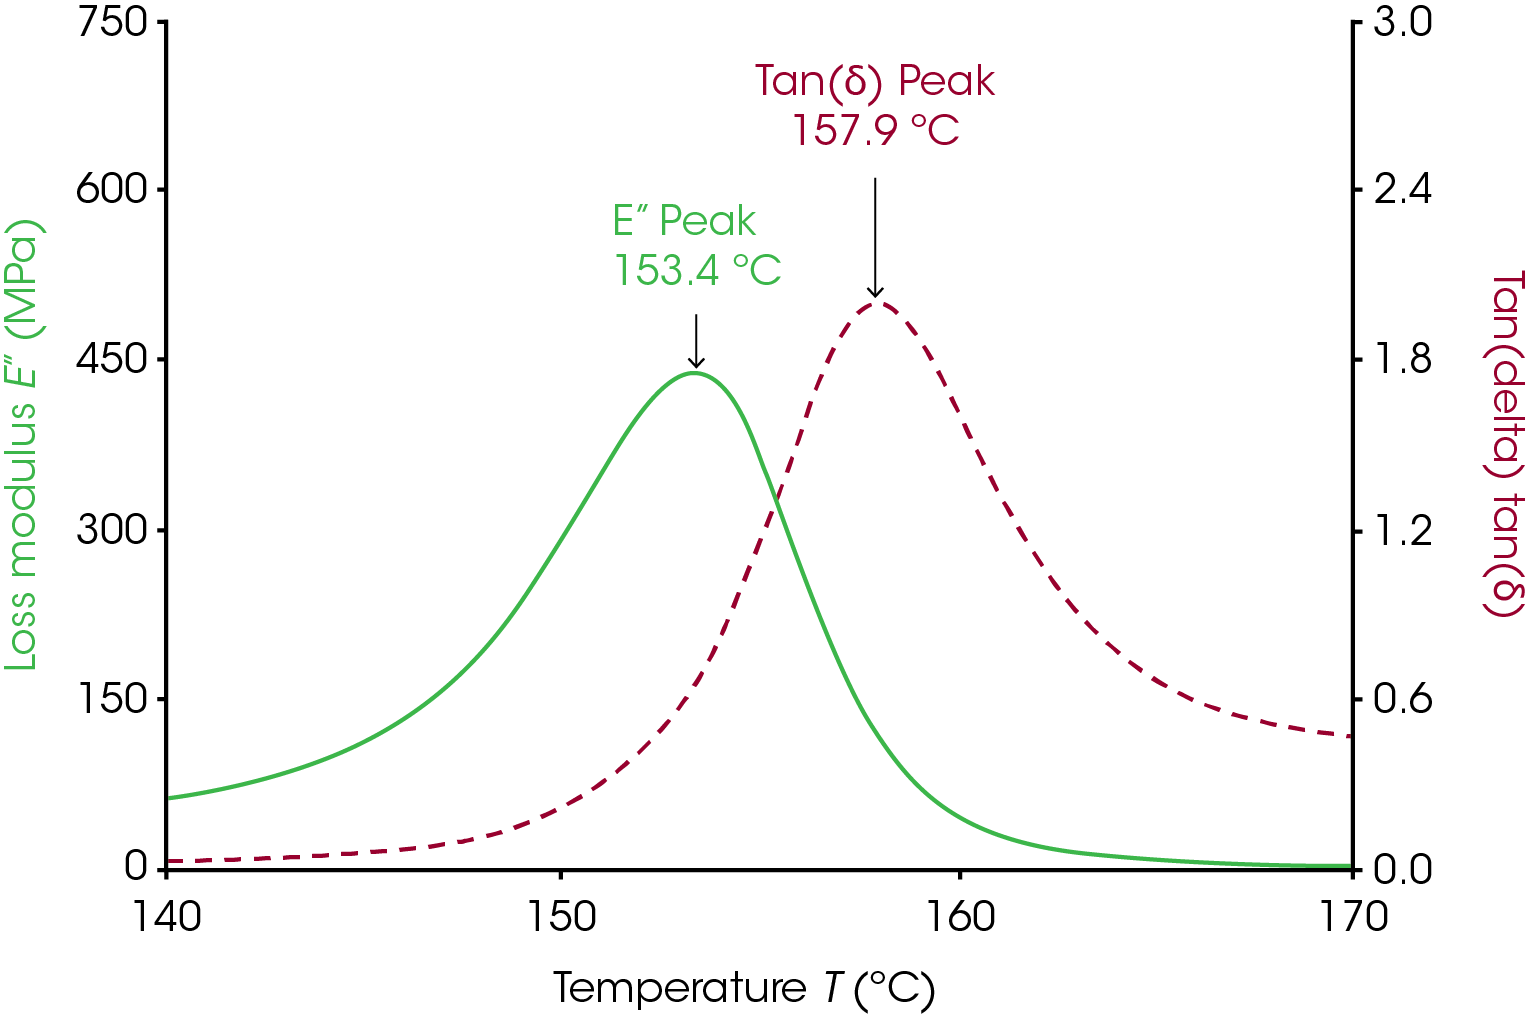
The Tg measured from the loss modulus and tan(δ) signals require much less consideration than the onset glass transition. These two signals often show a distinct peak in the transition region and the Tg measured from the loss modulus and tan(δ) are simply the temperature at the peak. The loss modulus peak occurs at a higher temperature than the Tg measured through E’/G’ onset and at a lower temperature than the tan(δ) peak. Figure 2 shows the loss modulus and tan(δ) peak for polycarbonate. These peaks can be relatively sharp and smooth so there can be less ambiguity in the Tg determined via these methods. Many additives and processes can broaden these peaks and make it difficult to determine a clear Tg from either peak, however. See the applications section for some examples where the peaks were lowered and/or broadened.
Tg measured from the loss modulus and tan(δ) are simply the temperature at the peak. The loss modulus peak occurs at a higher temperature than the Tg measured through E’/G’ onset and at a lower temperature than the tan(δ) peak. Figure 2 shows the loss modulus and tan(δ) peak for polycarbonate. These peaks are often sharp and smooth so there is very little ambiguity in the Tg determined via these methods. Many additives and processes can broaden these peaks and make it difficult to determine a clear Tg from either peak, however. See the applications section for some examples where the peaks were lowered and/or broadened.
The peak of the loss modulus has physical meaning in terms of molecular motion. As the material approaches the peak of loss modulus, the energy dissipated increases as large segments of polymer are able to move cooperatively. However, at the same time, the material is overall becoming easier to deform. The two competing effects of increasing viscous behavior with easier deformation result in the peak observed.
The tan(δ) signal is the tangent of the phase angle between the stress and strain waves in the oscillation. Mathematically it works out that this is also the ratio of the loss modulus to the storage modulus. The peak of the tan(δ) signal is the point in the transition region where the material has the most viscous response to deformation.
Experimental Considerations
The following section will give tips on obtaining reproduceable data for glass transition analysis through DMA and rheology. The first consideration is accurate temperature data. The data presented and discussed in this note are collected via a temperature ramp or sweep. Ramps are the most time efficient method to determine Tg. The temperature is increased at a constant rate while the instrument measures the viscoelastic properties of the sample. Temperature sweeps increment the temperature and equilibrate for a time typically on the order of minutes before the instrument measures the viscoelastic properties. The sweep method allows plenty of time for the sample to reach the measurement temperature and minimizes the effect of thermal lag. The user must consider thermal lag in temperature ramps, however, and be sure that the ramp rate is set such that it does not affect the result significantly. Similar samples may use similar ramp rates, but several factors may affect the suitability of a ramp rate. The size of the sample,
the thermal conductivity of the sample, the temperature control environment, and the position of the temperature sensor can affect the results of the experiment. Work has been published on these effects (ref 1) but the following section will demonstrate how to minimize them.
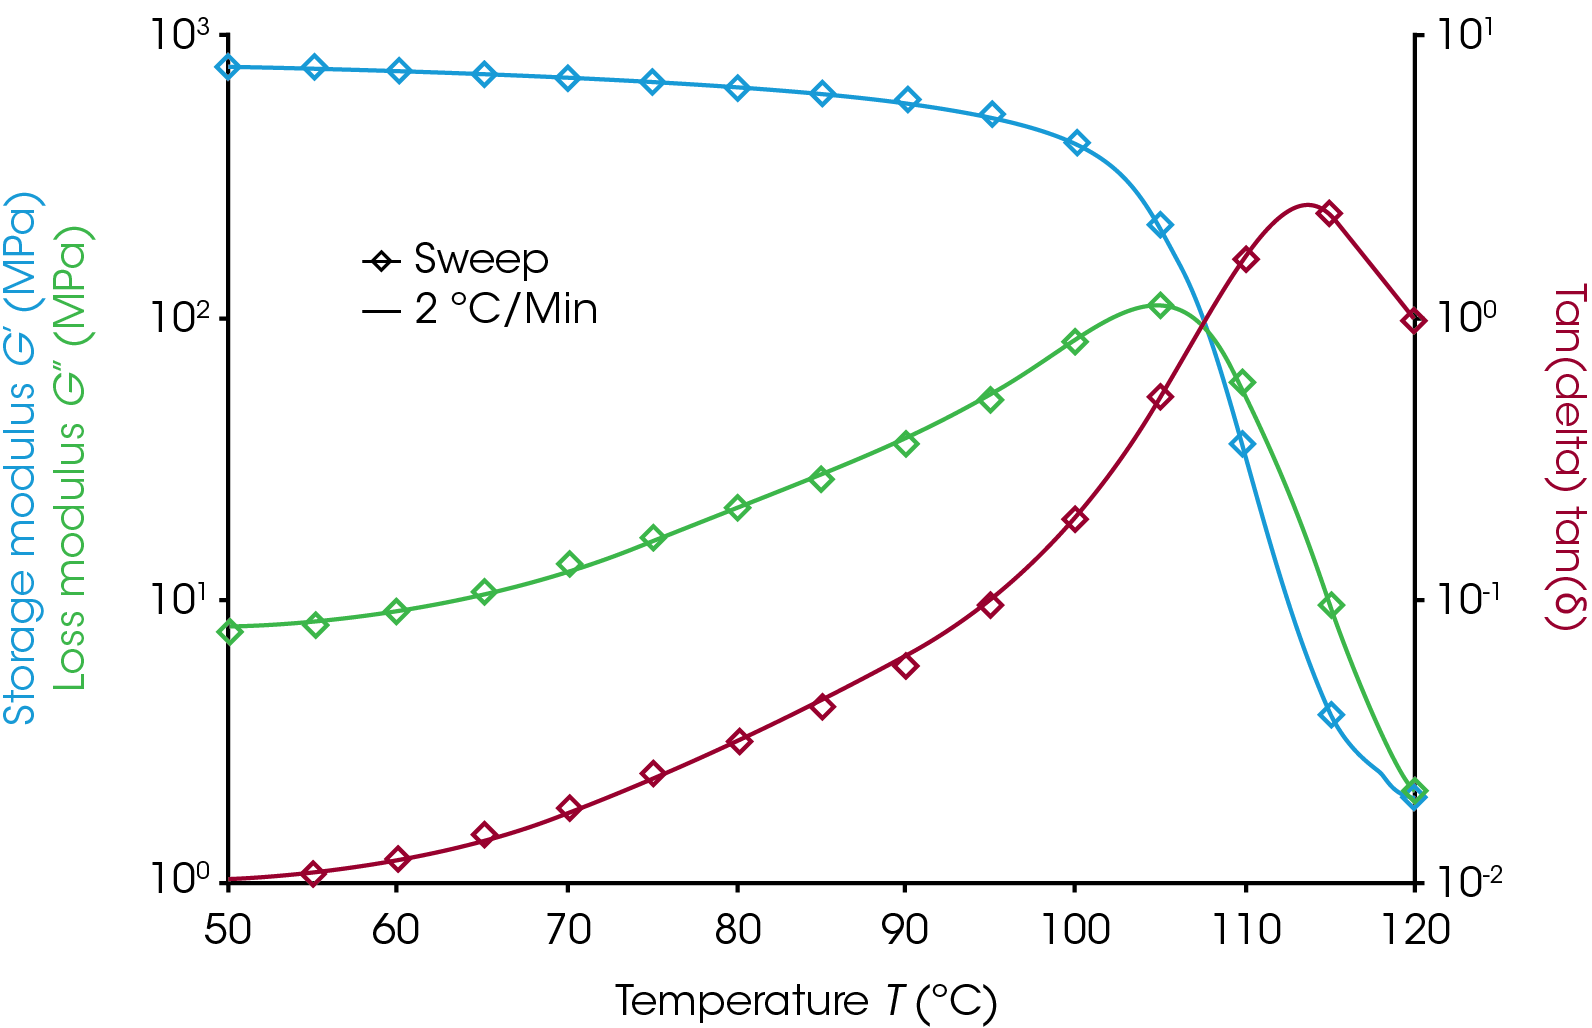
Figure 3 shows the results from a sweep and a 2 °C/min ramp. The sample used was a polymer-blend of acrylonitrile-butatdiene-styrene (ABS) that measures 12.5 mm x 3.3 mm x 60 mm in a torsion clamp on the ARES-G2 with the forced convection oven. The sweep data are spaced 5 degrees apart and are very sparse compared to the ramp data. The two experiments show very good agreement on all three signals in the transition region. This agreement demonstrates that the 2 °C/min ramp is suitable for this sample and environment. The ramp data would appear shifted to the right of the sweep data if there were noticeable thermal lag effects. It is important that this evaluation be done around the temperature of interest as there will be little effect of thermal lag near the starting temperature.
Users should check to see if their ramp rate is appropriate as part of method development by comparing ramp data to a sweep.
Larger samples may require lower ramp rates than samples made of the same material but smaller. Thin films, for example, equilibrate quickly compared to a 2 mm thick block of the same material. Thermal conductivity can also influence how far the sample is from equilibrium with the temperature sensor. More insulating materials may take longer and require lower ramp rates. The temperature control environment should also be considered when selecting a ramp rate. A ramp rate suitable for a sample in a standard oven would not be suitable in a submersion system for example. Finally, consider the position of the temperature sensor. Some systems allow the user to position the sensor to accommodate different clamps and samples. When given this option, consistently position the sensor toward the middle of the specimen and as close as is practical for the best results. Consistent positioning is key to consistent results.
Another practical concern in collecting good data for the determination of Tg is the strain and clamp type. This note will cover these concepts broadly. The strain should be selected such that it is within the linear viscoelastic region at all temperatures and frequencies used in the test. The clamp and strain should be selected such that quality data is generated well above the force/torque limits of the instrument when the sample is in the transition region but also such that clamp compliance or geometry compliance does not cause significant error. Noisy data in the transition region can generate noisy peaks and make it difficult to determine a clear maximum in the loss modulus or tan(δ) as well as difficulties determining the onset transition.
Users should also take care to make sure the sample is loaded properly for the clamp selected. If the material is twisted or makes poor contact with the clamps the data generated may not correlate with the actual transitions of the material. Often as the material softens near the transition region the sample will straighten out or establish better contact with the clamp if the sample was not loaded properly. This can result in an apparent increase in the storage modulus just before or during the transition. Flat and untwisted samples will help the user avoid such data as will appropriate force track and preload settings. Any error that affects the determination of the phase angle or tan(δ) has a high probability of causing an error in determining Tg.
The final experimental consideration we will discuss is the frequency. Typically, a frequency of either 1 Hz or 10 rad/sec is used. These frequencies allow for fast collection of data at typical ramp rates so that Tg are easily assigned. It is important to note that the Tg is frequency dependent and the user must be consistent in their choice of frequency. A fuller discussion of the effect of frequency on the Tg is the topic of another apps note (TA423).
Applications
Crystallinity
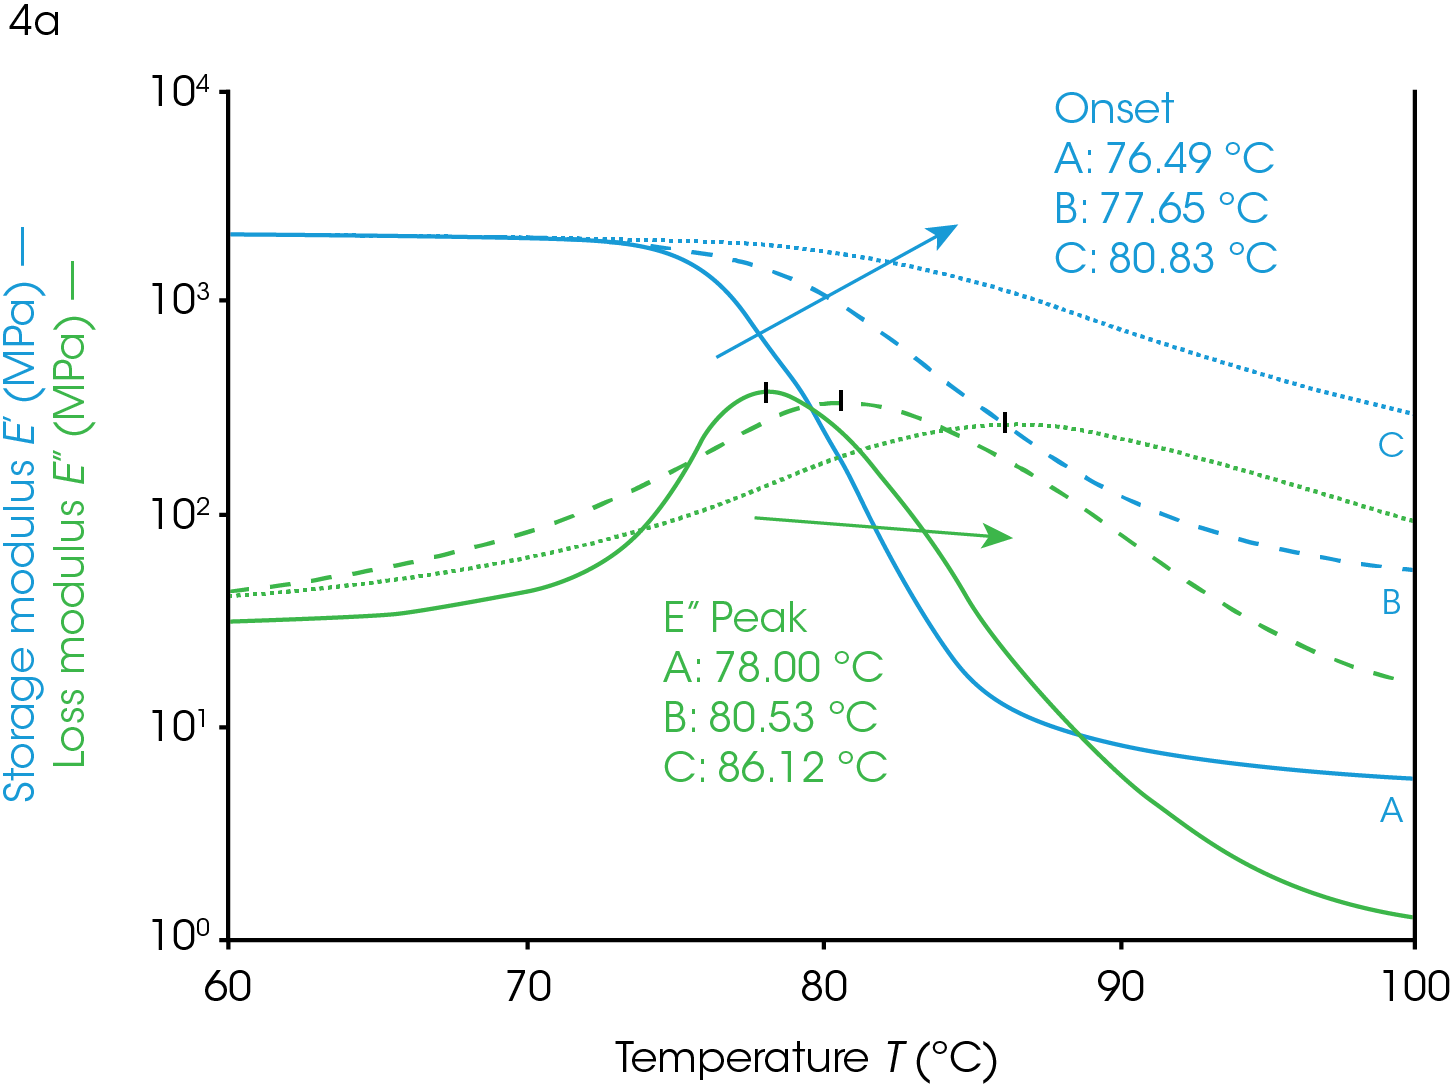
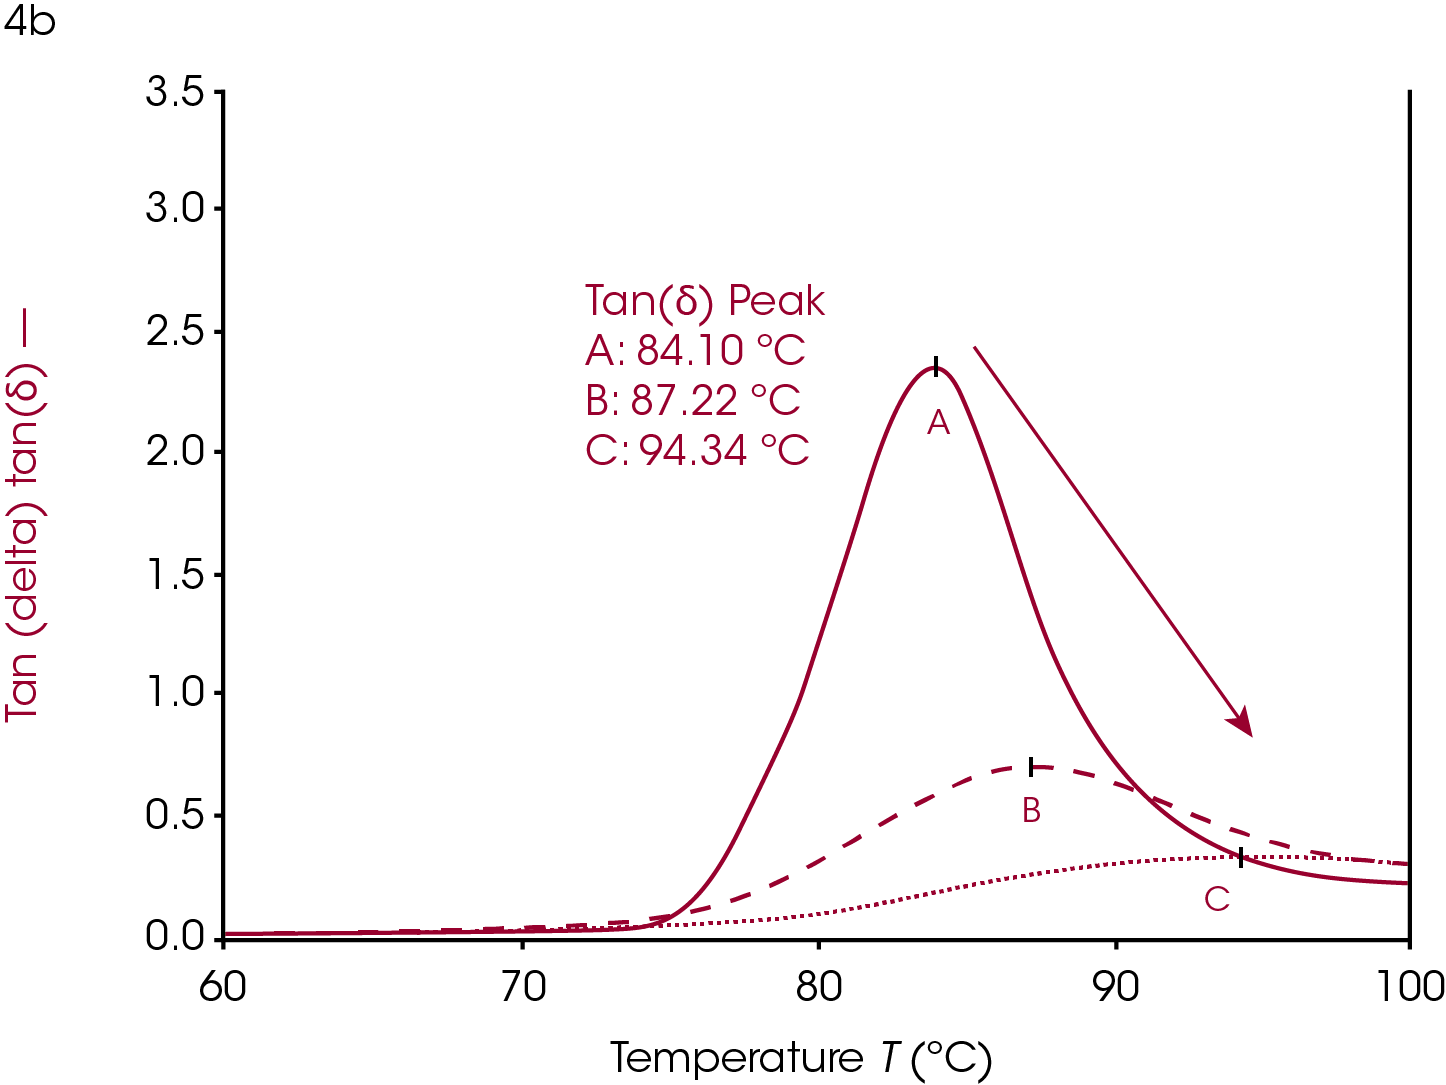
The glass transition temperature is a valuable metric in confirming the desired properties of a material including the crystallinity of a polymeric system. A crystal is a highly ordered phase of solid matter. This state can be contrasted with an amorphous solid in which the material has no long-range order but exhibits solid characteristics. Some polymers form crystalline regions under certain conditions that coexist with the amorphous phase. Polymer systems that can crystallize will likely form these phases if allowed to cool slowly. Changes in crystallinity will affect the Tg as shown in Figure 4.
The data in Figure 4 demonstrate the value of using DMA determined Tg in assessing the heat history of a PET sample used as packaging material. The crystalline portion of a sample was increased by heating the sample to 120 °C (above the Tg) and allowing the material to undergo crystallization. The polymer chains of PET have enough energy to rearrange into crystal domains at temperatures above the glass transition but below the melting temperature. This is a kinetic process so the longer the material is held at the higher temperature, the more crystalline it becomes. The kinetics depend on the polymer properties, the temperature, and additives. The material in Figure 4 is nearly completely amorphous at the start in ramp A (Figure 4). The sample in ramp B was briefly exposed to 120 °C and cooled rapidly so that it partially crystallized before the temp ramp shown. The sample in ramp C was allowed to soak at 120 °C and crystallize further than ramp B. With each exposure to higher temperatures the amount of crystallinity increases and the effect on the transition temperature as well as other viscoelastic properties can be observed.
Crystallinity in a polymer system has the effect of limiting the motion of the polymer backbone (ref 2). The polymer backbone is relatively frozen in the glassy state and becomes more mobile in the rubbery plateau as it is heated through the glass transition. The crystal phase locks these backbones together and has the effect of chaining multiple backbones together through intermolecular forces. The glassy plateau, already having limited motion, is affected very little by crystallization but the polymer in the rubbery plateau has more limited motion, relative to its amorphous state. Since the glass transition is due to the increased movement of the amorphous phase of a semi-crystalline polymer, the limited motion of the amorphous phase due to increased crystallinity has the effect of increasing the Tg because more thermal energy is needed for the backbone to become mobile and able to dissipate energy. The onset temperature increases, the onset modulus increases, and the rubbery plateau modulus increases as the sample becomes more crystalline. The loss modulus peak shifts to higher temperatures, decreases in amplitude, and the peak widens. The tan(δ) peak shows similar behavior to the loss modulus peak; shifted higher, lower, and wider with increasing crystallinity.
Cure and Crosslinking
The glass transition can be used to help evaluate cure in crosslinked materials. The effect of cross linking is similar to that of crystallinity in that the polymer backbones lose mobility with increasing crosslinks. While crystals can be melted the crosslinks are typically permanent. Crosslinking is typically introduced through UV curing or thermal activation of active sites.
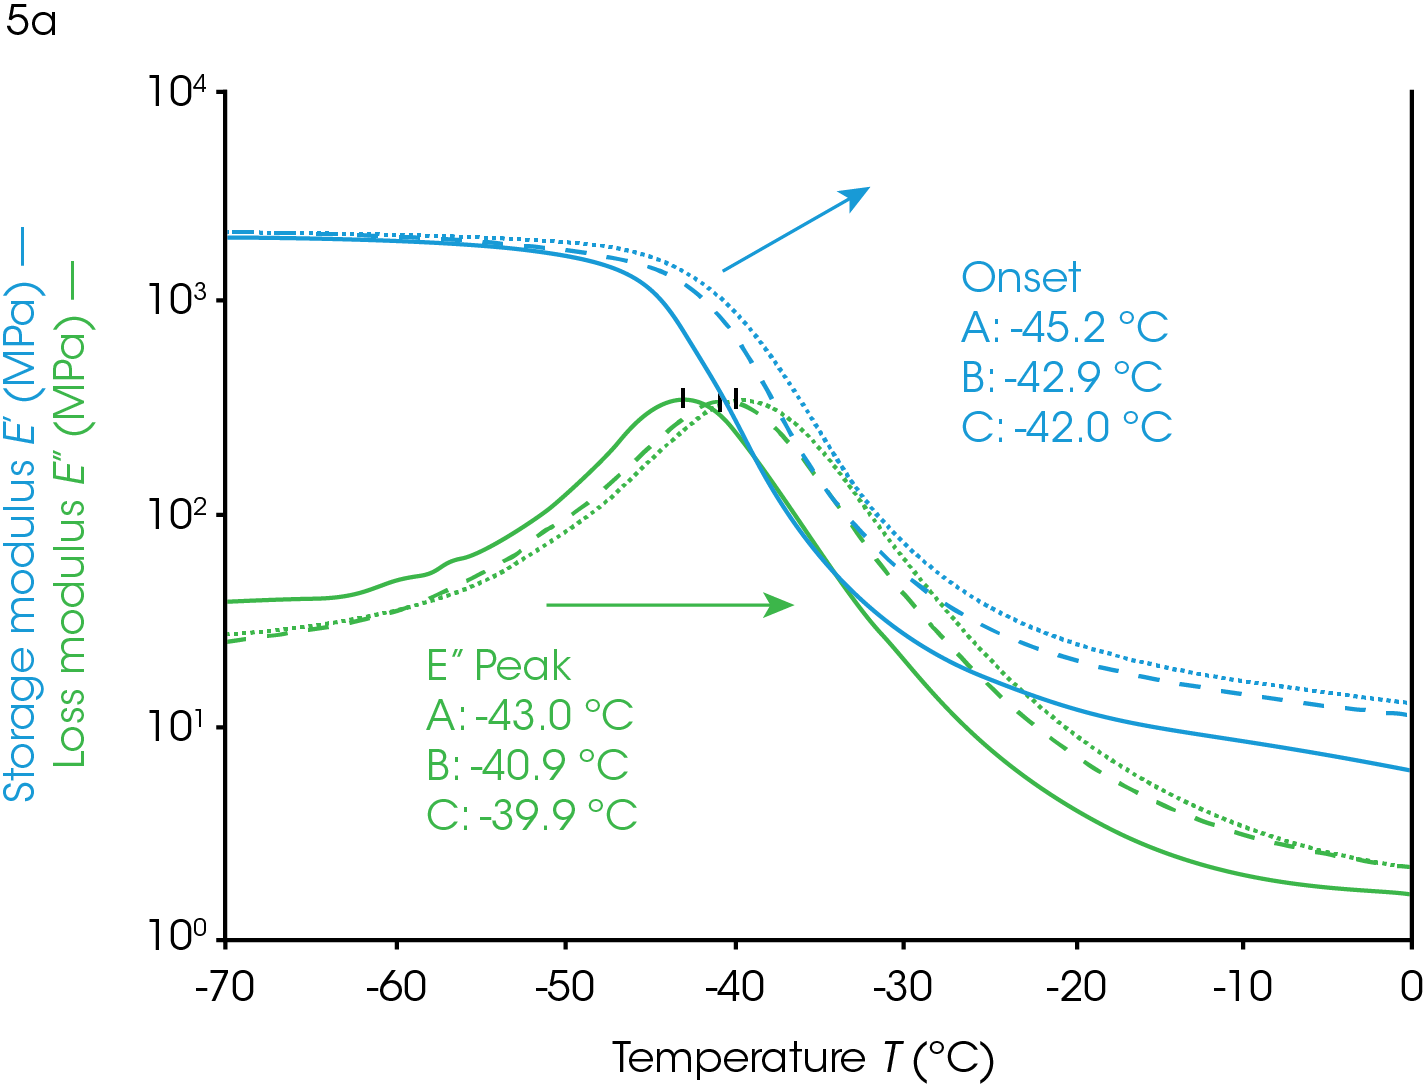
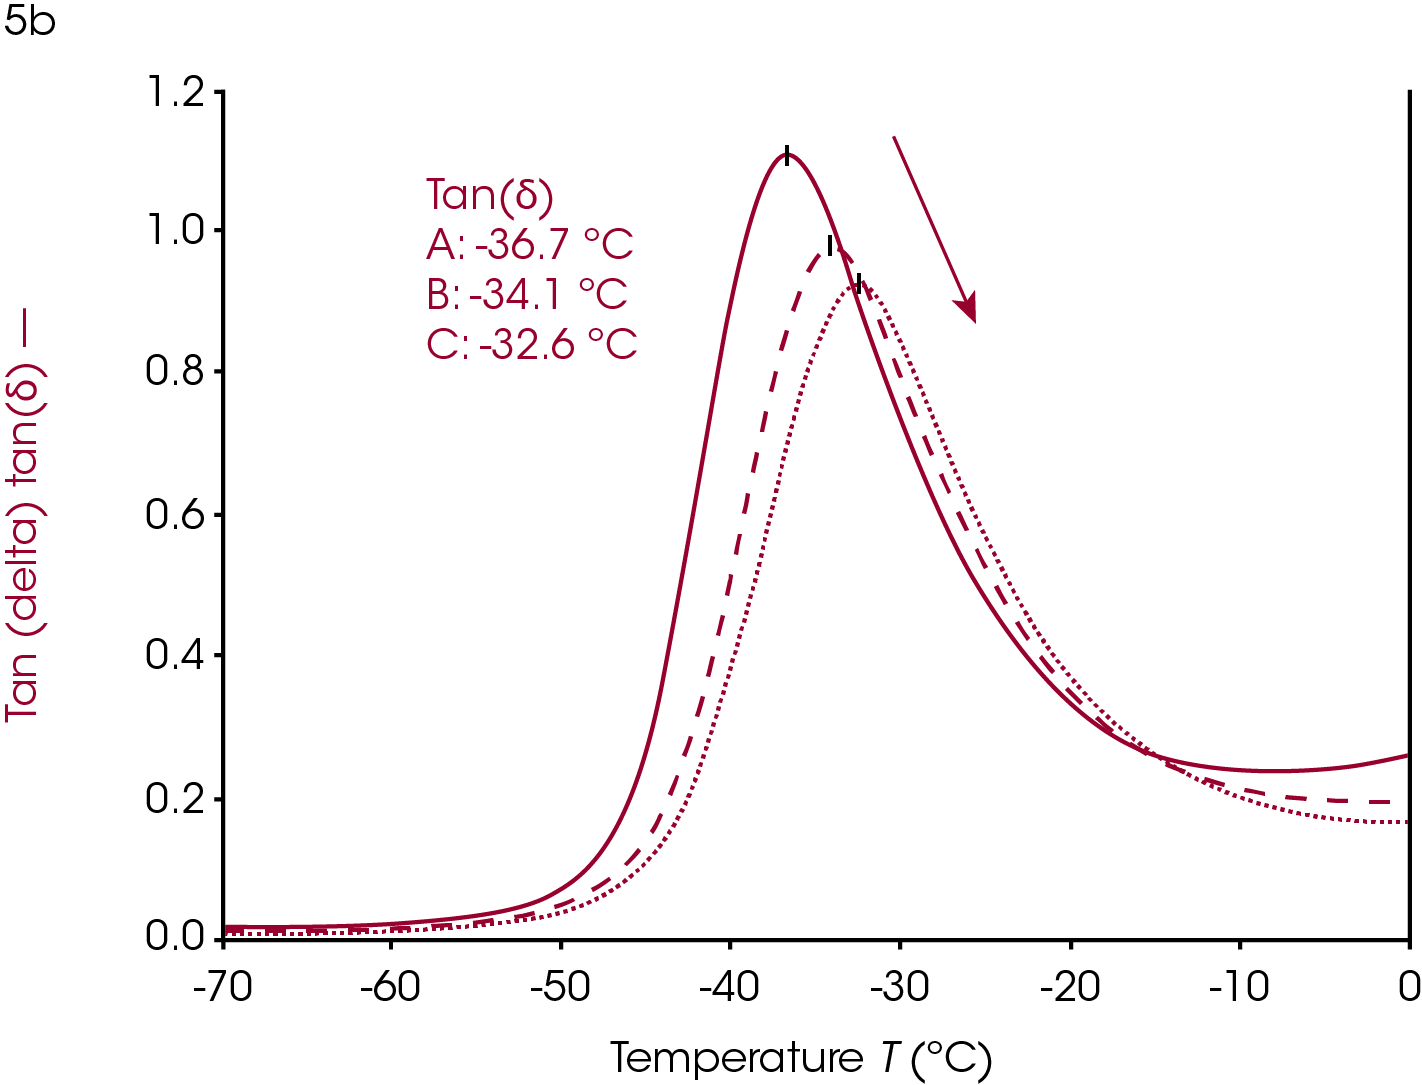
Increasing or introducing crosslinks has little effect on the storage modulus in the glassy region relative to the effects on tan(δ) and the loss modulus. The most significant rheological changes are seen on the transition region and rubbery plateau. The molten region in polymers is typically eliminated in highly crosslinked systems. The loss of backbone mobility shifts Tg higher and lowers and broadens the loss modulus peak and tan(δ) peak. The sample in Figure 5 is a rubber made from ethylene propylene diene monomer (EPDM).
This sample has fillers, processing modifiers, and curing agents added and is overall a complex system. The effect on the Tg as a function of the amount of cure, however, is still visible even in this complex system. Ramp A is the uncured material, ramp B is about 85% of full cure and ramp C is a fully cured sample.
Dynamic mechanical analysis and rheology can be valuable for evaluating cure. The sample in Figure 5 was a ~2mm x 2mm x 20 mm strip of rubber cut from a large mat. This allows the user to evaluate the homogeneity of a larger piece on the millimeter scale. This can help with trouble-shooting a failed product, mixing, or processing.
Users can determine the Tg of a single sample of rubber, or any thermally curing material, and then heat the sample to curing temperatures and rerun the experiment on the same sample to confirm that the cure state resulted in the change in Tg and not the inhomogeneity of any other component in these complex systems where the amount of processing agents and filler can also be inhomogeneous.
Fillers
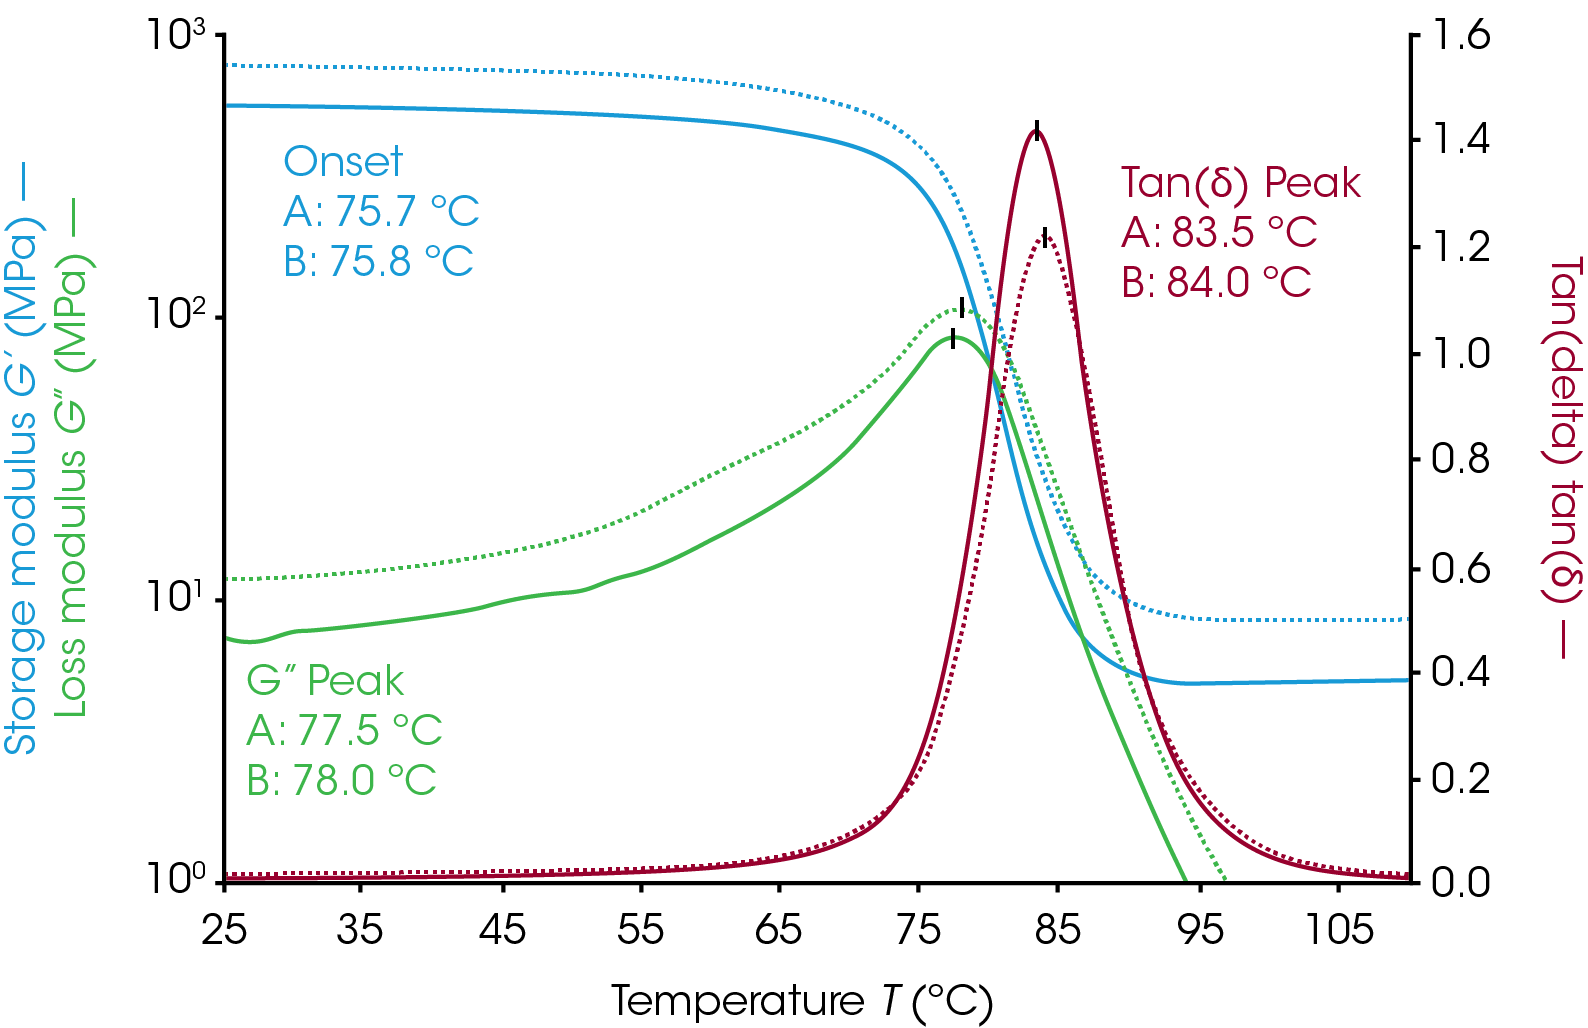
Filler materials are added to polymer systems for mechanical strength, electrical or thermal properties, or to offset costs of expensive polymer systems without drastically changing thermo-rheological characteristics of the material. The effect of increasing filler additives can be seen in Figure 6. The sample was a two-part epoxy with talc filler. The measurement was made with the parallel plate geometry on a Discovery Hybrid Rheometer. Samples were mixed with filler, cured on the rheometer at 100 °C for one hour, and then cooled to room temperature for a temperature ramp to determine Tg. Sample A has 10% by weight talc and sample B has 30% talc by weight. Increasing the filler amount gives the sample additional mechanical strength as an increase in both the loss and storage moduli. The tan(δ) peak intensity decreases with increasing filler content. The onset, loss modulus peak, and tan(δ) peak are all within 0.5 °C of each other despite being mixed separately. Even at high filler concentrations the mechanical changes in samples are clearly visible.
Conclusion
Mechanical analysis provides an extremely sensitive method for determining the glass transition of polymeric systems. Both DMA and rheological methods are sensitive to the mechanical changes exhibited in the transition region. This note has shown the clear points to quantify the Tg and the methods to determine these points. The Tg of a polymeric system can be used for quality control, development, informing processing conditions, and troubleshooting product failures. This note has demonstrated the effect of crystallinity, crosslinking, and fillers to the glass transitions of polymers. Additionally, the Tg can also be influenced by plasticizers, anisotropy, aging, and environmental humidity.
References
1. Ana X. H. Yong, Graham D. Sims, Samuel J. P. Gnaniah, Stephen L. Ogin & Paul A. Smith (2017) Heating rate effects on thermal analysis measurement of Tg in composite materials, Advanced Manufacturing: Polymer & Composites Science, 3:2, 43-51, DOI: 10.1080/20550340.2017.1315908
2. L. Nielsen, F. Lendel, (1993) Mechanical Properties of Polymers P179
Acknowledgement
This application note was written by Kevin Whitcomb, Ph.D, Application Engineer at TA Instruments.
Click here to download the printable version of this application note.

