Keywords: polymers, thermoplastics, viscosity, viscoelasticity, modulus, elasticity, normal force
RH135
Introduction
Polymers melts are viscoelastic fluids which can behave as viscous or elastic, depending on how fast they flow or are deformed in the process. A material which processed easily on a film blowing line twenty years ago may not run at all on today’s lines, which operate at much higher draw speed. The process time could have become much shorter and the new conditions could have negative effects on the overall processibility. Another example is sub-optimal melt flow in the mold during the injection molding process caused due to changes in material chemistry, or process time, or both. These can induce orientation effects resulting in undesirable anisotropy in the mechanical properties of the finished parts. Polymer melt rheology aims to understand and quantify the viscous and elastic properties of a polymer so that the process parameters are aligned with the material’s melt properties and vice-versa.
Viscosity and Elasticity
A typical characteristic of a polymer melts is that they are non-Newtonian fluids with viscosity decreasing with increasing shear rate. Viscosity measurements can be performed either through direct flow measurements or through oscillation measurements over a range of frequencies (and converted to flow measurements using the Cox-Merz transformation1) can be used to gauge the rate of the viscosity changes with shear rate. This is important from the standpoint of processing ease, and for determining processing energy needs. The dynamic measurement also provides a simultaneous measure of melt elasticity, the main determinant of viscoelastic melt behavior, and the cause of such phenomena as die swell.
Low Shear
Low shear rate measurements in the melt’s linear viscoelastic region are a key in material problem solving. While thermoplastic polymer processing operations such as extrusion and injection molding typically involve high shear rates, finished part quality is often controlled by the low shear rate behavior. For example, gauge variation can be caused by variable post-extrusion die swell, and warpage can occur from non-uniform relaxation during cooling of an improperly formulated injection molding compound. Also, by testing at low enough shear rates so that the measurements are in the melt’s linear viscoelastic region, the data can be linked directly to the polymer’s molecular structure such as molecular weight and molecular weight distribution- factors which control polymer process ability and product performance.
Time Dependence and Deborah number
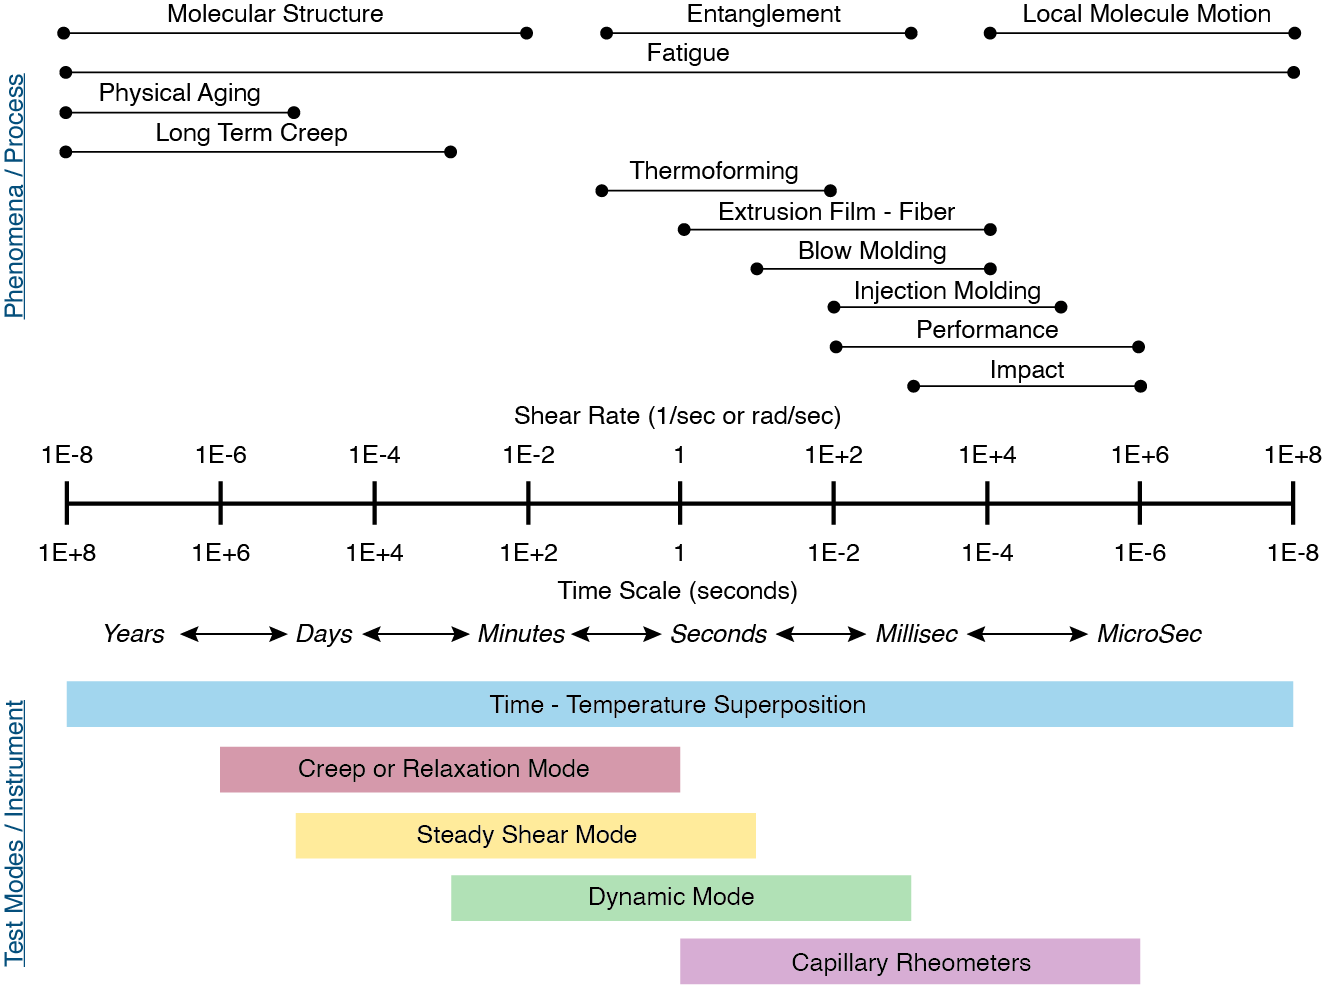
Thermoplastic polymers are viscoelastic materials and as such exhibit a pronounced time or frequency dependence. For convenience, thermoplastic melts are characterized with a representative material relaxation time (λ). In a similar way, individual steps in a manufacturing or transformation process can be described by a characteristic process time (see Figure 1).
The ratio of the material relaxation time and the characteristic process time; the De (Deborah) number; is an important process parameter. Increasing the take up speed in a film blowing process is identical to decreasing the process time: in order for the Deborah number, characteristic for the process to be constant, the material relaxation time has to be decreased as well, typically by increasing the viscosity by decreasing the temperature or increasing the molecular weight). Not adapting the characteristic materials time would cause the material to behave more solid-like (high De number) under the new processing regime and lead to reduce performance and eventual breaking of the film due to reduced flexibility. A low De number stands for a predominately viscous behavior, a high De number for an elastic material response.
Shear and Elongation
Most rheological tests are done in shear using rotational or capillary rheometers, whereas most process flows are usually mixed flows with elongation deformations being important and dominant in processes like film blowing, blow molding, fiber spinning, etc. The elongation viscosity of elastic materials at large deformations can deviate significantly from the shear viscosity and therefore is an important parameter to predict processing performance or to design process equipment. Elongation properties at large deformations correlate with molecular structure. The elongation viscosity as such is a very sensitive indicator of long chain branching.
Effect of Molecular Structure and Morphology
Molecular Weight and Molecular Weight Distribution (MWD)
Molecular weight is a critical structural parameter of polymers’ flow behavior at temperatures above the glass transition temperature (for an amorphous material) or the melting point (for a semi-crystalline polymer).
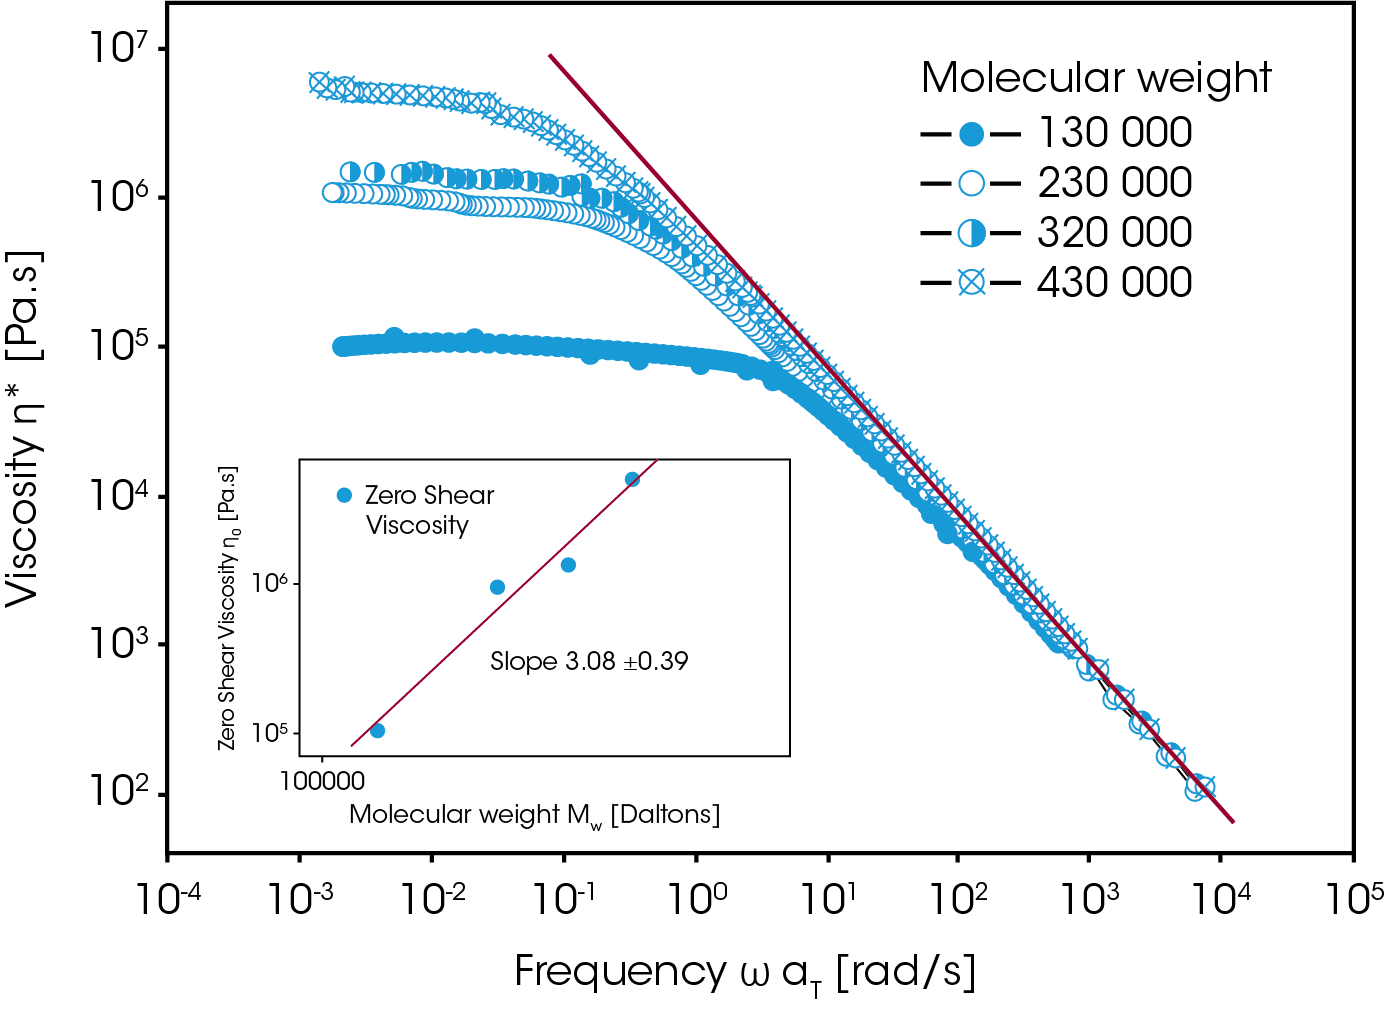
Melt viscosity is does not change with changing shear rates at low shear rates or frequencies. The viscosity in this region is known as the zero shear, or Newtonian, viscosity ηo. For low molecular weight polymers in which chain entanglement is not a factor, the zero-shear viscosity is directly proportional to the polymer’s molecular weight.
However, above a critical molecular weight, chains begin to entangle, and the zero-shear viscosity depends much stronger on molecular weight, proportional now to about the 3.4 power of the molecular weight. This is shown in Figure 2. Rheological measurements are therefore ideal for studying the effects of molecular weight differences in resins as small differences in molecular weight are manifested in large changes in viscosity.
Molecular Weight Distribution
Beyond the Newtonian region, melt viscosity drops with increasing shear rate, a phenomenon called shear thinning. This behavior is considered the most important non-Newtonian property in polymer processing because it speeds up material flow and reduces heat generation and energy consumption during processing.
At constant molecular weight, the amount of energy required to process the polymer is directly related to the viscosity’s shear rate dependence. The onset and degree of shear thinning vary among materials and qualitatively correlate with the molecular weight distribution. Polymers with a broader molecular weight distribution tend to thin more at lower shear rates than those with a narrow distribution at the same average Mw. (Figure 3).
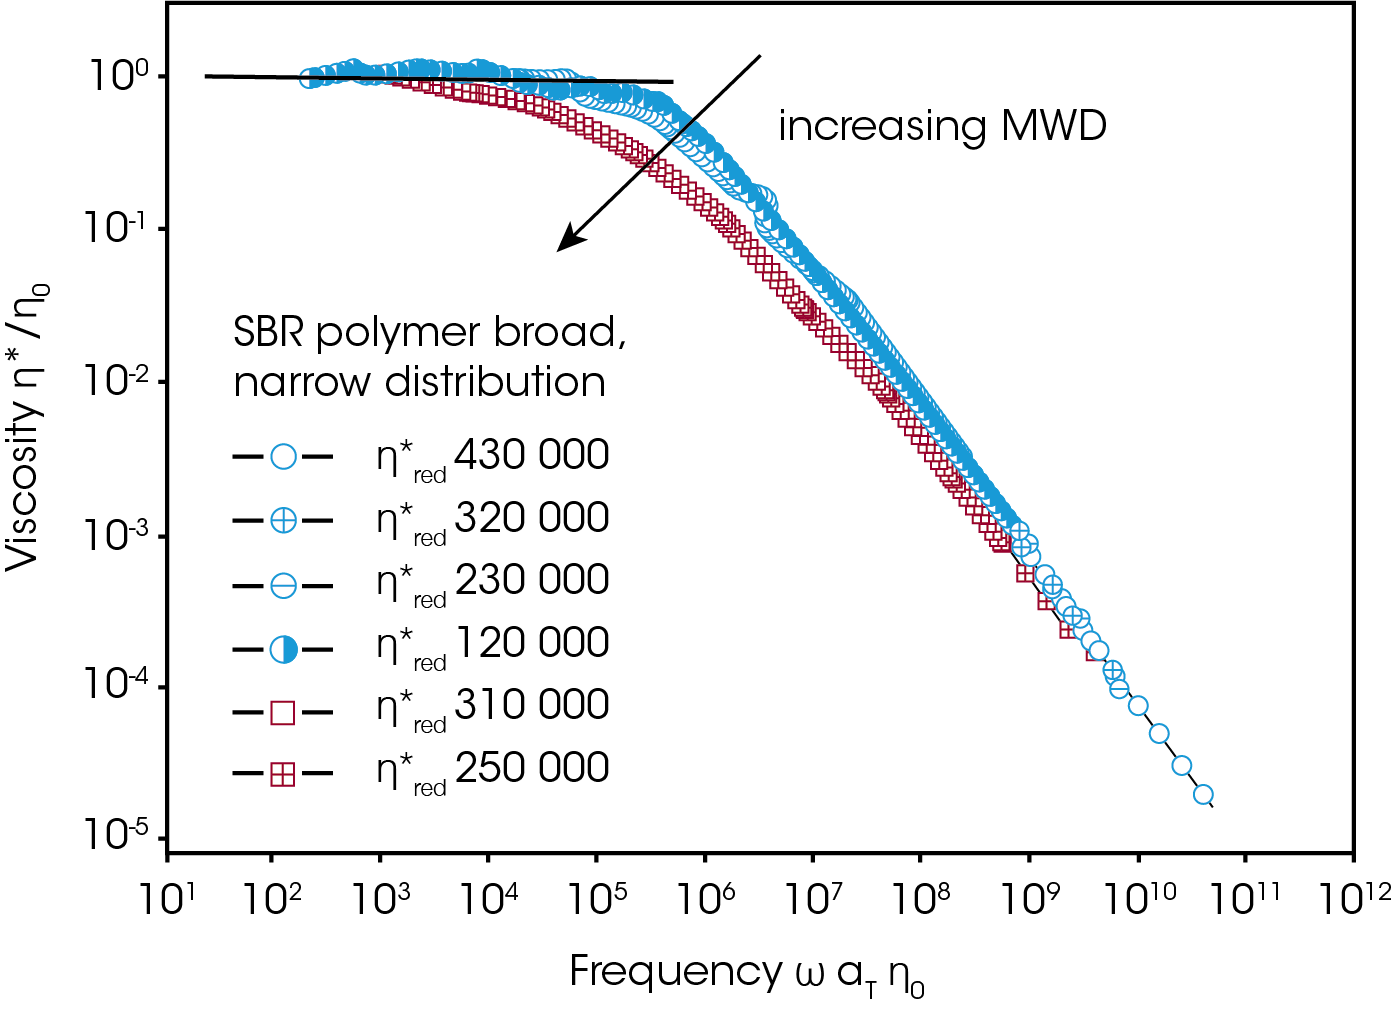
Some important consequences of this: molding and extrusion can for example be made easier by broadening a polymer’s molecular weight distribution. Finished product characteristics, such as sag and haze in blown LDPE films, surface smoothness in a variety of thermoplastic molded goods, can be altered by changing molecular weight distribution.
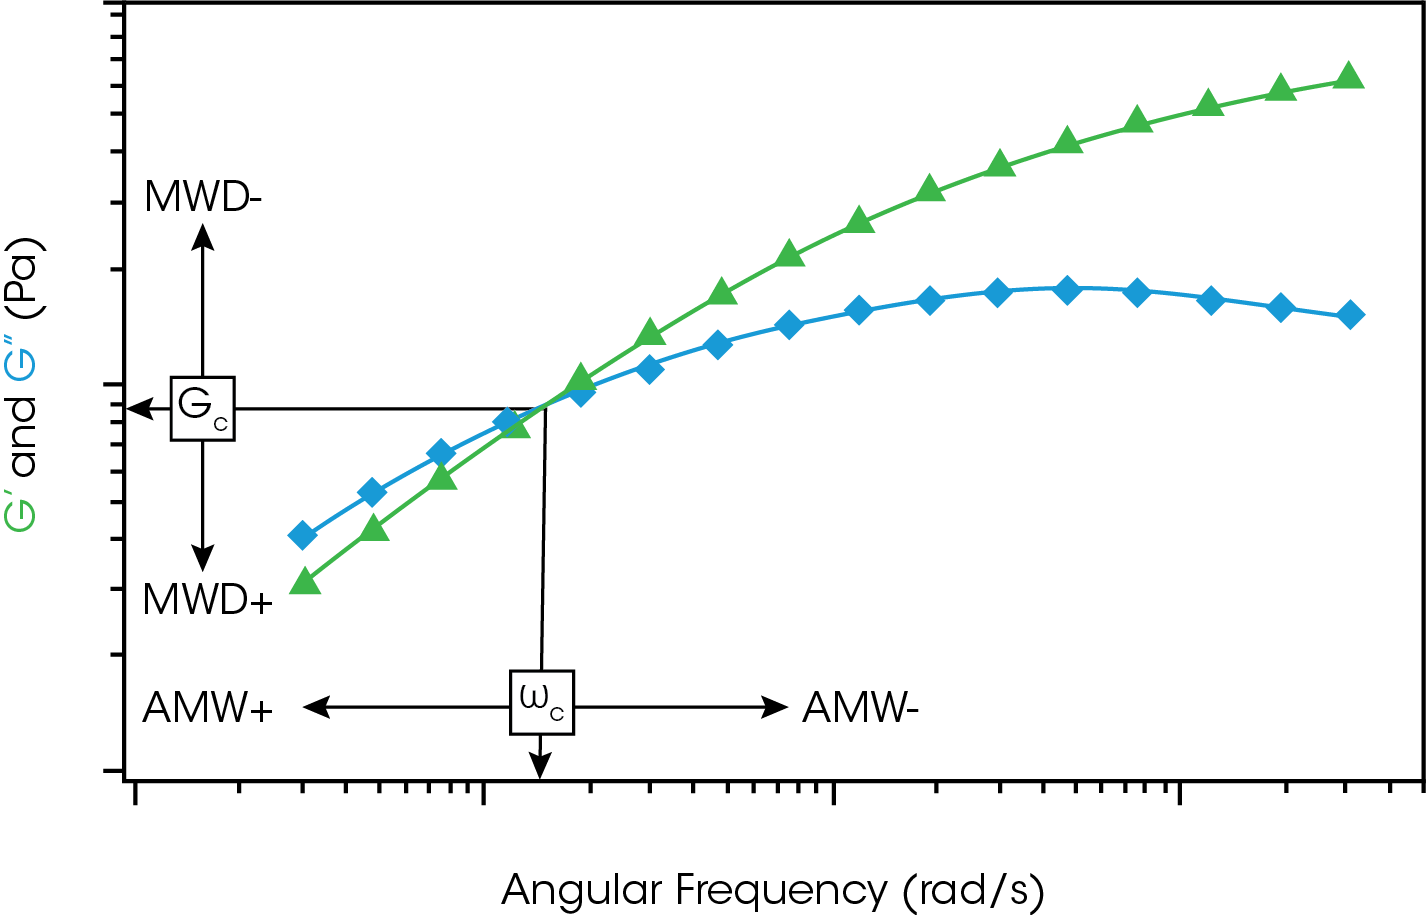
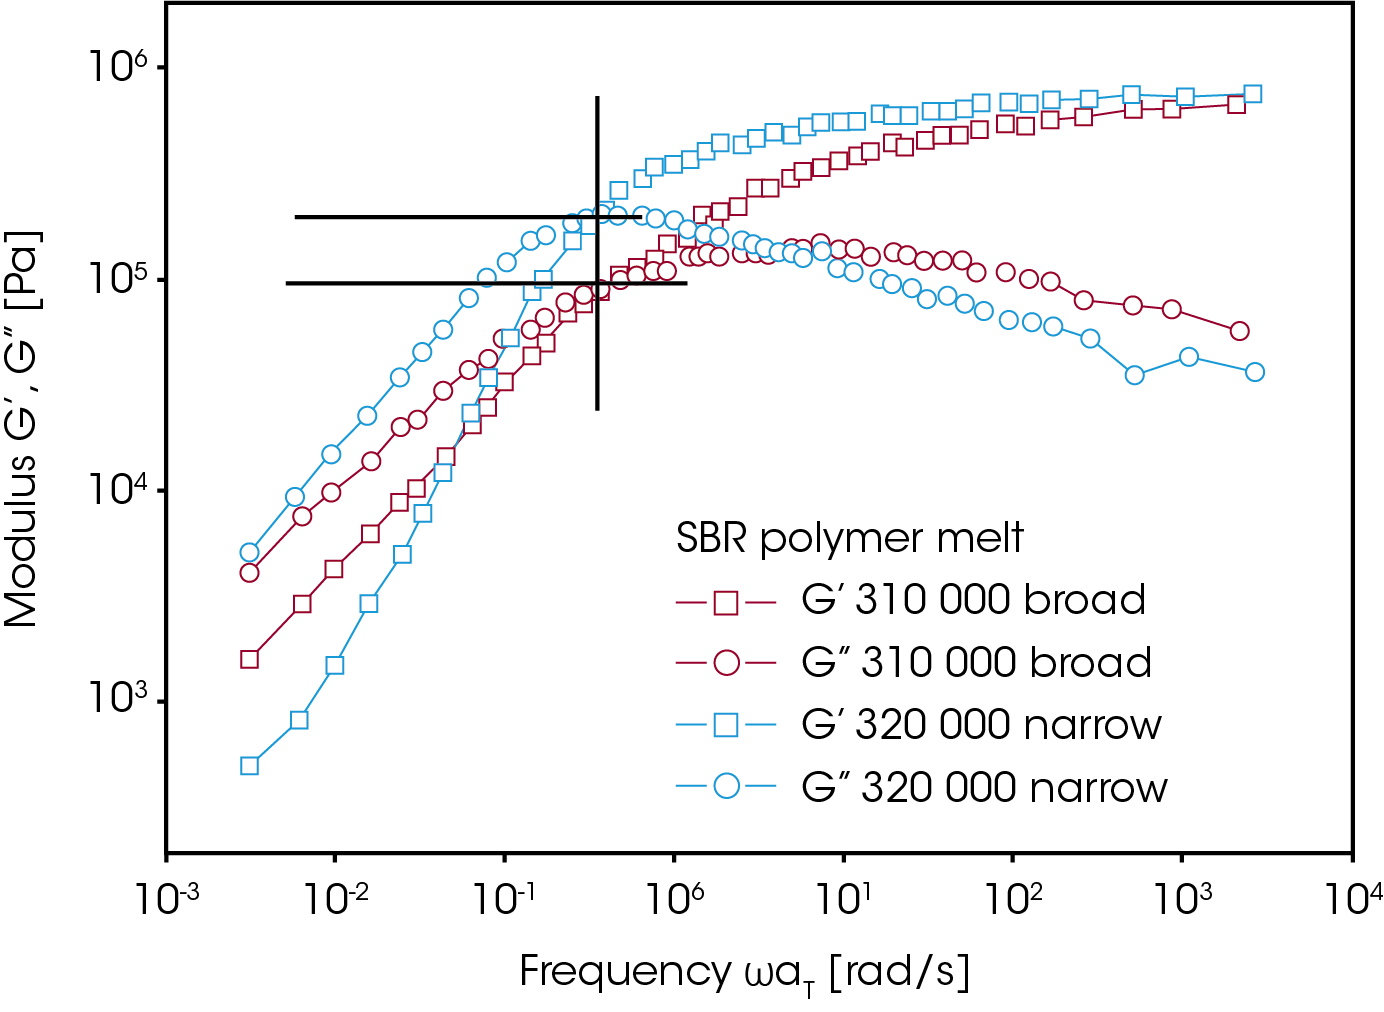
Polymer melts are viscoelastic materials. When subjected to oscillatory mechanical perturbations at different frequencies, G’ > G” at higher test frequencies. Depending on the material and the test conditions, the converse can also be observed on the same graph, where G’ < G” lower frequencies. This results in a crossover of the G’ and G” curves at a specific crossover frequency (ωc) and a crossover modulus (Gc) at which G’ = G’’. The cross-over frequency is a measure of the longest relaxation time (λ) of the system, given by 1/ωc. All other properties being comparable, a material with a higher average molecular weight can be expected to have a longer λ and consequently a lower ωc. As a result, comparisons of ωc can often be used for relative comparisons of molecular weight. Similarly, the cross-over modulus can be used as a relative measure of the molecular weight distribution. This concept is shown schematically in Figure 4 below.
The slope of the modulus versus the frequency curve for a melt also mirrors changes due to molecular weight distribution. Isothermal measurements of the modulus at low frequencies show marked increases in the storage modulus as distribution is broadened. Such changes have been used to distinguish between good and poor performing products and guide subsequent product improvements through adjustments in molecular weight distribution (Figure 5).
Branching
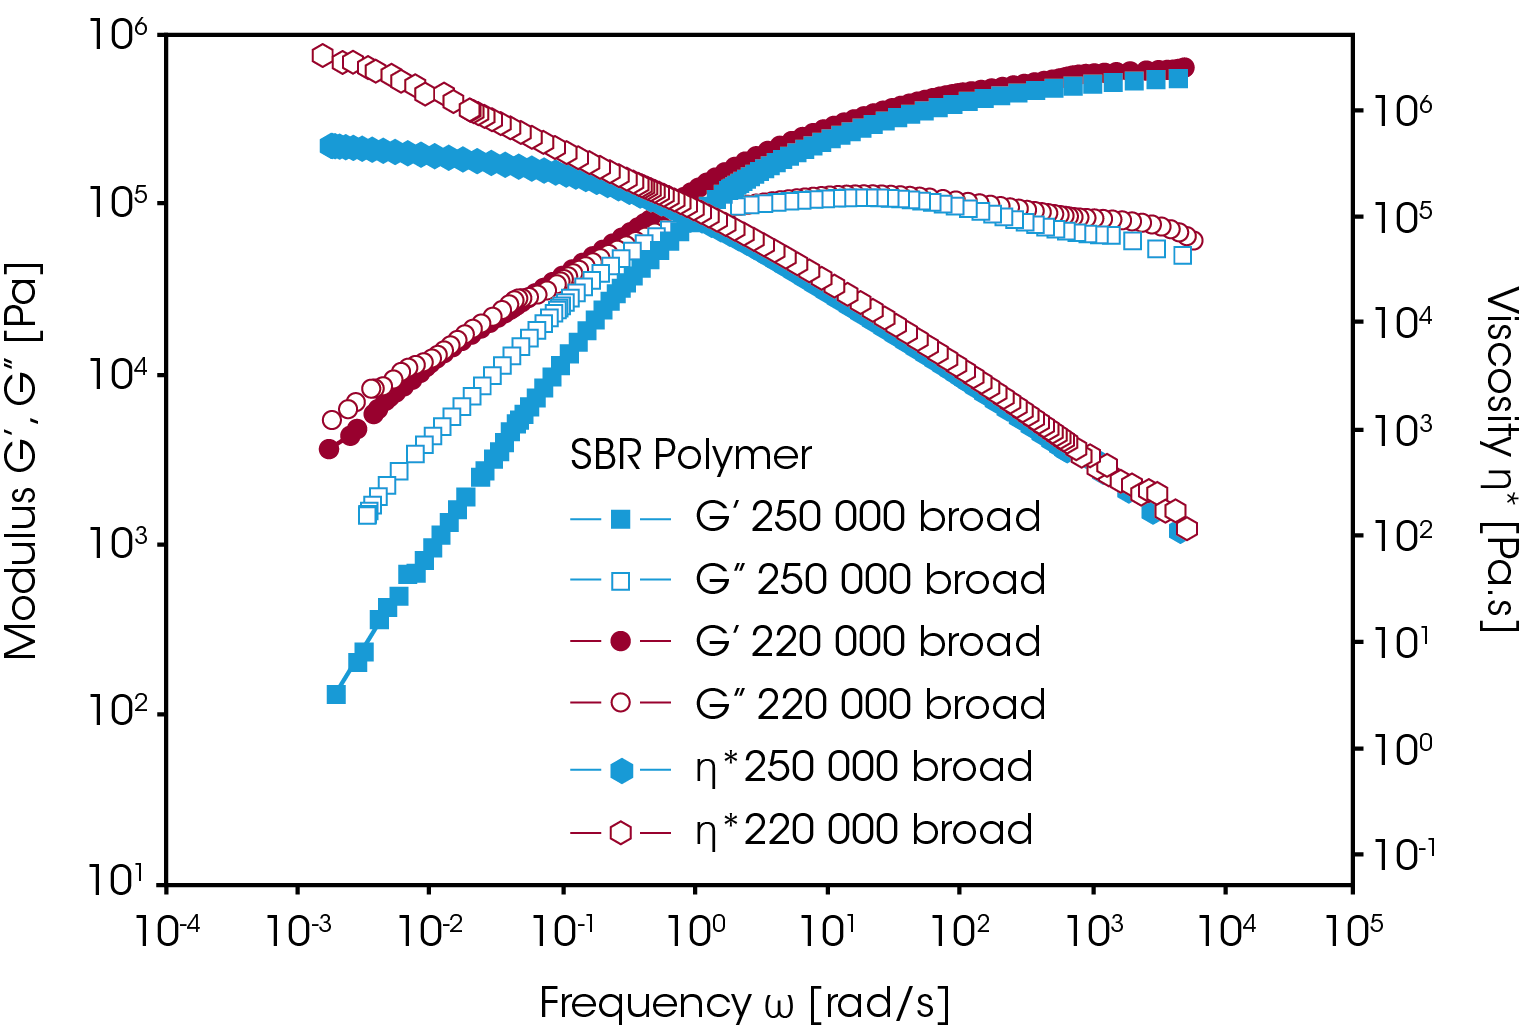
Polymer chain branches can vary in number, length and distribution along the main chain. Increasing the number, the size, or the flexibility of the branches changes the melt viscosity. But if the branches are few and long enough to entangle, melt viscosity will be higher at low frequency than that of a corresponding linear polymer of the same molecular weight (Figure 6). The viscosity of long-branched polymers is more shear rate dependent than is the viscosity of linear polymers and long chain branching affects the elasticity of the polymer melts which shows in the normal stress difference and the storage modulus.
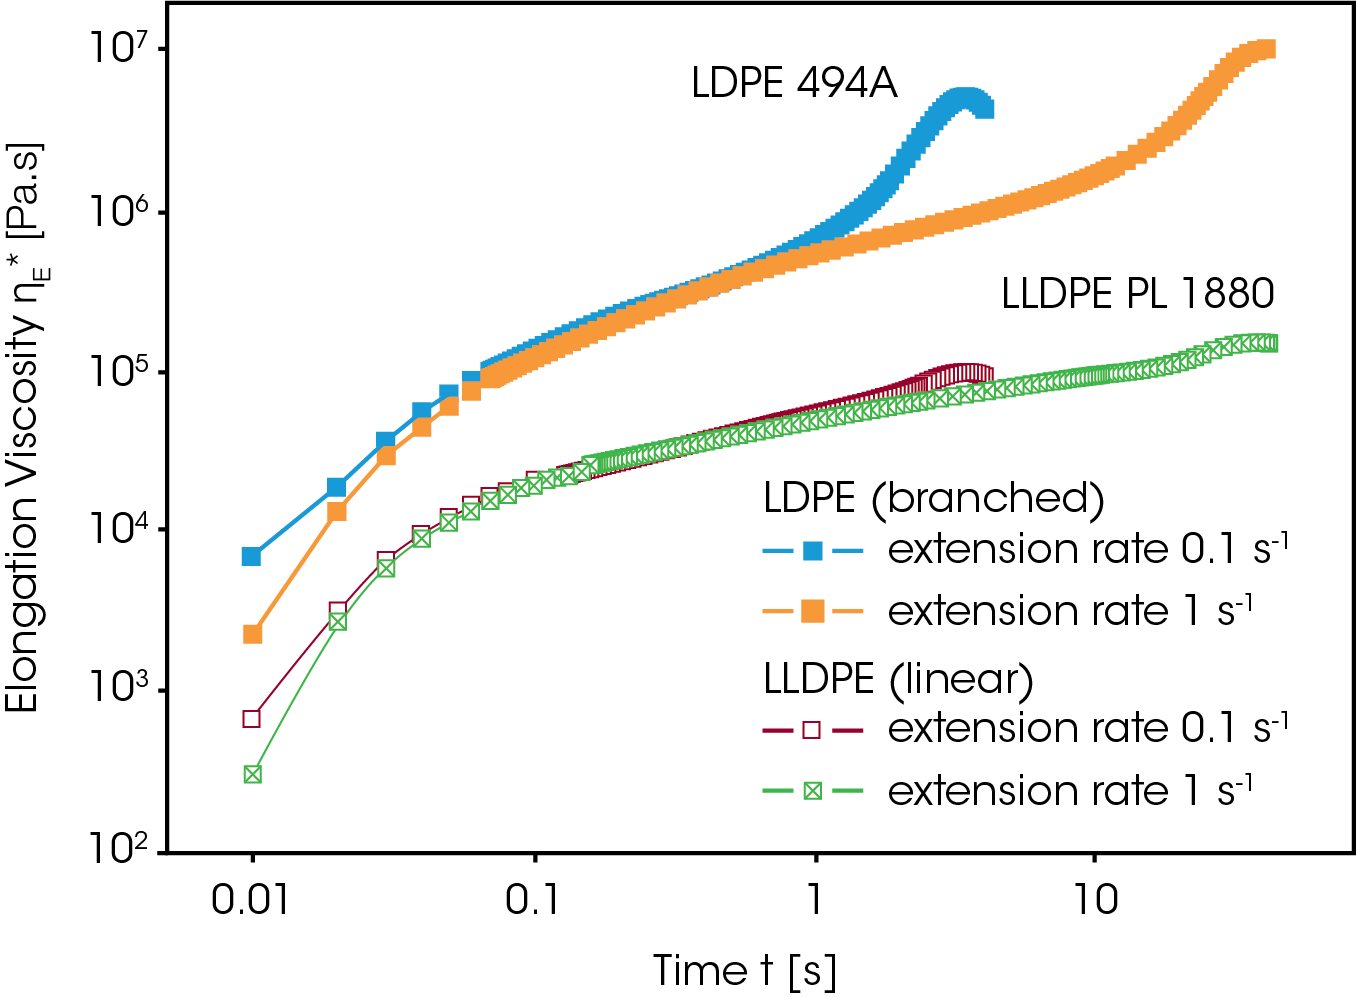
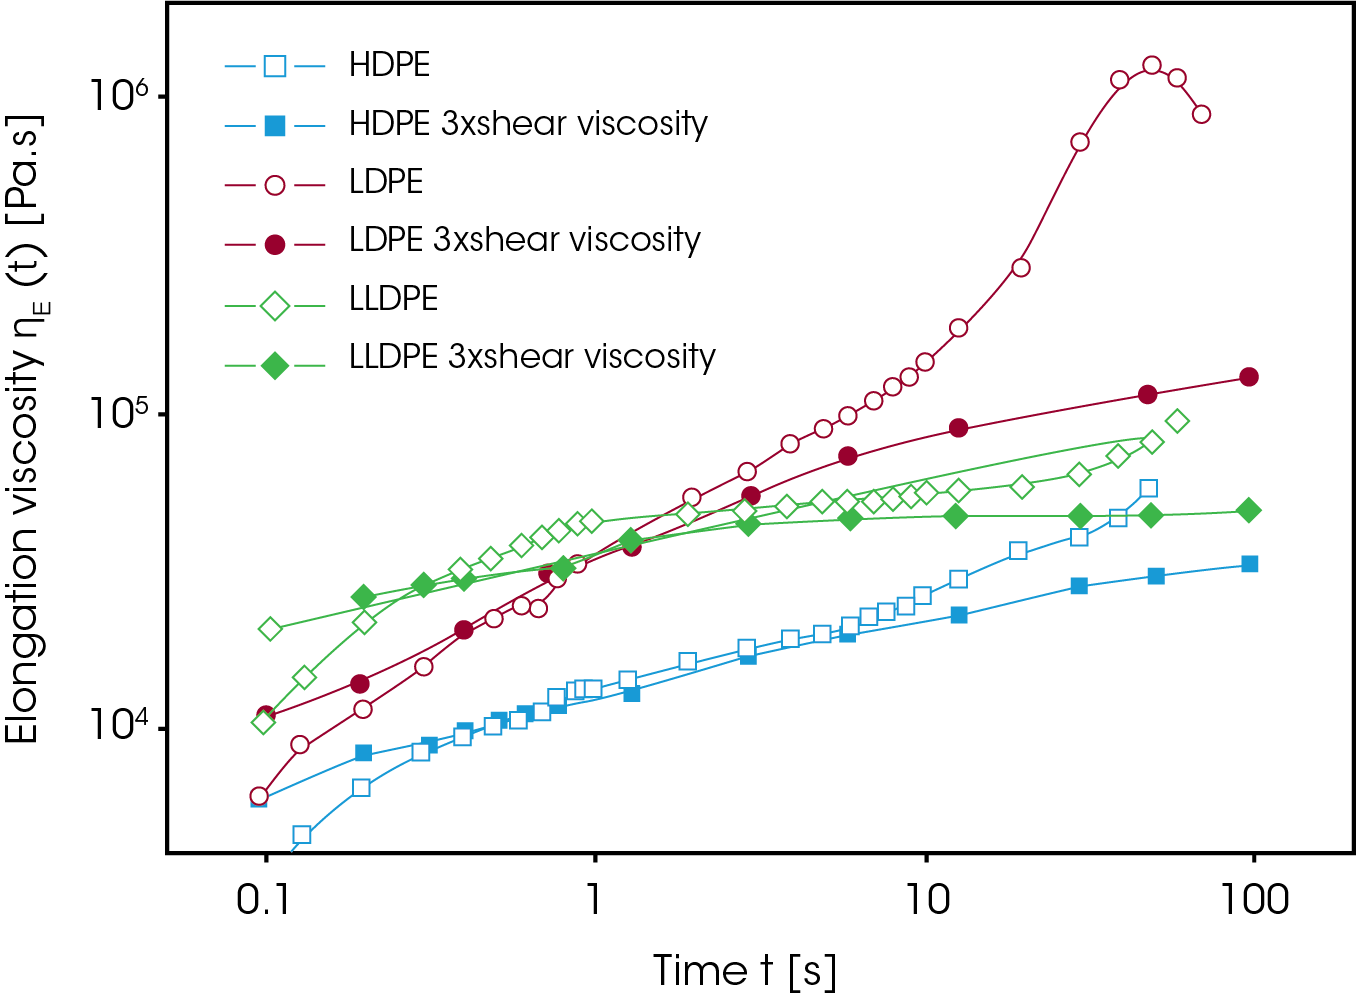
The extensional viscosity at high strains increases strongly with long chain branches. Figure 7 compares the rheological responses of a long chain branched LDPE and a linear LLDPE in elongation. The pronounced viscosity increase at large elongation strains (strain hardening) is characteristic for long chain branching.
Fillers
Adding fillers to a neat polymer melt changes its rheology, influencing both the way the melt processes and the properties of the ultimate product. Key factors are filler size and shape, filler concentration, and the extent of any interactions among the particles.
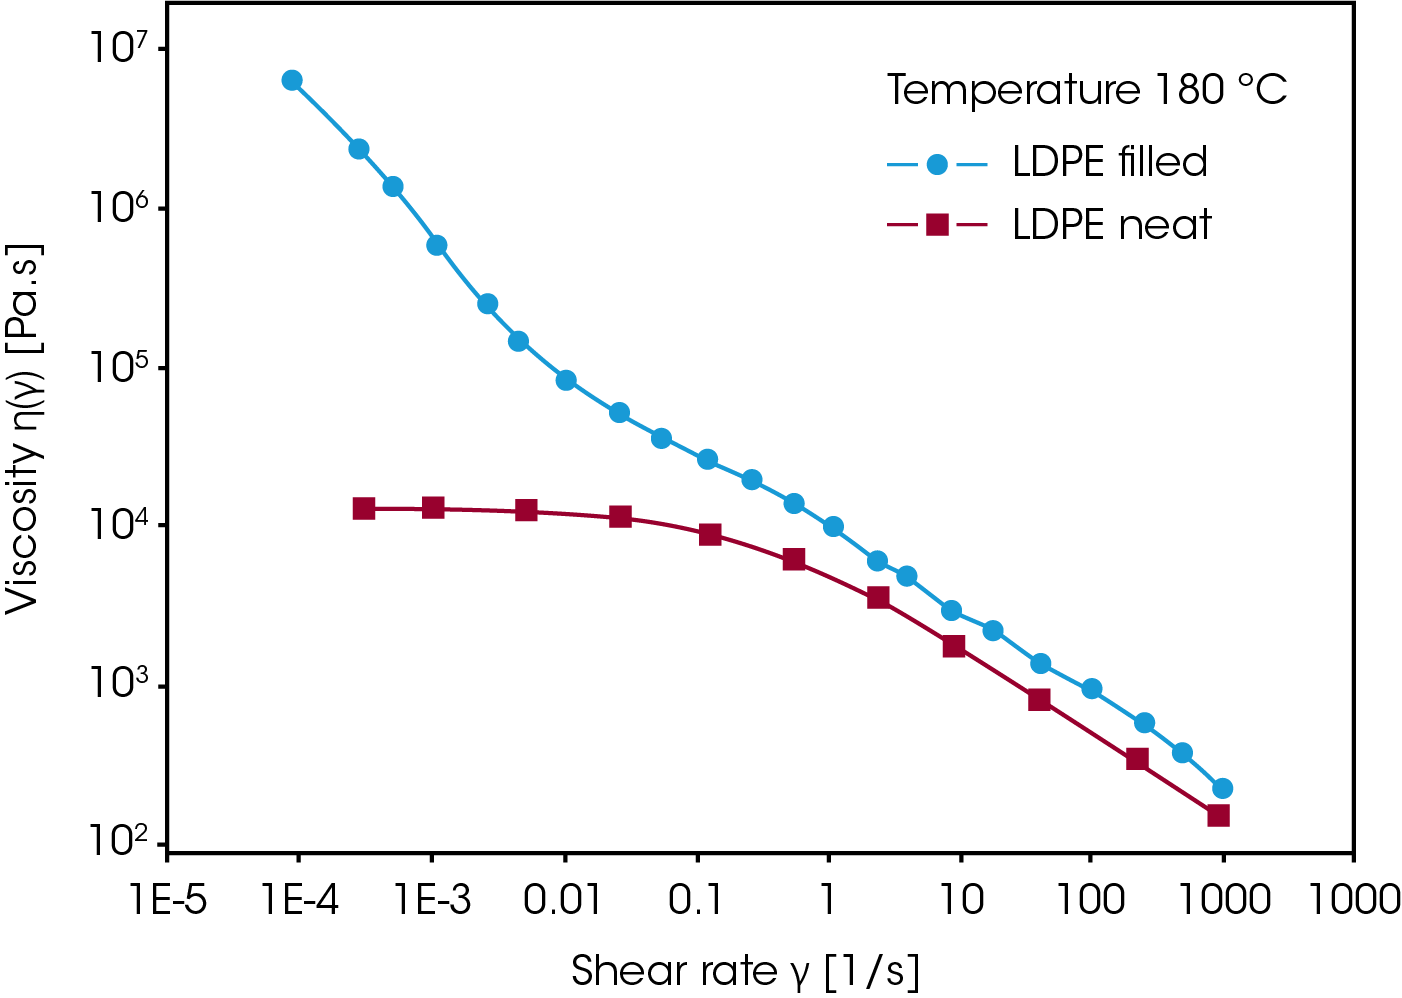
The consequences of adding fillers are an increase in melt viscosity and a decrease in die swell. Moreover, particle interactions increase the non-Newtonian range and cause it to occur at a lower shear rate than for the unfilled polymer melt. Filled polymers have a higher viscosity at low shear rates, and yielding may occur with increased filler concentration (Figure 8). At higher shear rates the effect of the filler decreases and the matrix contributions dominate. Another effect of the filler is the reduction of the linear viscoelastic range, characterized by the onset of the strain dependent behavior.
Application Examples
Processing
Molecular structure and ability to process Rheological measurements are extensively used to study polymer melts. The parameters obtained describe the fundamental behavior of materials such as ABS, PVC, polyolefin, etc. In processes such as bottle blow molding, injection molding, sheet forming, cable jacket extrusion, fiber spinning, etc., rheological measurements correlate molecular structure, MW, MWD and LCB to such processing behavior as flow rate, die swell, melt stability, recoverable shear and frozen-in stresses.
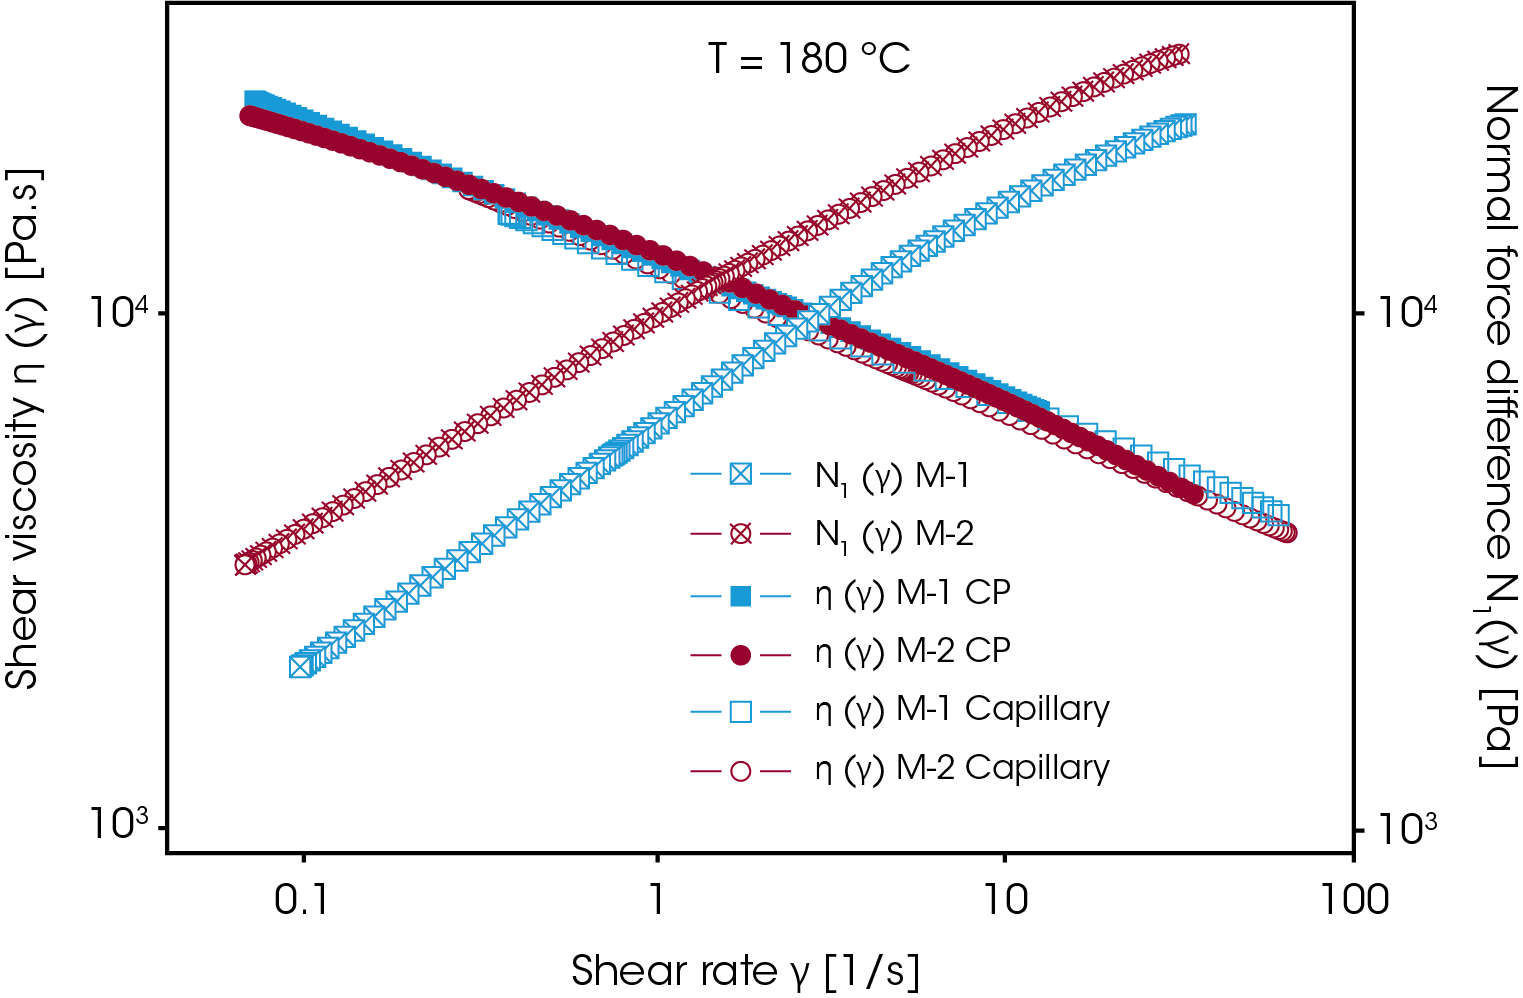
Figure 9 shows melt viscosity and the first normal stress difference data, measured in cone plate. The two HDPE’s M-1 and M-2, were found to be very similar by capillary viscometry and even GPC, yet they perform quite differently in a standard bottle blowing line4. M-2 produced significantly heavier bottles. Although the viscosity and the molecular weight distribution (see Table 1 below the Figure 9) of these two materials are almost identical, the normal stresses reported differ significantly. The measured normal stress difference correlates well with the parison swell – a difference in long chain branching or a small amount of high molecular weight component may be the origin. Due to the increased die swell, the parison is thicker, therefore the increased weight of the bottle. In order to evaluate the effect of long chain branching, uniaxial elongation viscosity measurements in the melt can be performed. Data are shown in Figure 10 for three polyethylenes, an LDPE, a HDPE and an LLDPE4. The LDPE shows an pronounced strain hardening, i.e. a significant increase of the viscosity with increasing Hencky deformation. This strain hardening stabilizes the parison – the wall thickness of the bottle during blow molding or the free film in a film blowing process becomes more uniform. Strain hardening with a minimum of die swell and enough viscosity to prevent sagging of the parison are the design criteria for a good blow molding compound. The HDPE does show much less strain hardening and the LLDPE follows closely the trace of 3 times the zero shear viscosity. The LLDPE also reaches steady state much faster than the HDPE and the LDPE.
| Table | M-1 | M-2 |
|---|---|---|
| MF1 (190; 2.16) | 0.6 | 0.5 |
| GPC (Mw) | 131 500 | 133 600 |
| (Mz) | 907 000 | 1 035 000 |
| η (@ 1s1) | 84 000 | 83 000 |
| η (@ 100s1) | 10 200 | 9 500 |
| Swell (%) | 28 | 42 |
Rheology During Injection Molding – Effect On Residual Strains
For high viscosity melts such as filled thermoplastics or unvulcanized elastomers, cone plate measurements suffer from difficulties forming the sample prior testing as well as edge effects at higher shear rates during testing. Oscillation measurements, probing the material with a sinusoidal shear deformation using parallel plates instead of cone plate, are much easier to perform.
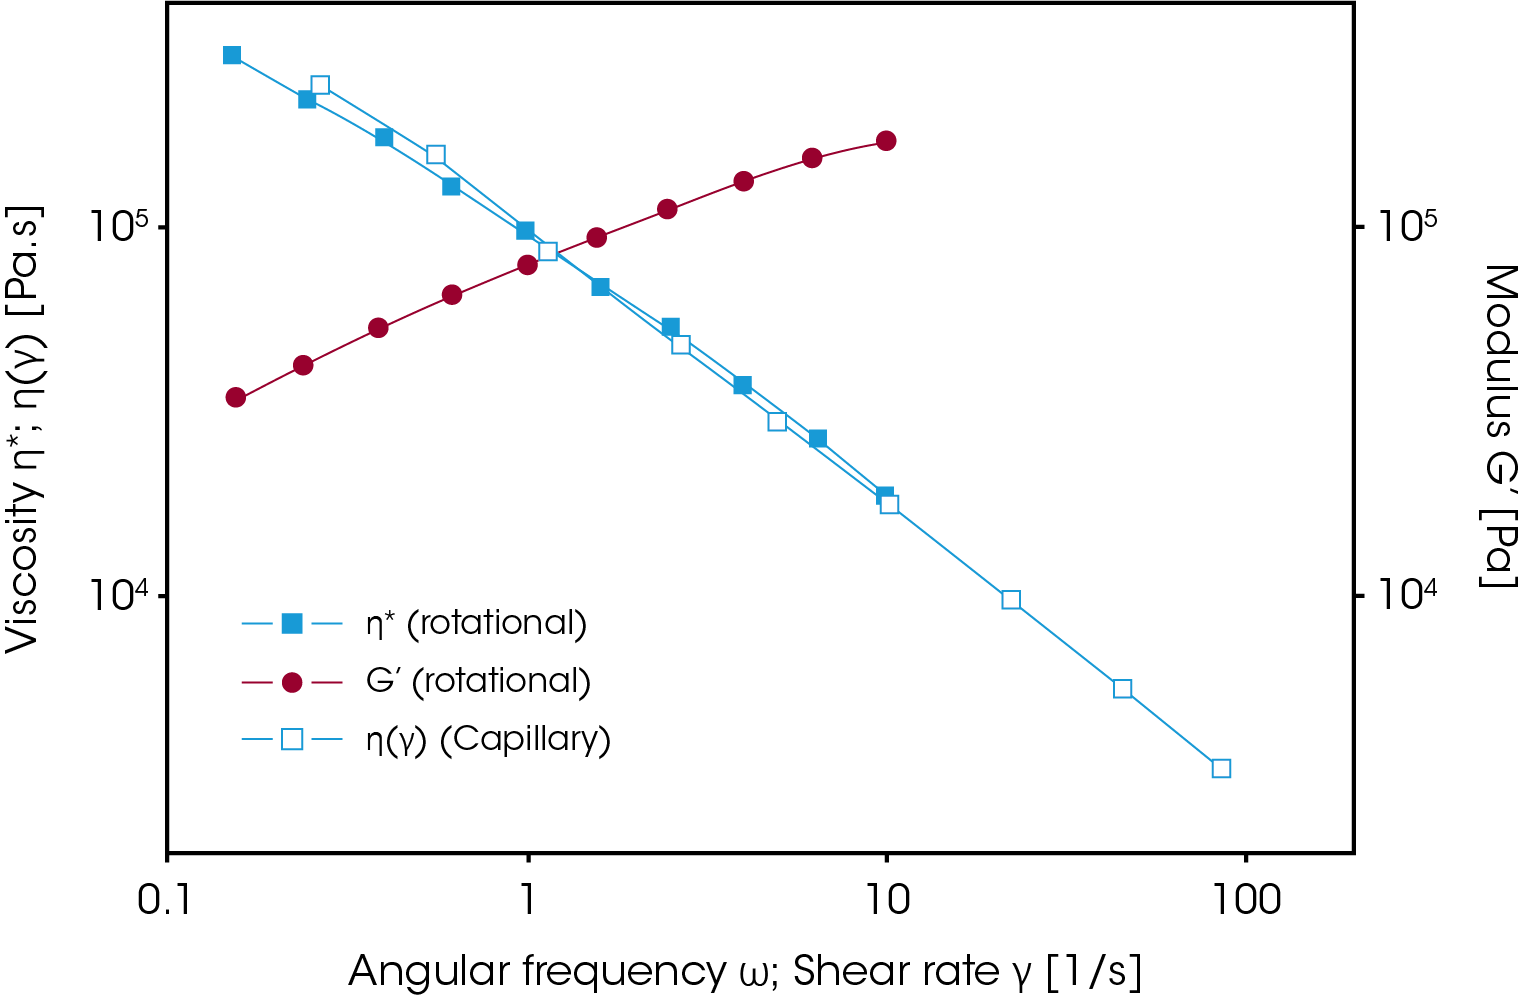
Figure 11 shows the rheological characterization of an injection molding grade ABS. Capillary viscosity data compare well with the absolute values of the complex viscosity, as suggested by Cox and Merz1 and found by many others in unfilled systems.
In addition to the viscosity, an oscillation measurement provides also a measurement of the materials elasticity, represented by the storage modulus G’. G’ correlates with the flow behavior in the mold and strongly influences the relaxation behavior and consequently orientation and frozen-in strains. Relative warpage effects and melt strength depend also on the elastic nature of the polymer melt and the resultant flow behavior in the mold.
Melt Degradation of PVC
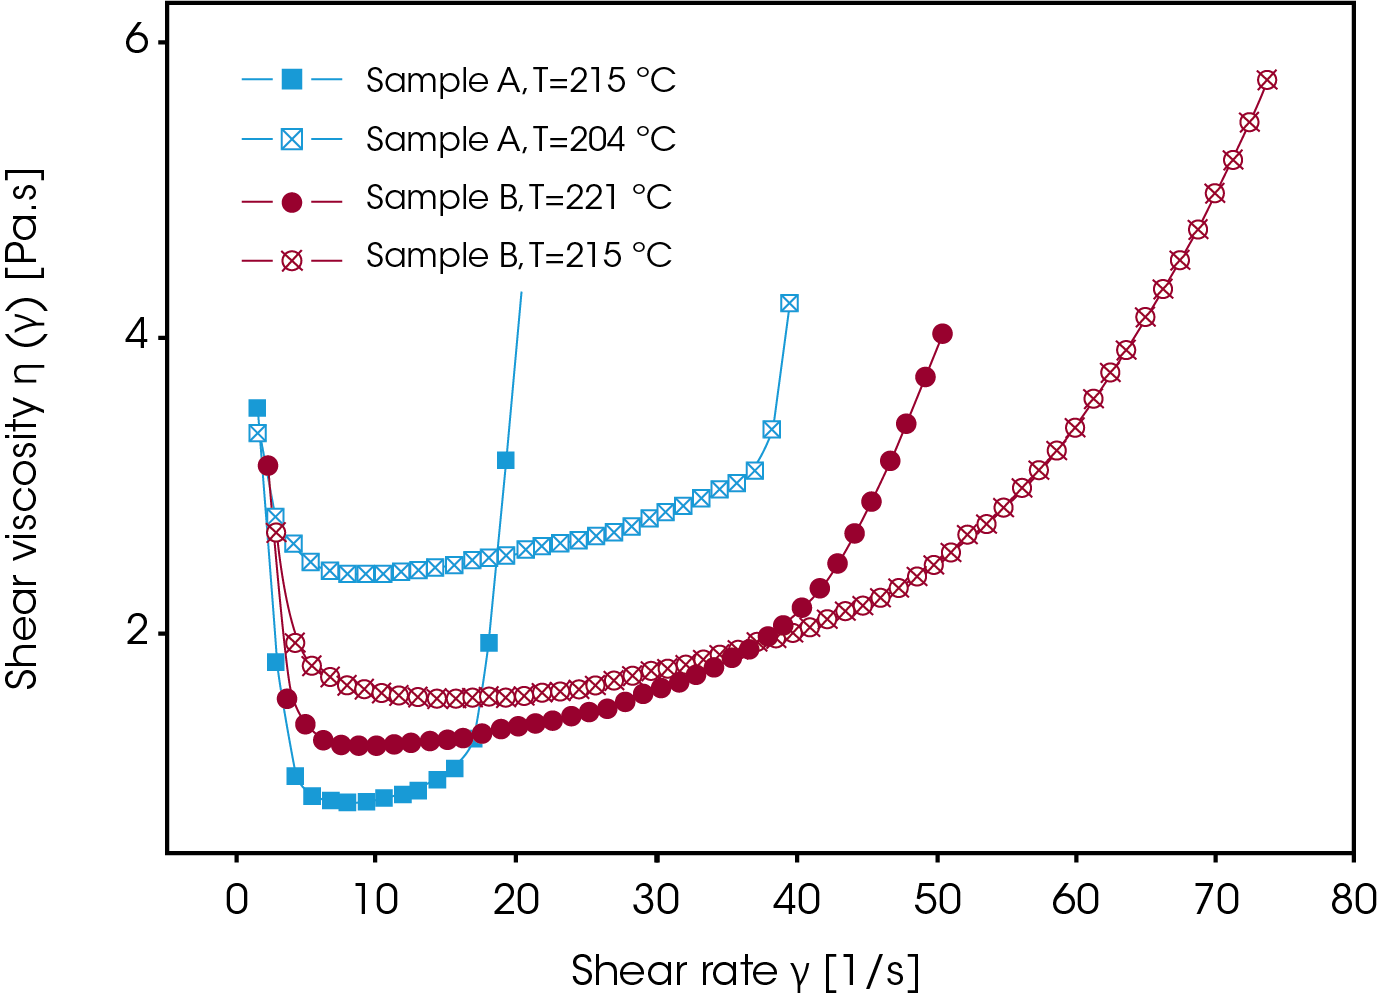
Important in nearly all melt processing operations, melt degradation can readily be followed by recording the dynamic moduli at constant frequency continuously as a function of time at process temperature. PVC is particularly sensitive to process temperature, as shown in Figure 12 for the two injection molding compounds A and B. The two compounds differed in flame retardant additives and color concentrate. The effect on the thermal stability is dramatic. Sample A shows in comparison to sample B rapid degradation after 20 minutes at 215 °C, represented by a steep increase in viscosity.
Extrusion Problems of Thermoplastic Melts
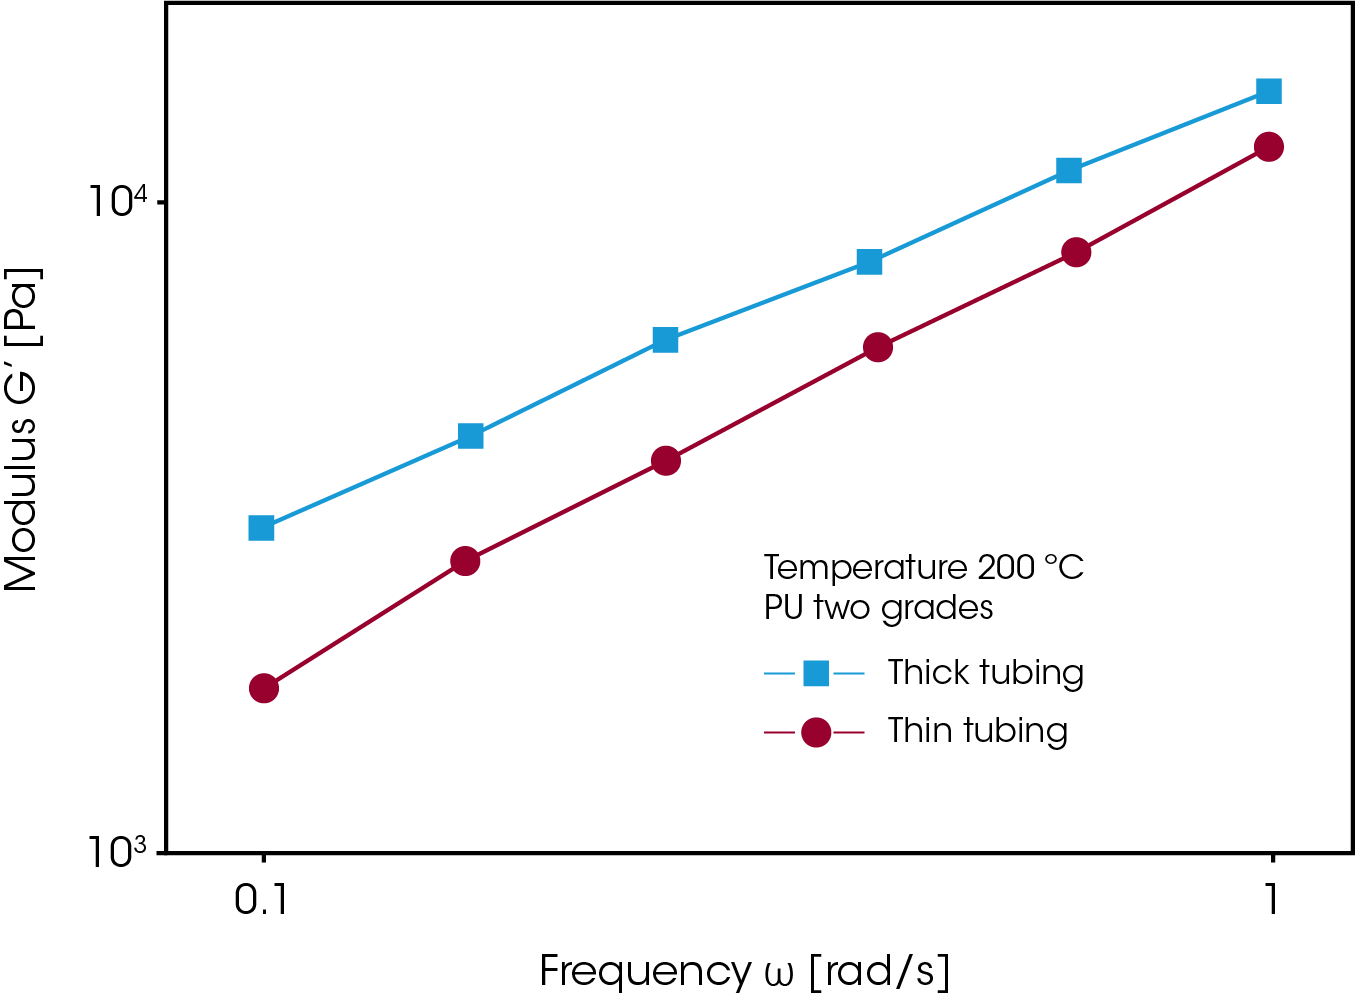
The extrusion of thermoplastics is a high shear process. However, this does not mean that extrudate problems are associated with high shear rate phenomena. As soon as the extrudate emerges from the die, the shear rate declines considerably – the extrudate swell is a comparable low rate phenomenon. Figure 13 shows the storage modulus as a function of frequency, obtained from dynamic mechanical tests on two grades of polyurethanes, used for medical tubing. The specifications call for tight tolerances in diameter and wall thickness.
The material with the higher G’’ provides too thick, the one with the lower G’ too thin tubing. Under identical processing conditions, the small difference in elasticity represented by G’ is enough to cause the tubing to be off spec as a result of variations in die swell. During extrusion through the die, the polymer orients and builds up internal strains. As the polymer leaves the die, these strains recover and the polymer swells. The degree of swelling depends on the ability of the material to store deformation energy, the shear rate and the residence time in the die. In the material, the distribution of molecular weight and the degree of branching affects the degree to which internal strains form and recover. Because G’ is related to the amount of stored energy during the deformation, it provides an estimate of to the degree of recovery of the PU resin. The greater G’, the higher the die swell, the thicker the tubing.
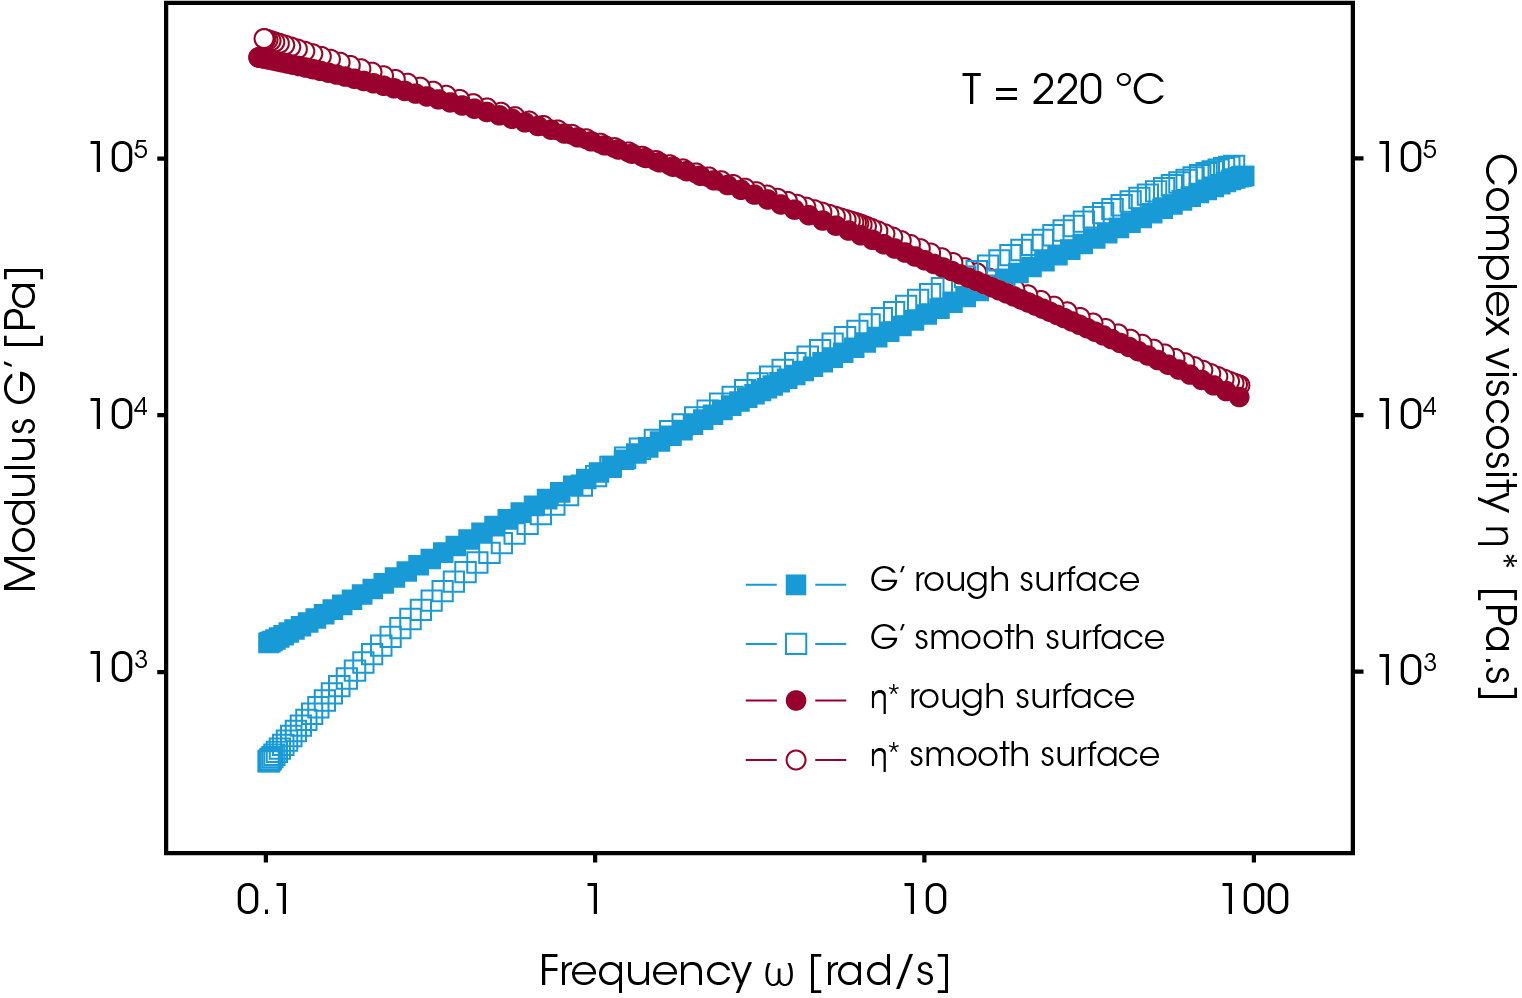
Pipe surface quality defects can also be traced back to small variations of the melt elasticity. Too high elasticity, measurable by the storage modulus at low frequency, (Figure 14) causes rough surfaces during extrusion of HDPE pipes. Reducing the elasticity by using an HDPE with a narrower molecular weight distribution eliminated the problem. Note that small variations of the molecular structure, caused by, for example, tiny amounts of a high molecular polymer may cause significant processing problems. These variations are usually not detectable in MI values or standard SEC analysis.
Bond Strength, Tack and Peel of Adhesives
Adhesive application characteristics and performance behavior are governed by rheological properties. Making a bond involves a low rate deformation typically around 1 1/s. Bond strength, a major performance criterion is tested by performing a peel or tack test. Tack and peel resistance need to be balanced correctly to make an ideal adhesive. All bonding and debonding processes can be related to the viscoelastic behavior of an adhesive. Poor adhesives are found as shown in Figure 15 for the modulus as a function of rate, to have either too much elasticity at high rates (for peel) or too little at low rates (for tack). This causes a poor adhesive to either rip the substrate when peeling or to stick inadequately.
Viscosity stability at processing temperatures is another important parameter for hot melt adhesives. Resins are frequently kept for hours in open tanks in dispersing equipment. The viscosity versus time, as shown in Figure 16 for a polyamide-based resin, characterizes open time. The bad sample after initial drop due to absorption of water builds up viscosity due to oxidative crosslinking and thus is not suitable when long open times are required.
Conclusion
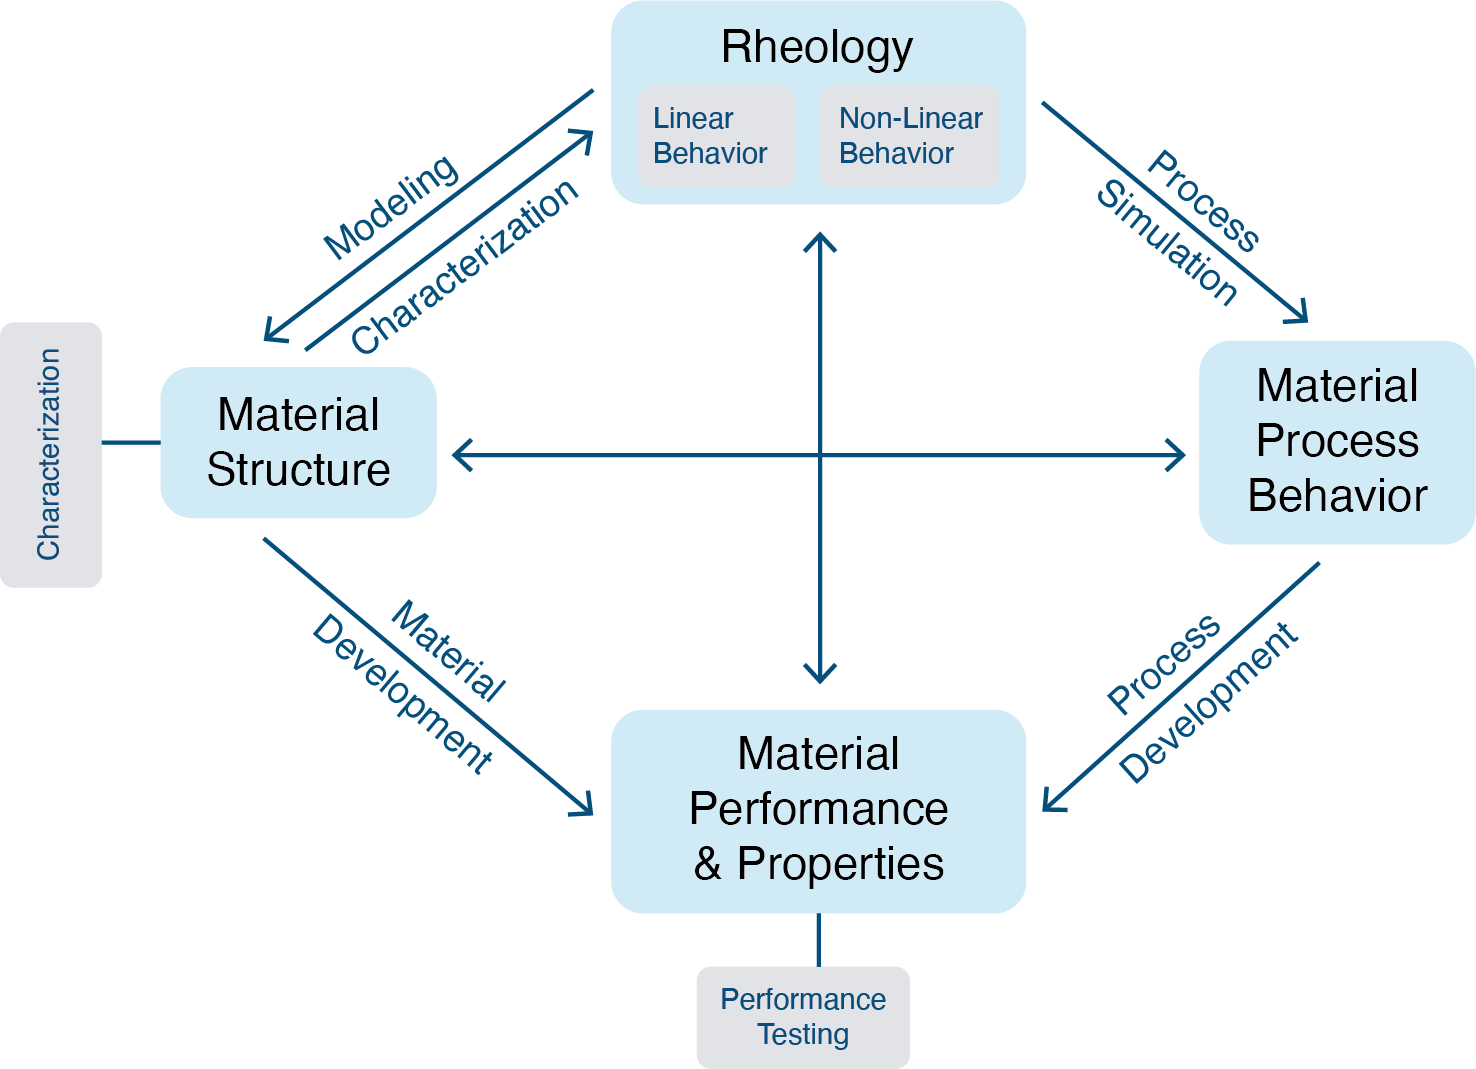
Rheology is very sensitive to small changes of the material’s polymer structure – thus ideal for characterization of polymers. The role of rheology in solving material, processing and performance problems can be illustrated schematically in figure 17.
The rheology of the melt provides direct information on the processability and relate it to the polymer structure. This rheology-polymer structure relation makes rheology the ideal tool to design materials with specific processing and end-use performance.
References
- Cox, W.P.; Merz, E.H. J.Polym.Sci., 28, 118 (1958)
- Macosko, C.W.; Lorntson, J.M. private communication (1973)
- Meissner, J. presented at Tezukayama College, Nara, Japan, October 1994
- Meissner, J. presented at Tezukayama College, Nara, Japan, October 1994
Acknowledgement
Revised by A. Franck
Click here to download the printable version of this application note.

