Keywords: Rheology, Thermal Analysis, DMA, Polymer, Glass Transition, Tg, Frequency
TA423
Background
Determination of a glass transition temperature (Tg) is a common application of dynamic mechanical analysis (DMA). Dynamic mechanical analysis is a technique in which a sinusoidal oscillatory deformation (strain or stress) is applied to a sample and the corresponding response (stress or strain) of the material is measured as a function of time. This measurement also gives the phase angle shift, δ, of the signals. The storage modulus, loss modulus, and the tangent of the phase angle, tan(δ), are calculated from these measurements. We can use these signals to determine the transition from the brittle glassy state to the rubbery state of a polymer or in a polymeric system. The measurement is typically done with an oscillation test at a single frequency while the temperature is ramped at a controlled rate.
This note will discuss three methods for determining Tg from the temperature ramp; the storage modulus onset, loss modulus peak, and peak of tan(δ). The Tg also depends on the oscillation frequency used. An unambiguous reporting of a Tg, as determined by DMA, includes the method or signal used as well as the oscillation frequency. The relationship between the Tg and frequency are discussed in this note.
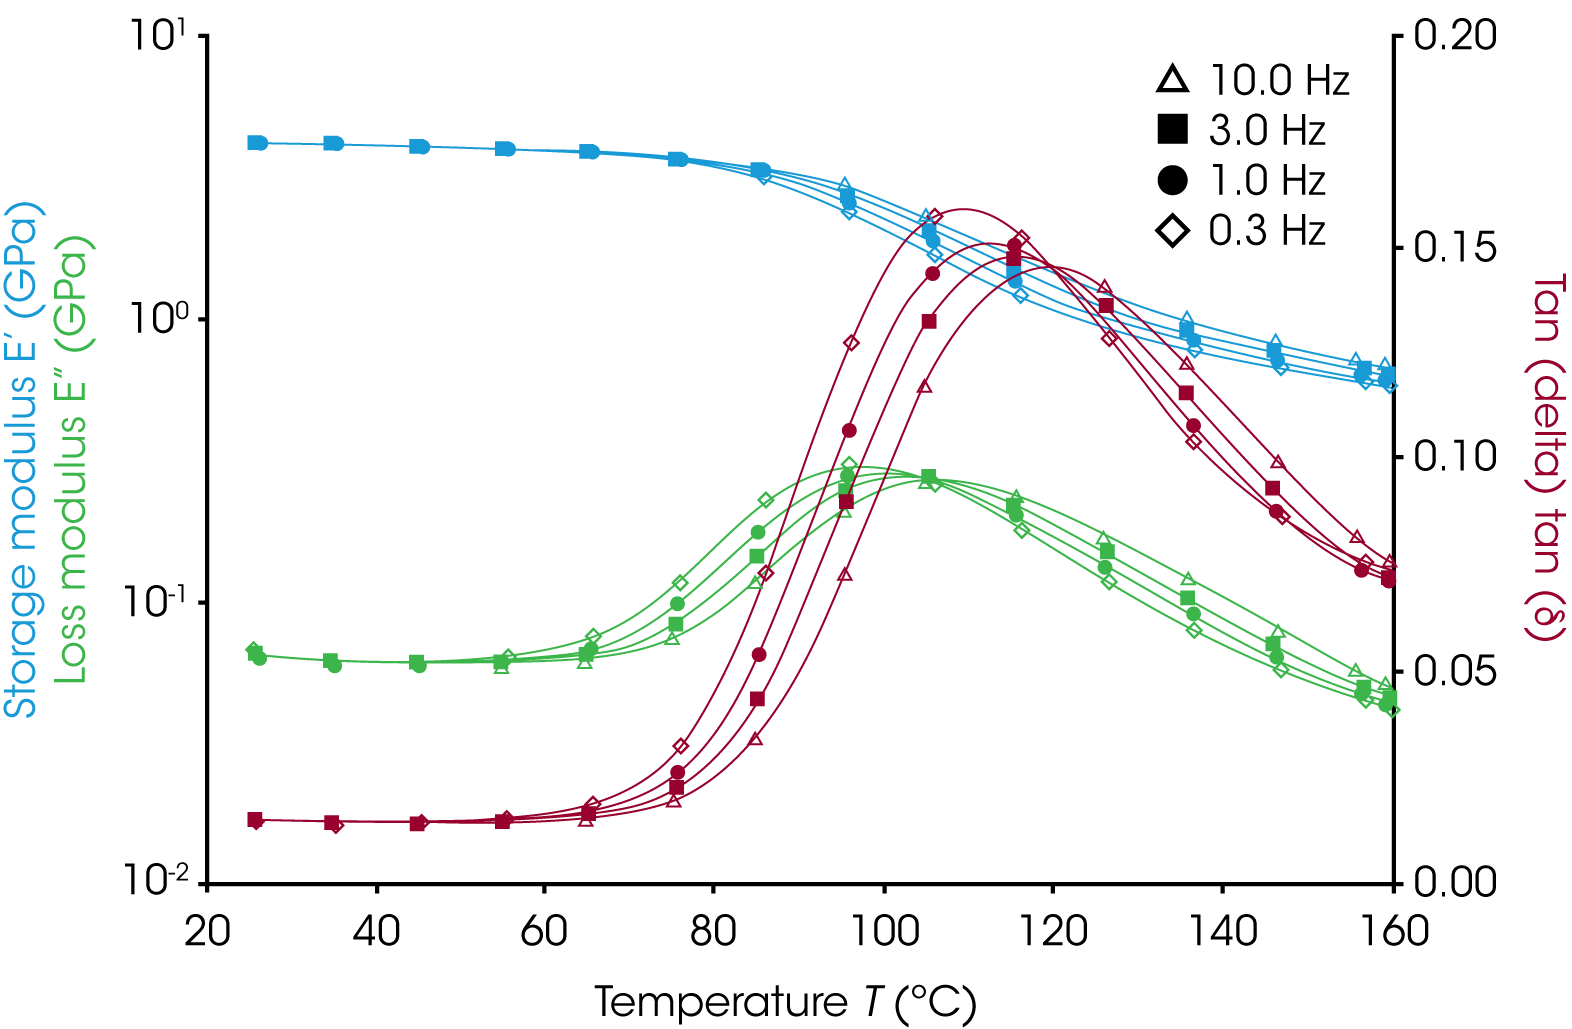
The sample used was a polyethylene terephthalate (PET) film. The general trends in this note hold for polymers and polymer systems.1 The DMA850 was used to do an Oscillation: Temperature Ramp (Multifrequency) on a film of PET with dimensions of approximately 20mm x 6.5 mm x 0.1 mm. The film tension clamp was used for this experiment. The temperature was ramped from ambient to 160 °C at 2 °C/min. This lower ramp rate allows for ample data collection time for tests with low frequencies and/or multiple frequencies. During the ramp the instrument controls the temperature and strain while measuring the stress and phase angle at 10, 3, 1, and 0.3 Hz sequentially. All data were collected in the linear viscoelastic region of PET. The results are shown in Figure 1.

Glass Transitions
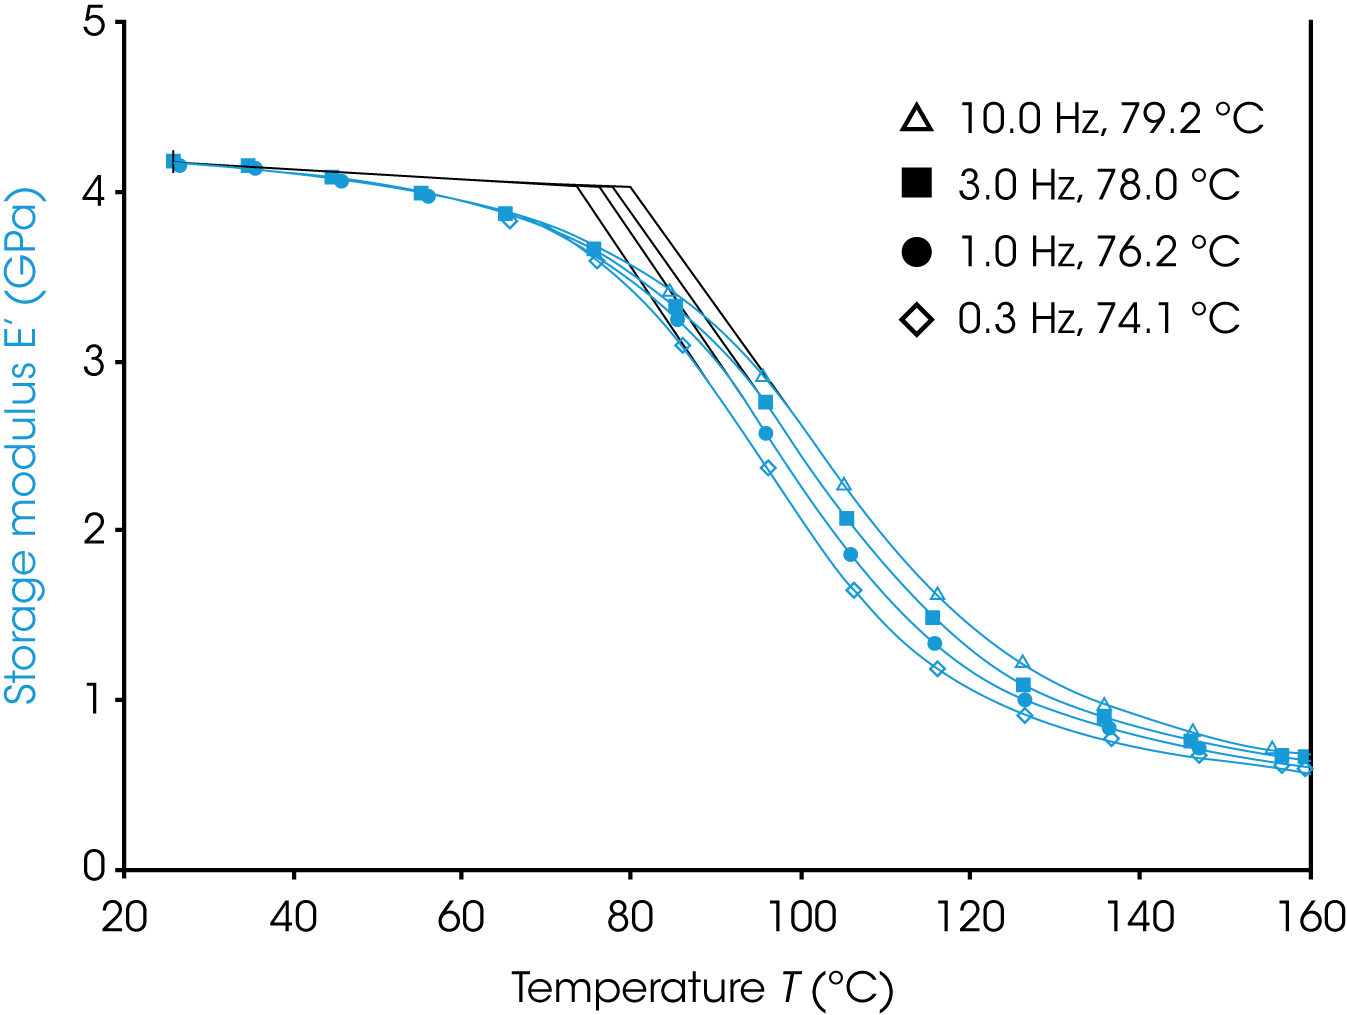
Figure 2 shows the storage modulus response of the film. A Tg is determined from the intersection of two lines that are drawn in two regions; one in the brittle glassy state and the other in the transition region. The tangent of the curve at the two end points was used to create the lines used in this note. Users could also fit a line to a plateau region in the glassy state and a region that is linear with temperature in the transition state. The Tg from the onset of the storage modulus is sensitive to the details of how this intercept is determined and to the oscillation frequency of the test. The storage modulus onset Tg provides a decent measure of when the material begins to soften and lose mechanical strength. Below the glass transition the storage modulus has a very weak dependence on the frequency. Through the transition region we see that the storage modulus is very frequency dependent with higher frequencies having a much higher storage modulus than lower frequencies. The storage modulus is less influenced by the deformation frequency in the rubbery plateau region just after the transition region. Onset glass transitions calculated using the tangent values show an increasing trend with increasing frequency. Conceptually the higher frequencies behave more solid-like (elastic) in the transition region.
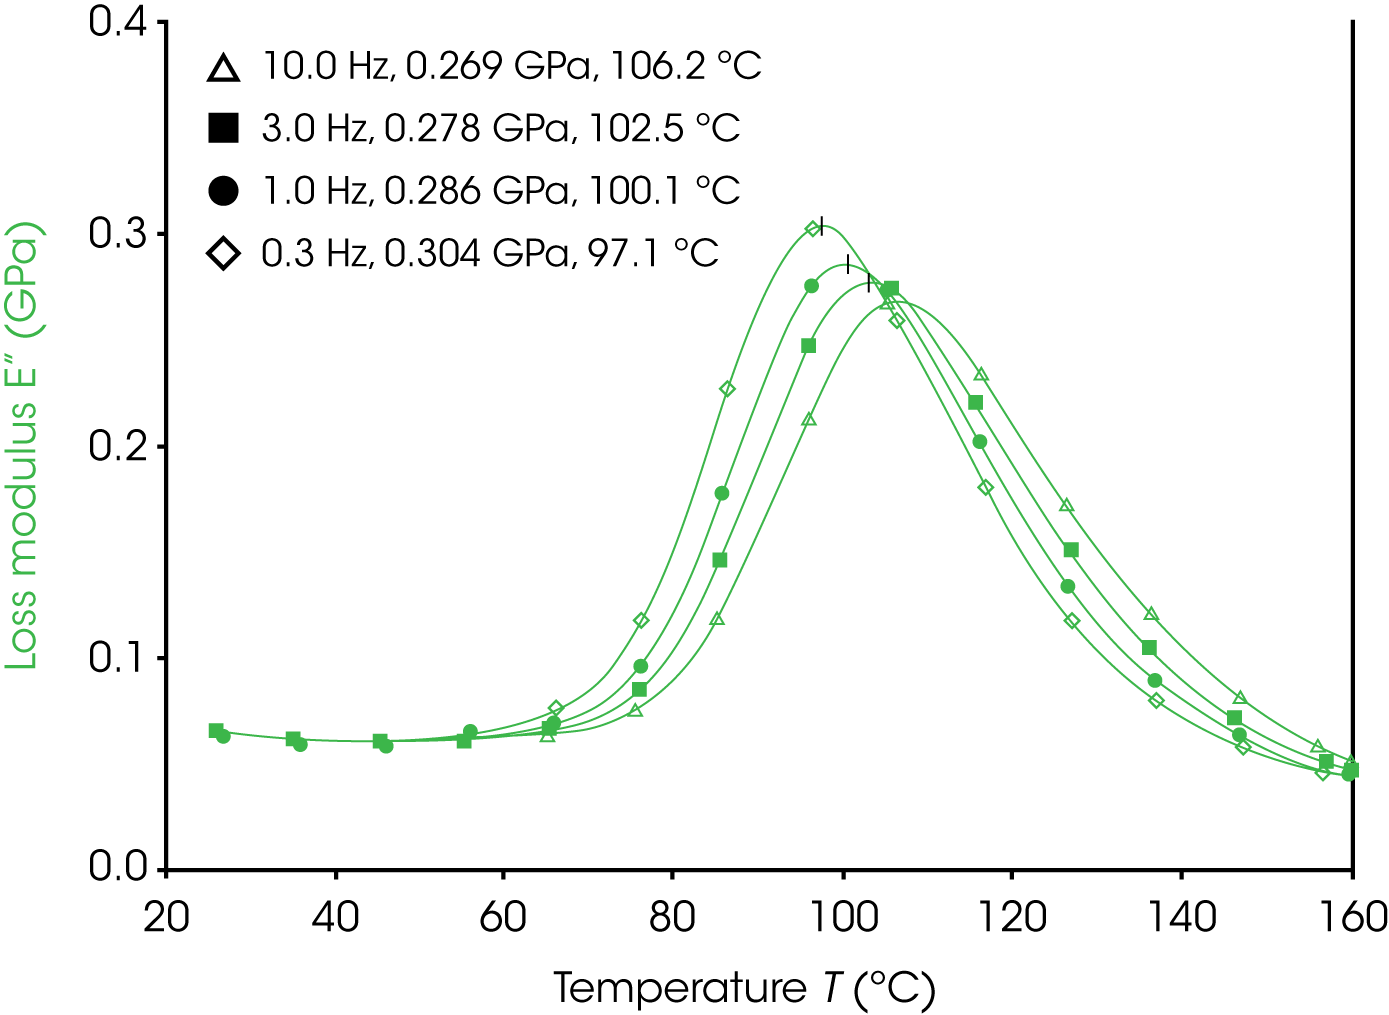
Figure 3 shows the loss modulus of the film. The loss modulus Tg is determined from the peak of the signal in the transition region. Peak maxima are relatively unambiguous and easier to determine than onset points. Higher oscillation frequencies result in higher Tg values with lower and broader peaks. A frequency of 1 Hz is typically used for glass transition measurements with DMA. This frequency provides fast data collection relative to the rate at which the material goes through the transition at a moderate heating rate and transition peaks are typically sharp enough to assign an unambiguous maximum. These Tg occur after the onset glass transition temperature and before the Tg from the tan(δ) signal.
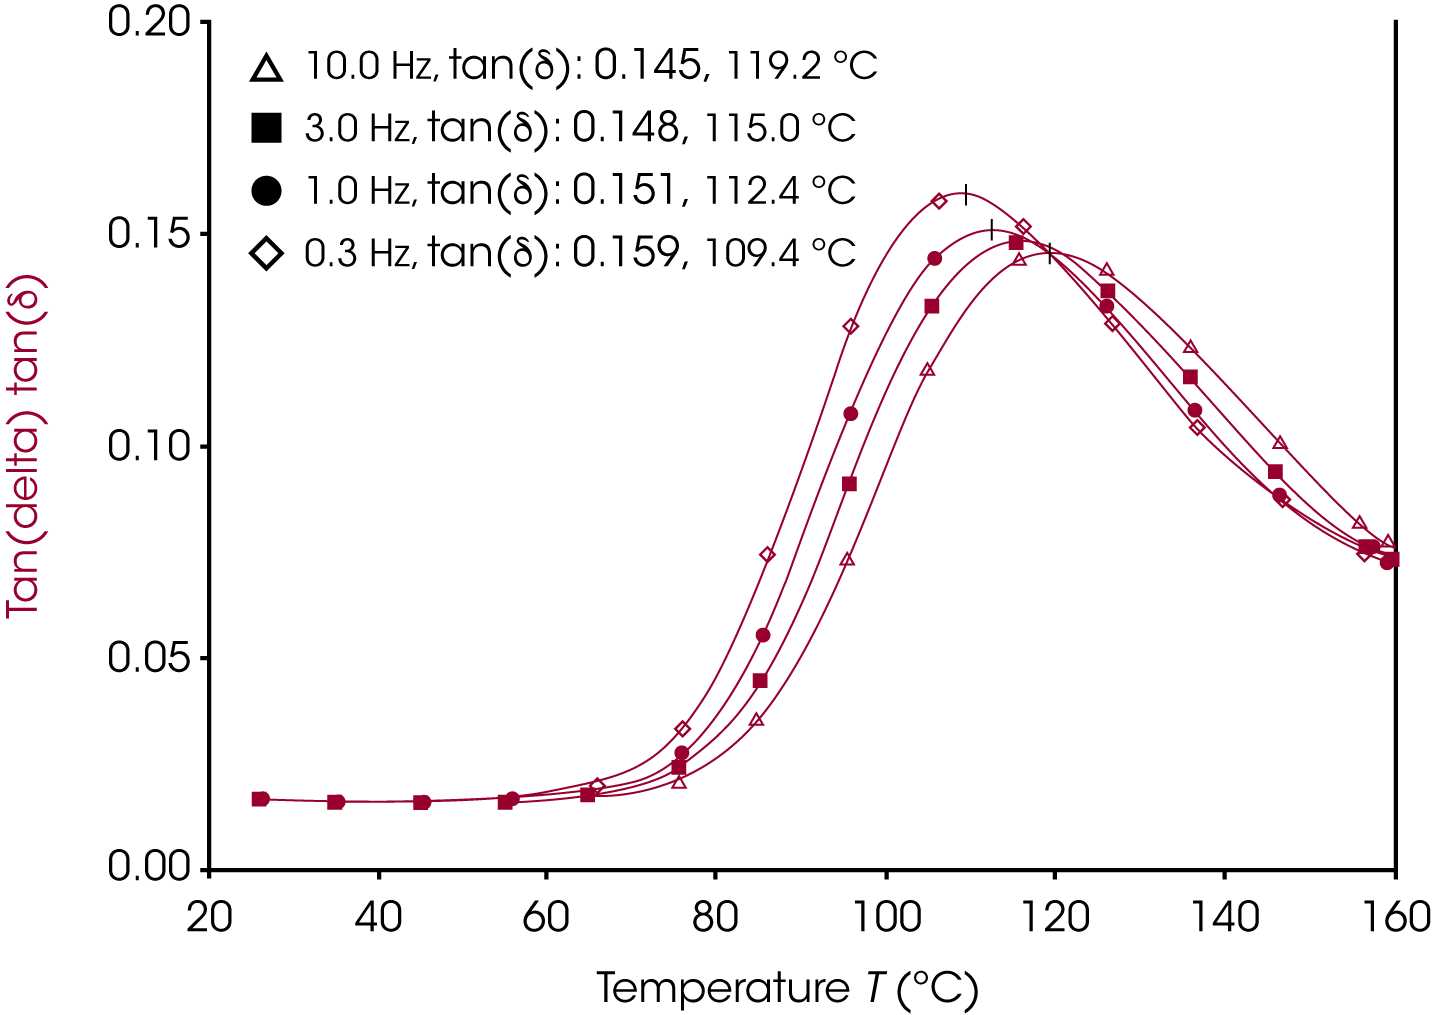
Figure 4 shows the tan(δ) response of the film. The tan(δ) signal corresponds to the ratio of the loss modulus to the storage modulus. The Tg from the tan(δ) signal are determined from the peak of the signal. This signal has a similar response to the frequency of the measurement as the loss modulus. Higher frequencies result in higher Tg with lower and broader peaks. The lower tan(δ) values indicate a more elastic response of the material which is in keeping with the trend that the material behaves more solid-like at higher frequencies. The Tg from the tan(δ) signal occurs at the highest temperature of the three Tg values


Polymer Relaxation
The Tg depends on the timescale of the deformation. Lower frequencies correlate to longer timescale processes and higher frequencies to faster processes. The oscillation measurement can be thought of as a measurement that determines how fast the material is relaxing relative to the deformation. Fast relaxations contribute to viscous behavior and flow. Slower relaxations behave in an elastic way, storing energy like a spring.2 When the polymer is in the glassy state most modes of the polymer relax much slower than the mechanical oscillations that the DMA can perform, so we see that the viscoelastic behavior is largely independent of frequency. The applied deformations are all fast compared to the relaxation of the material. When the material is heated past the glassy state, into the transition state, the molecules in the material have enough energy to begin moving cooperatively. Some relaxation modes will be faster than the accessible deformation oscillations and some will be slower. As a result, we see a very different viscoelastic response from the material depending on the frequency that is used for the experiment. At a high frequency all transitions will occur at higher temperatures relative to a lower frequency measurement and the material in general will be have more elastic response at these higher frequencies.
Conclusion
The glass transition temperatures from DMA can be used to characterize and evaluate a material but are only useful when the method of determination and frequency are reported with the temperature. The material behavior and transition temperature are very sensitive to the oscillation frequency in the transition region.
References
- Seyler, R.J.; Assignment of the Glass Transition, ASTM, September 1994
- Turi, Edith A., Thermal Characterization of Polymeric Materials, Second Edition, Volume I., Academic Press, Brooklyn, New York, 1997, P. 137.
Acknowledgement
This note was written by Kevin Whitcomb, Application Engineer at TA Instruments | Waters .
Click here to download the printable version of this application note.

