Keywords: TGA, Food, Coffee, Thermogravimetric Analysis, Thermogravimetric Analyzers
TA385
Abstract
Coffee beans that have been roasted show differences in their weight loss/decomposition profiles that can provide some insight into how the beans have been processed or stored. The TGA data collected on some roast varieties from two separate brands of coffee beans is complex, but shows distinct differences between the two brands of coffee along with some minor differences between the different types of roasts.
Introduction
The roasting process for green coffee beans into the brown varieties typically found in stores transforms the chemical and physical properties of the beans. Roasting the green beans converts proteins, starches and acids within the beans into slightly different compounds that enhance the flavor and smell of the beans which translates into the resulting cup of coffee. The roasting temperature and the time spent at temperature essentially dictate the roast variety such as espresso or house roast. Typical roasting temperatures range from 180 to 280 °C for time periods of 3 to 30 minutes. Once the firing process is complete, the beans can either be cooled in a vacuum system, which allows the beans to degas slowly or they may be cooled using a fine water mist, which speeds up the cooling time but may introduce absorbed moisture to the bean.
The objective of the investigation conducted in this paper was simply to examine the differences that may exist between different brands roasted coffee beans as well as the different roast varieties from each brand. The roasting process for all of the beans tested was completely unknown. The storage condition of the beans before they were purchased from the store was also an unknown in this study.
Results and Discussions
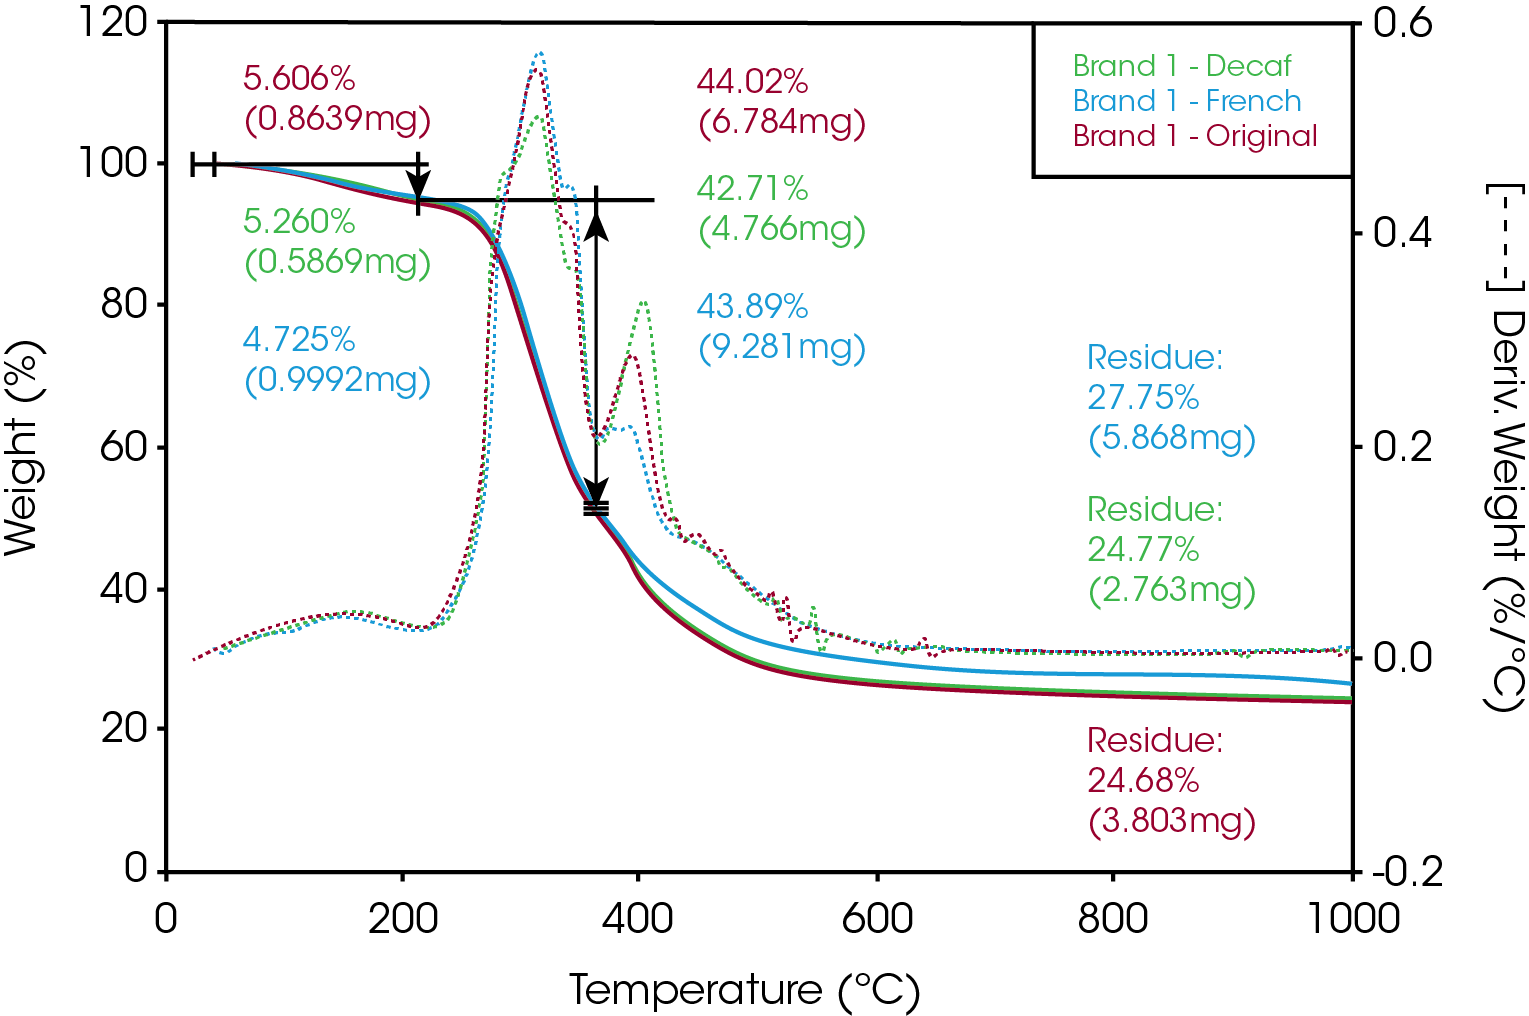
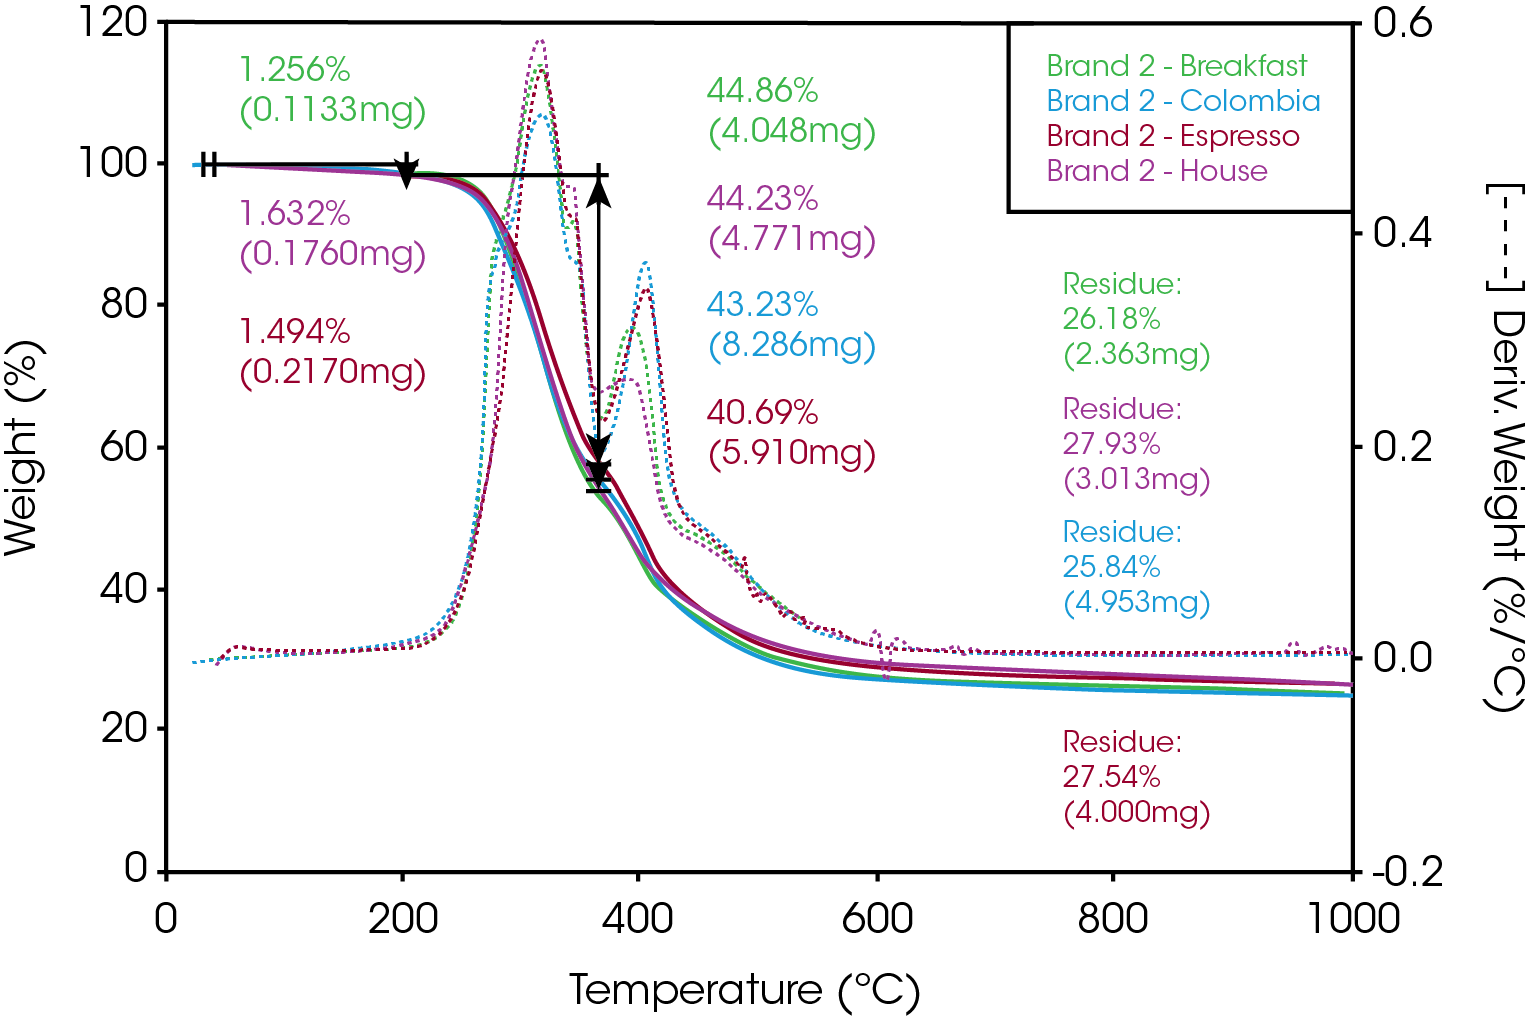
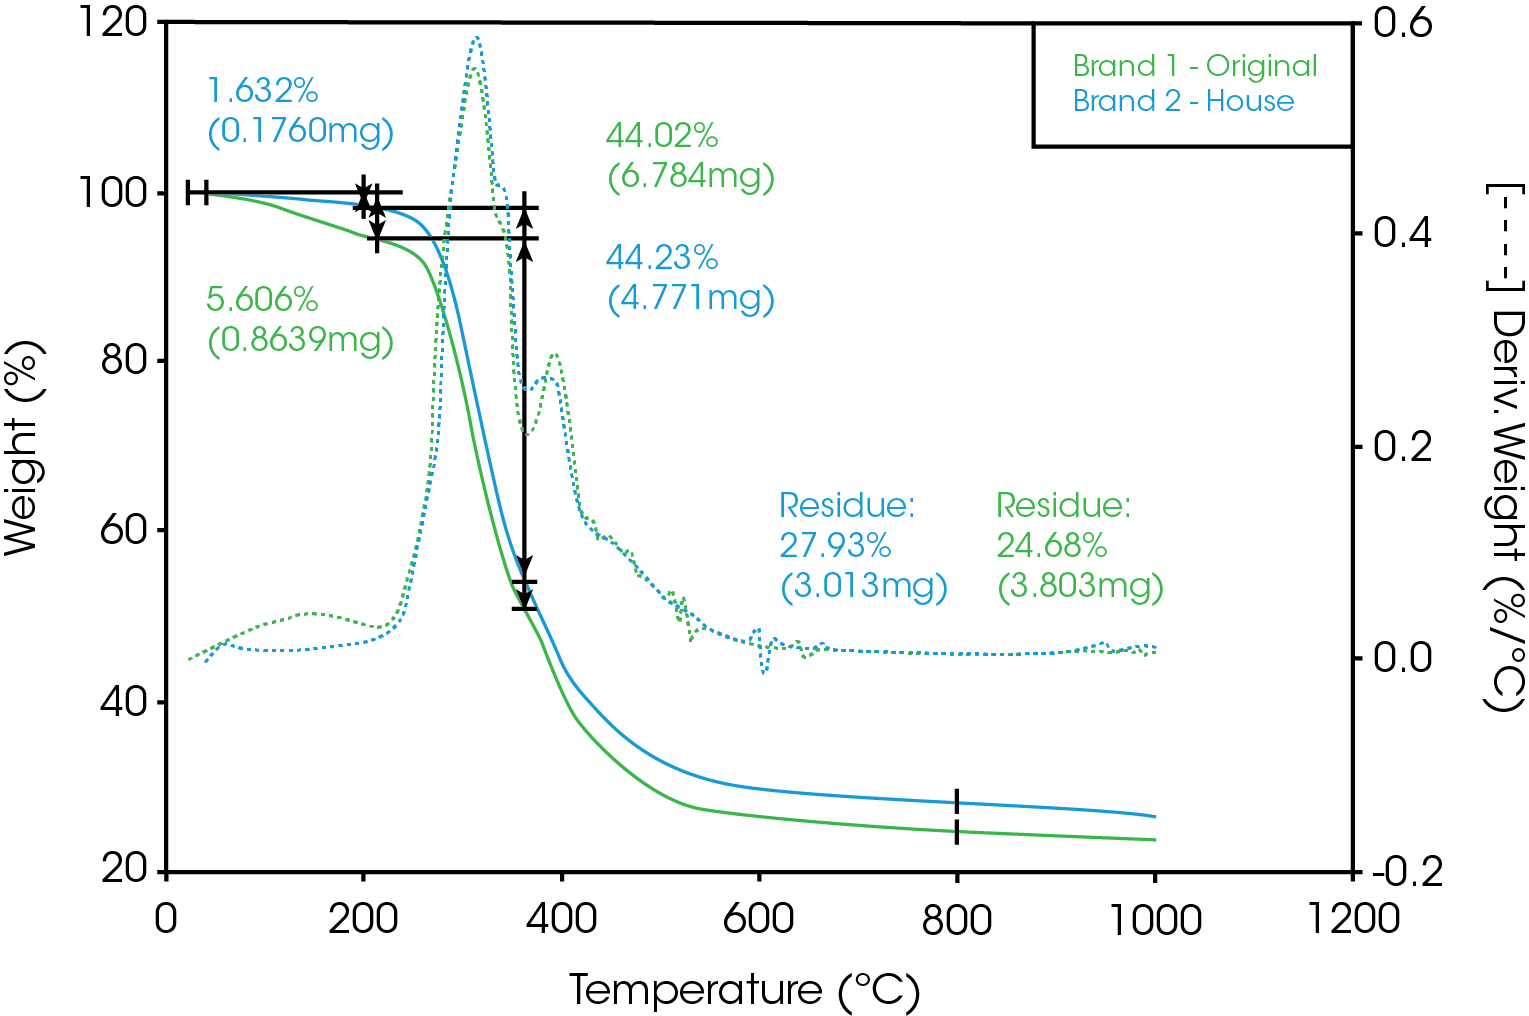
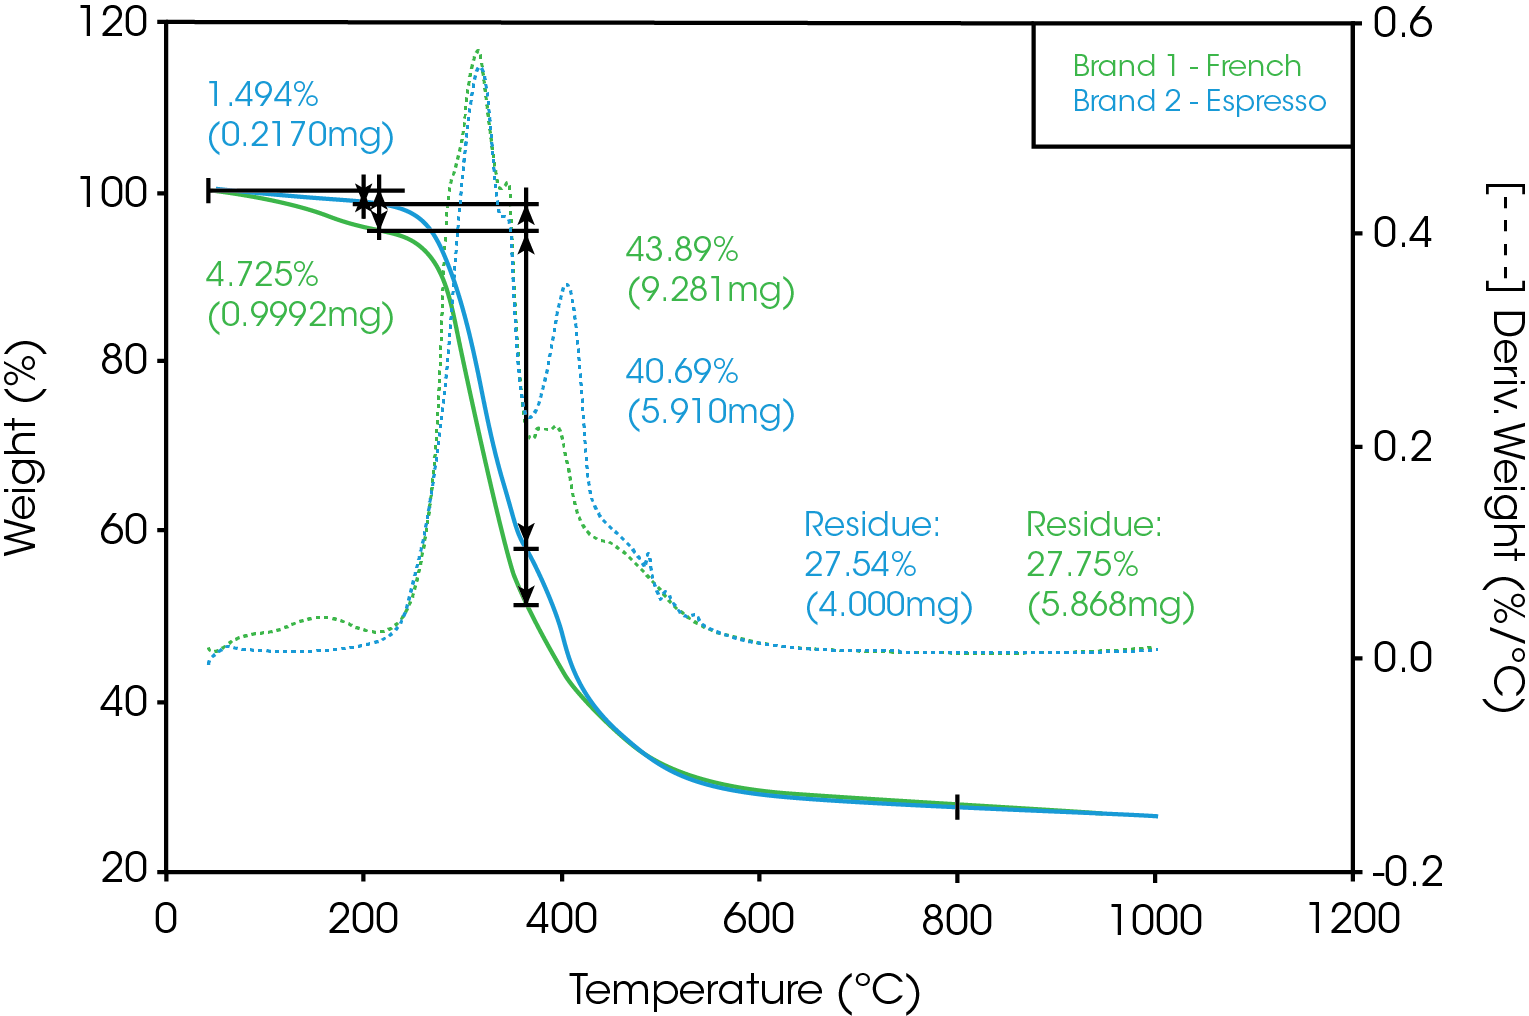
The beans were tested on a Q5000IR TGA using Platinum‐HT pans in a nitrogen environment. The beans were chopped up into small pieces and each pan was loaded with pieces from multiple beans in order to balance out any inhomogeneity. Each sample was tested from room temperature to 1000 °C at 20 deg/min. A comparison of the roast varieties within each brand are shown in Figures 1 and 2. Within each brand, the dark roast (roasted at higher temperatures or longer times), shows a higher residue percentage which could be an indication that the beans had some level of char before testing. The char was most likely produced during the roasting process. A comparison of the lighter roasts and dark roasts from each brand are shown in Figures 3 and 4, respectively. While the general weight loss trends were similar in all the beans, there was a significant difference in the amount of moisture loss between the two brands. This may indicate some differences in storage conditions or cooling methods after the roasting process. Brand 1 is most likely cooled with a fine mist while Brand 2 is cooled under vacuum.


Acknowledgement
Click here to download the printable version of this application note.

