Keywords: Linear viscoelastic region, viscoelastic properties, rheology, DMA, Creep, Stress Relaxation
RH111
Background
This note will describe how to determine the linear viscoelastic region (LVR) in transient tests such as creep and stress relaxation using PDMS as an example material. The concepts below apply to rheological experiments and dynamic mechanical analysis.
The linear viscoelastic region is the region of strains or stresses where the viscoelastic properties of a material are independent of the applied stress or strain. These properties include the relaxation modulus and compliance. The measured or applied stress also has a linear relationship with the measured or applied strain, hence the name “linear region.”
Creep Tests
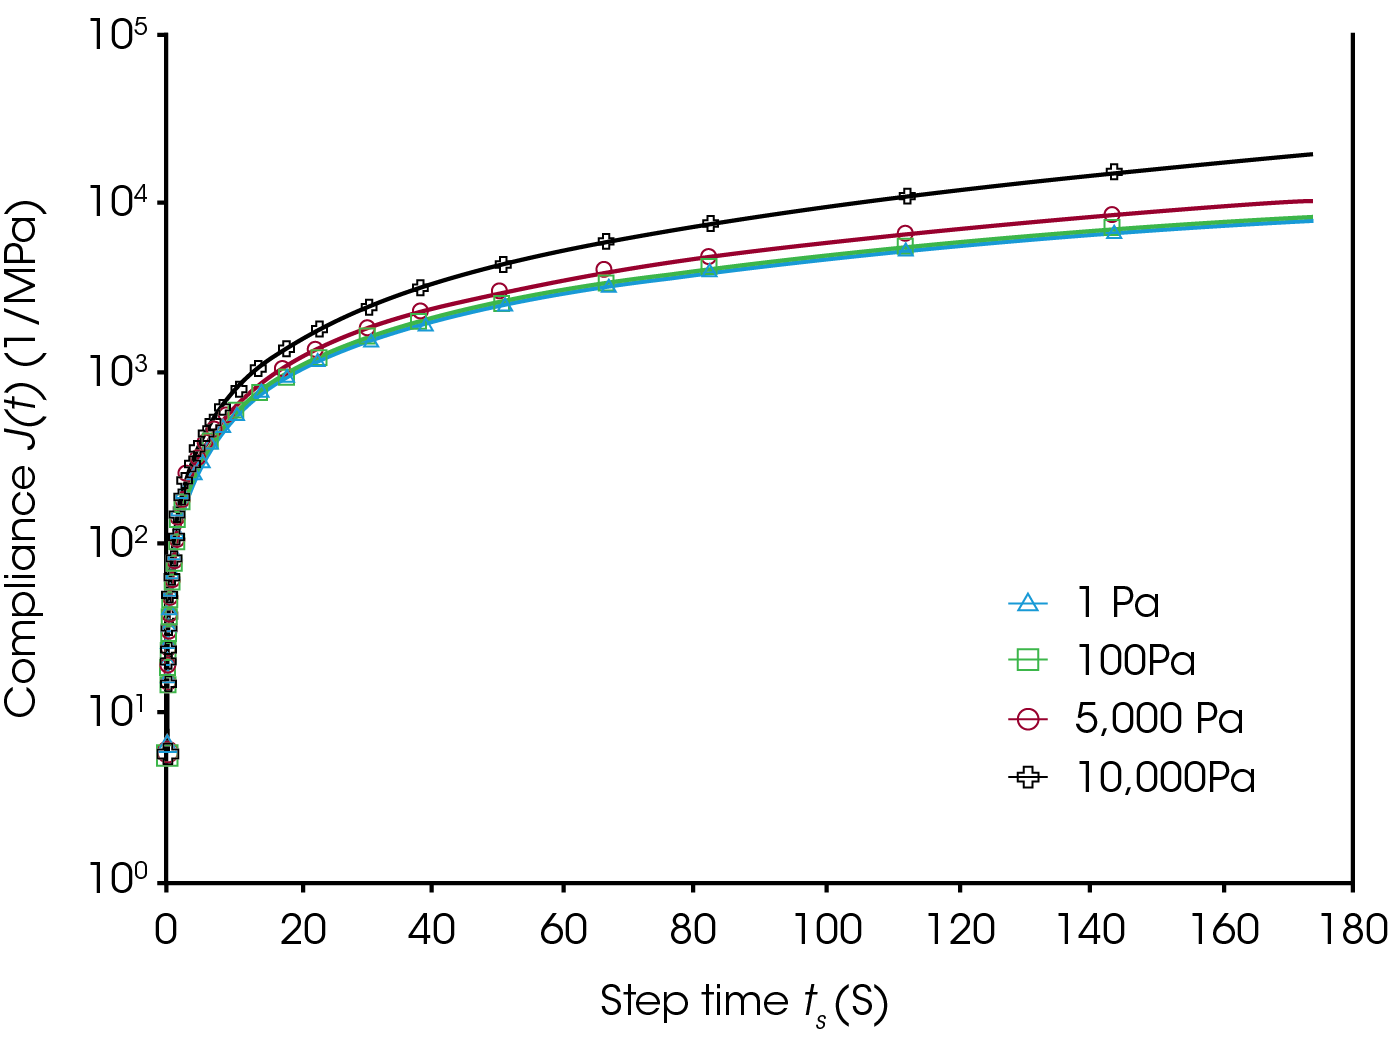
A creep test (Figure 1) observes the strain response to sudden application of stress (that is then held constant) as a function of time. The compliance from a creep test is simply the time dependent strain normalized by the applied stress. The compliance of a material will be independent of the applied stress below a critical stress. The compliance deviates and a higher compliance is typically observed above the critical stress. At a stress of 1 Pa and 100 Pa the compliance overlaps nearly perfectly showing that the critical stress is above 100 Pa. At a stress of 5 kPa the compliance begins to deviate to higher values and this trend continues with 10 kPa. The critical stress from an oscillation test (1 Hz, 30 °C) for this material was ~10 kPa.[1] The critical stress from an oscillation test is not equivalent to the critical stress in a creep experiment but it can provide a starting point to begin assessing what the critical stress is. Not all creep tests need to be done below the critical stress, as there is valid use for applying a stress that the material will see in practical application to measure the creep under use conditions.
Stress Relaxation Tests
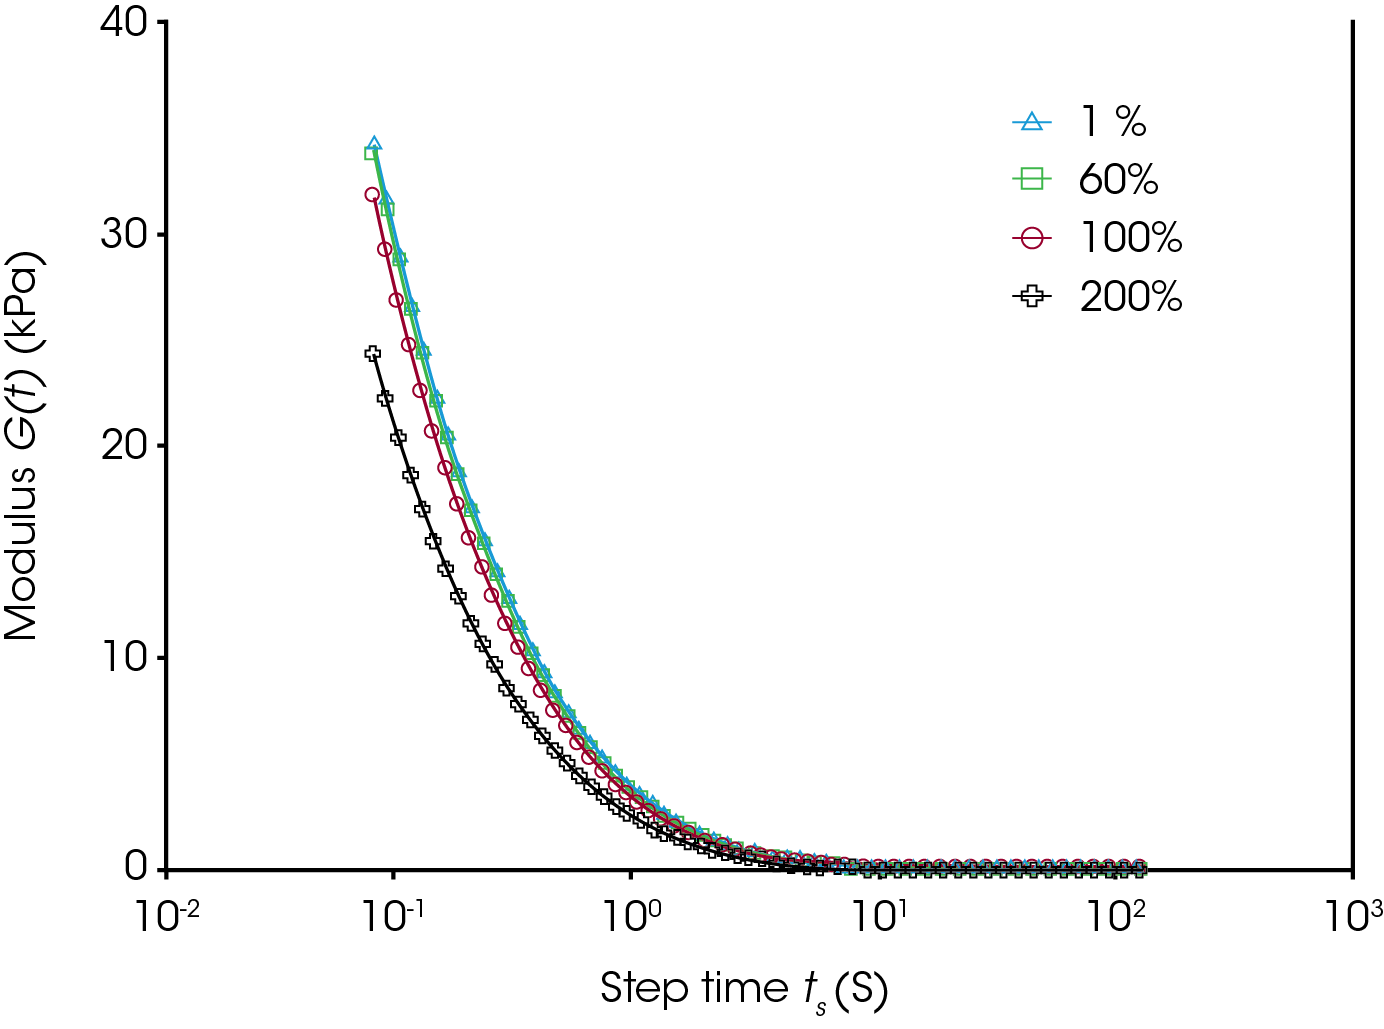
A stress relaxation test (Figure 2) observes the stress response to a near instant change in strain as a function of time. This strain is applied at the start and held for the duration of the experiment. A relaxation modulus is calculated for a stress relaxation test. This modulus is the measured stress of the sample normalized by the initial strain applied. This relaxation modulus is independent of the strain applied when that strain is below the critical strain. At 60 % and below the modulus is independent of the strain and above 60 % the modulus decreases with increasing strain. The critical strain from oscillation experiments for this sample was ~30 % (1 Hz, 30 °C). Again, the critical strain from an oscillation test does not equate to the critical strain for a stress relaxation tests but provides a rough value to begin looking for the critical strain. Similarly, to the creep test, the user may desire to apply a strain based on the intended application of the material rather than within the linear region. Figure 2 shows stress relaxation data from the same PDMS sample used in Figure 1.


Conclusion
Transient tests have a linear viscoelastic region in which the strain and stress are linearly proportional to each other. This is reflected in the normalized variables of compliance and modulus. These variables do not depend on the applied strain or stress within the linear region. Determining and working within the linear region for transient tests is important for determining material properties and time-temperature superposition experiments. There are valid applications outside the linear region in which a stress or strain is set based on the intended use of the material.
References
- Whitcomb, KJ. (2021) Determining the Linear Viscoelastic Region in Oscillatory Measurements https://www. tainstruments.com/pdf/literature/RH107.pdf
Acknowledgement
This application note was written by Kevin Whitcomb, Ph.D, Application Engineer at TA Instruments.
Click here to download the printable version of this application note.

