Keywords: thermal analysis, sorption analysis, sorption analyzers, water adsorption, BET
TA362
Abstract
Adsorption / desorption isotherm data collected from dynamic vapor sorption instruments like the Q5000SA or the VTI-SA, can be theoretically fit to give properties such as surface area or heat of adsorption. This paper illustrates a BET analysis of the adsorption of water on a microcrystalline cellulose sample, Avicel®.
Introduction
In 1938 Brunauer, Emmett and Teller demonstrated that, with the help of a few simplifying assumptions, it was possible to carry out an isotherm derivation for multi-molecular adsorption layers.1 The BET method, as it was termed, has been used mainly for determining the surface area of solids from the nitrogen adsorption isotherm at liquid nitrogen temperatures but the method can be and has been used with other gases and vapors for the same purpose.
The equation in its linear form can be written as:
P/Po/W(1-P/Po) = 1/WmC +((C-1)/WmC)P/Po (1)
Where P/Po is the relative pressure of the adsorbate gas or vapor, W is the mass of the adsorbed gas or vapor per unit mass of adsorbent, Wm is the monolayer capacity or mass of adsorbate needed to form a monolayer on the sample’s surface and C is the so called BET constant and it is directly proportional to the heat of adsorption and therefore a measure of the strength of the interaction between the surface and the adsorbed gas or vapor.
Since data from sorption analysis instruments is usually given in terms of sample weight % and relative humidity, equation 1 can be rewritten in the following manner:
RH*MW/(.01Wt%(100-RH)) = 1/WmC +((C-1)/WmC)RH/100 (2)
Where MW is the molecular weight of the adsorbate. Therefore, a plot of RH*MW/(.01Wt%(100-RH)) vs. RH/100 will give a straight line with slope (C-1)/(WmC) and intercept 1/WmC. From the slope and intercept of the line, we can solve for Wm and C. In terms of the slope and intercept, the values of Wm and C are given by:
Wm = 1/(slope + intercept) (3)
C = slope/intercept + 1 (4)
The BET constant C is related to the net heat of adsorption by the relation C = e(Qn/RT) . Solving for Qn, we get :
Qn R= TlnC (5)
Although the method should be applicable only when the sorption mechanism is strictly one of physical adsorption, the method can and has been applied to the water sorption isotherms of amorphous materials where the sorption mechanism is one of absorption (adsorbate penetrates the solid) rather than adsorption, where the adsorbate stays on the surface of the solid. Although the sorption mechanisms are very different, the general shapes of the isotherm in both cases are very similar (Type II in the IUPAC Isotherm Classification).
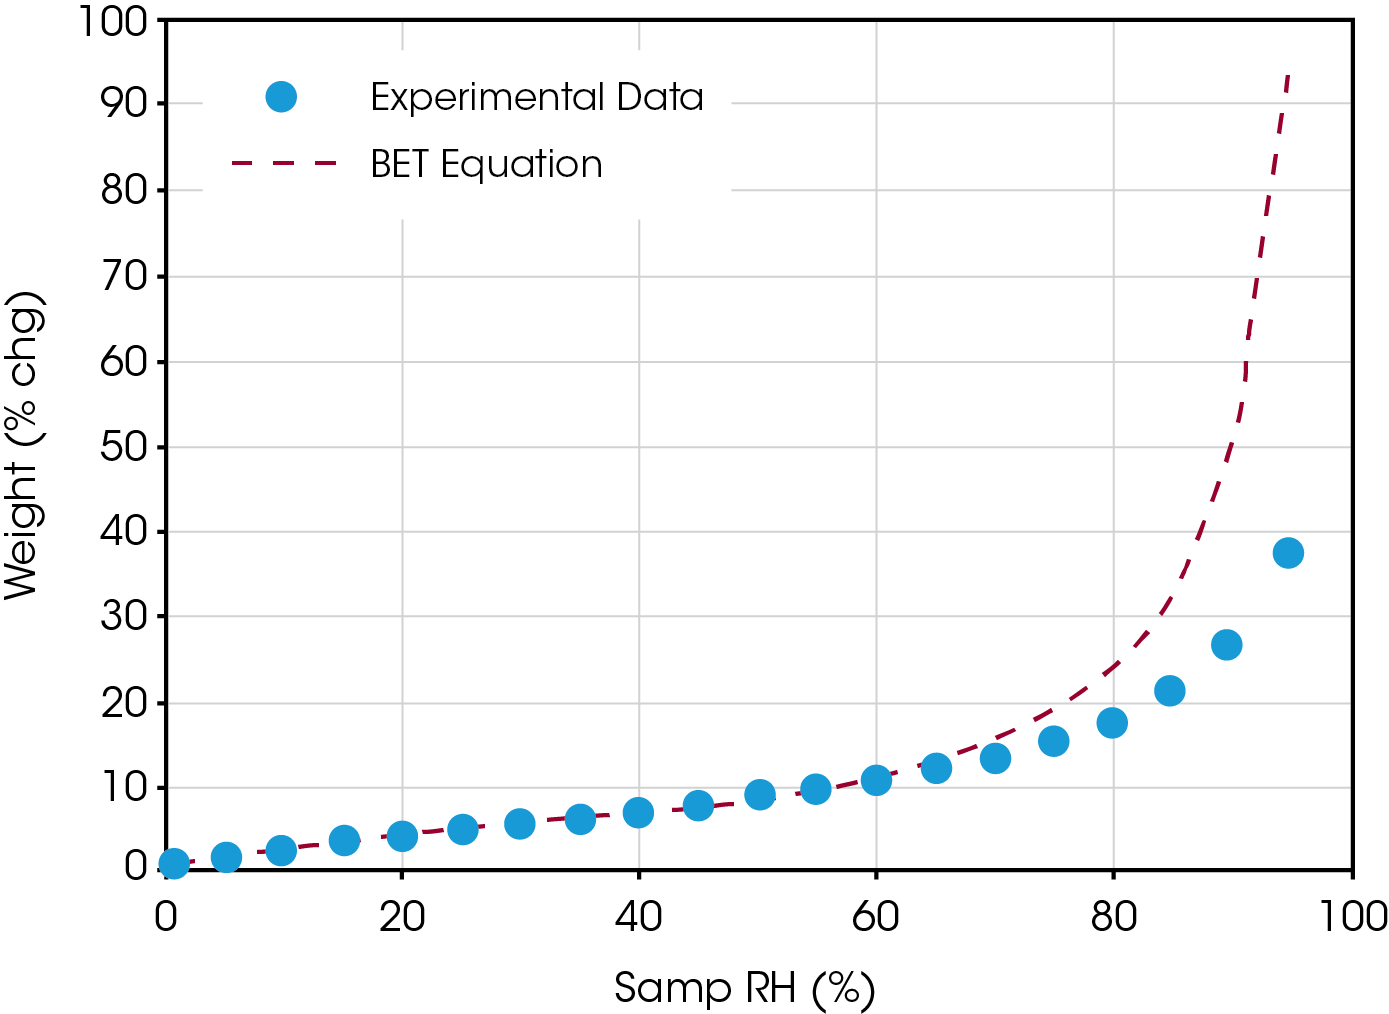
Because of the nature of the BET equation, good correlation between isotherm data and the BET equation is very good up to 50%RH values. Beyond 50%RH the BET equation overestimates the adsorbate uptake. The GAB modification of the BET equation, which is discussed in a separate paper, overcomes this problem and expands the range of correlation to values of RH above 80%.
Results and Discussion
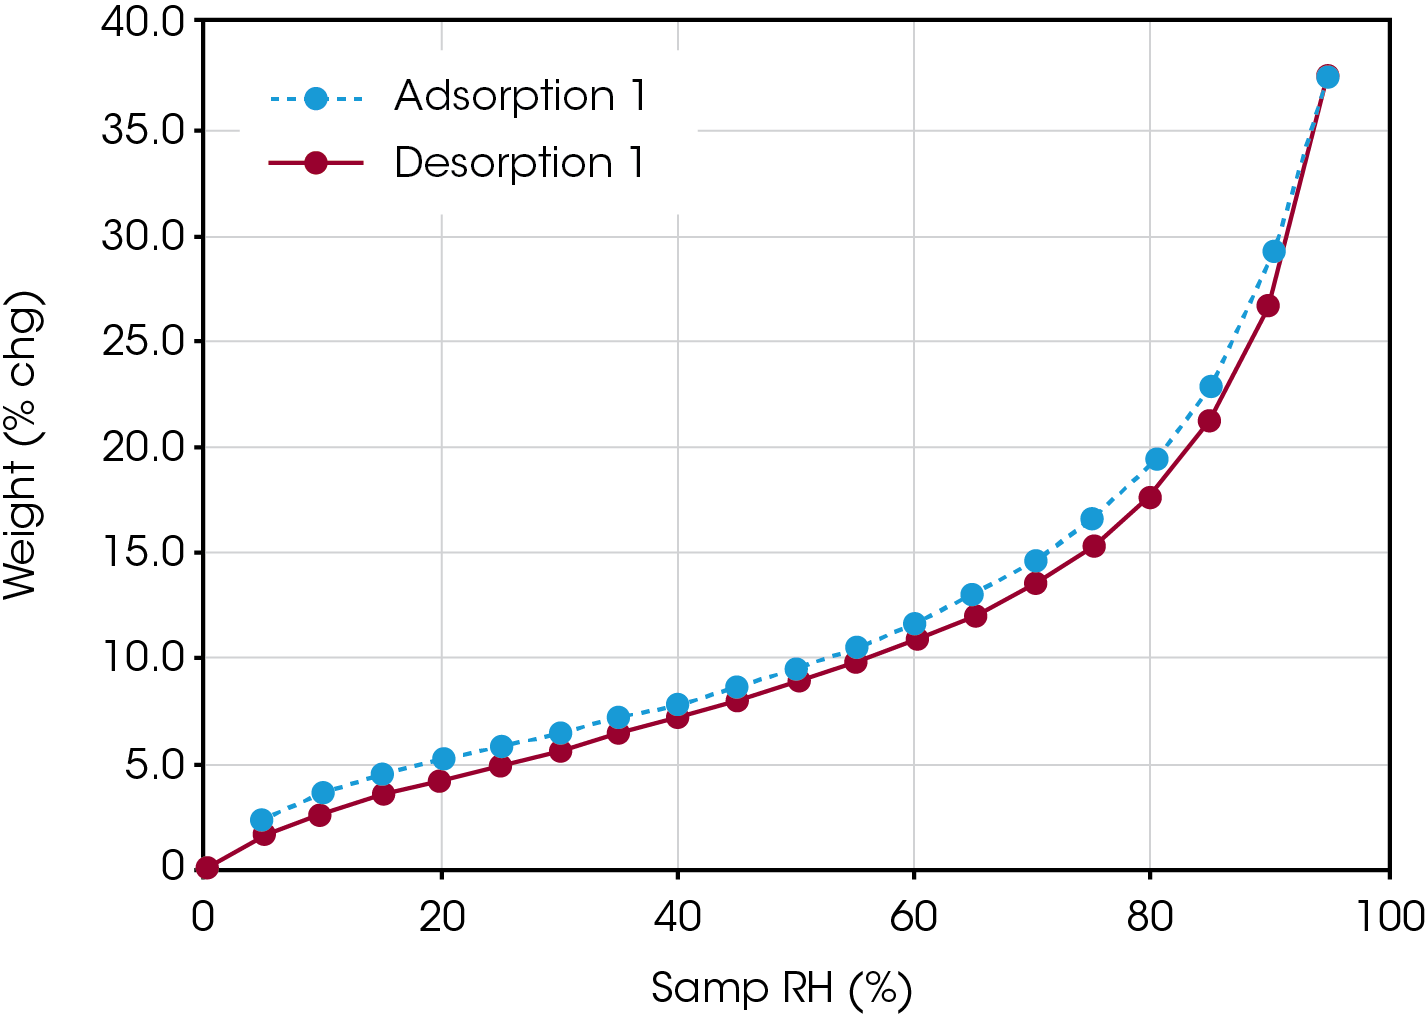
Figure 1 shows an adsorption / desorption isotherm water on Avicel®. A classic Type II isotherm is displayed, with less 15% mass change up to a relative humidity of 70% and then more than 15% mass change from 70-95% relative humidity.
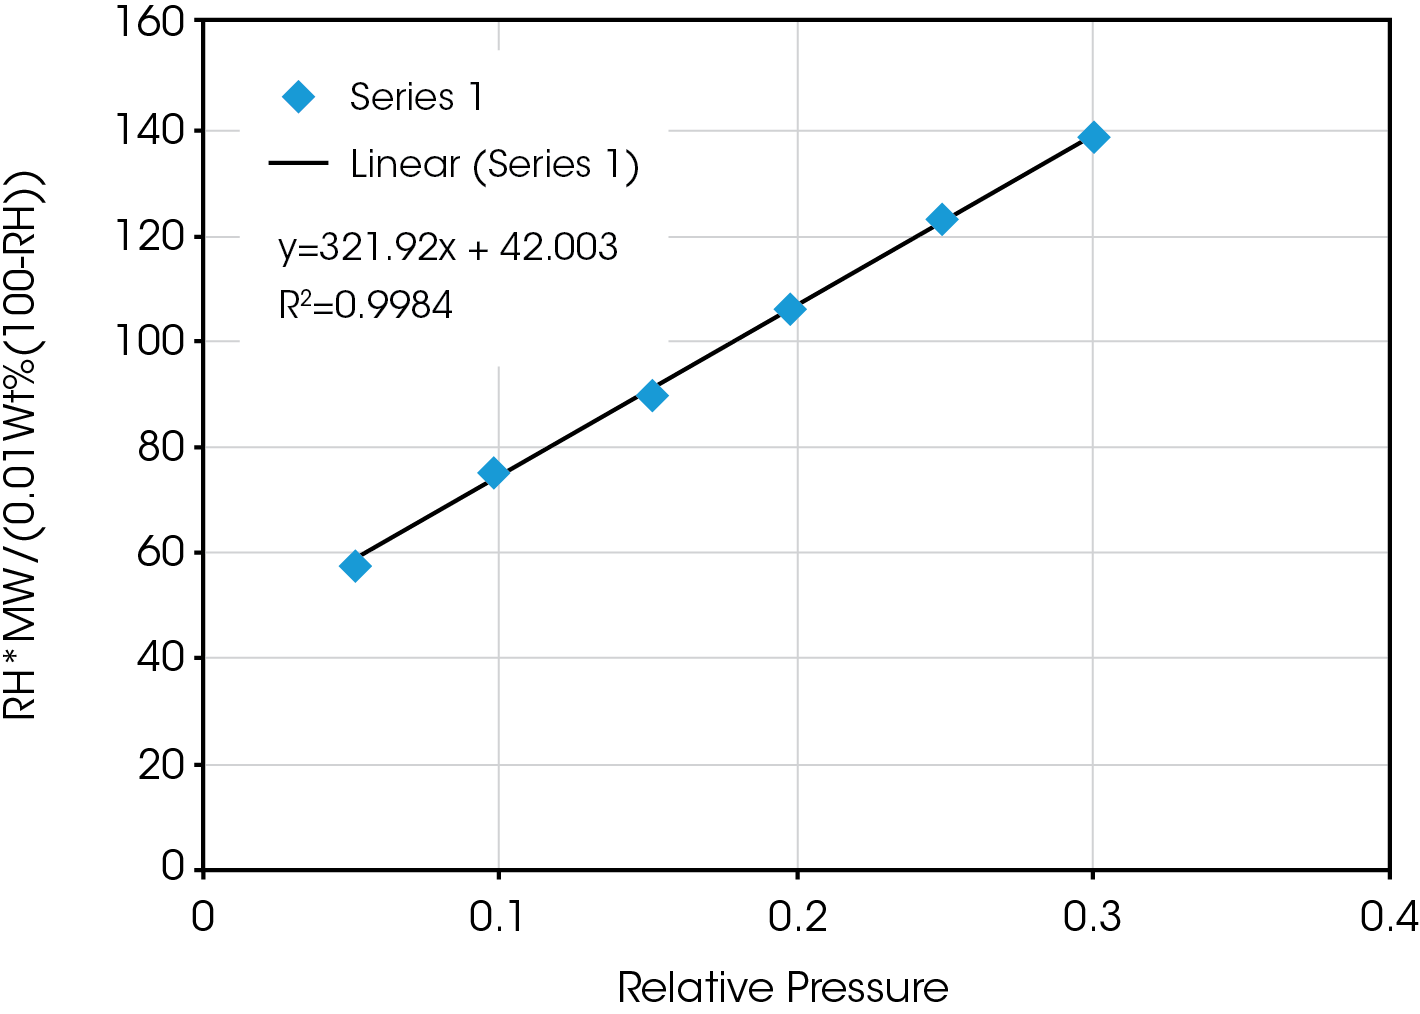
Figure 2 shows the resultant plot of RH*MW/(.01Wt%(100-RH)) vs. RH/100 and the fit to the BET equation. The fit is excellent and produces the following results:
Wm = 1/(slope + intercept) = 0.00275 moles/g
C = slope/intercept +1 = 8.66
Qn = RTlnC = -535.82 J/g
From the monolayer capacity, Wm, the surface area is easily calculated by the following formula:
SA = Wm • N • Am
Where SA is the surface area of the solid, in m2/g, Wm is the monolayer capacity, in moles/g, N is Avogadro’s number, 6.0221×10²³ molecules/mole and Am the cross sectional area of the adsorbate molecule, in this case 12.5×10⁻²⁰ m2/molecule for water. Thus:
SA = (0.00275)(6.0221×10²³ )(12.5×10⁻²⁰ ) = 207 m2/g
Finally, figure 3 illustrates how the BET model works well for humidities less than 50%, but overestimates coverage at higher humidities. It shows a plot of weight % change versus relative humidity, using the calculated constants of Wm and C.


References
- Brunauer, Emmet and Teller, J.Am.Chem.Soc., 60, pp. 686, 1938
Click here to download the printable version of this application note.

