Keywords: MTGA, MDSC, activation energy, decomposition kinetics, thermal stability, PCM, wax
TA406
Introduction
Phase change materials (PCMs) are materials that store and release latent heat which are widely used in applications such as thermal energy storage, building materials, heat pumps, aircrafts, thermal protection of electronic devices, cooling systems, etc. As discussed in a previous Applications Note on the thermal analysis of PCMs (TA405), paraffin and two beeswaxes were studied using standard DSC, standard TGA as well as Modulated DSC®. The melting points, latent heats, heat capacities, thermal stability and the chemical compositions were discussed in that Applications note. Understanding the thermal properties and chemical compositions are essential to the practical applications using PCMs.
This work will be an extension to that Applications note showing two more techniques that can be used to investigate materials’ thermal stability. Because of the outstanding properties of PCM waxes such as their good thermal energy storage capability and good chemical resistance, they are often used in various high-performance thermal systems where high thermal stability is required. The thermal stability is very important for determining their processing and applications as it will impact the final properties of the products such as the upper limit temperature and the dimensional stability. In this study, Modulated TGA (MTGATM) was used to study the thermal decomposition kinetics including the activation energy without any restrictions of any model. Additionally, MDSC with a quasi-isothermal method at a long period of time was used to see changes in heat capacity in order to determine the thermal stability.
Theory of MTGATM on Activation Energy
TGA measures the weight changes in materials. It can be used to obtain important information on decomposition kinetics. The TGA decomposition kinetics method uses the data from multiple experiments run at different heating rates from 1 ˚C/min to 10 ˚C/min to calculate kinetic parameters including Arrhenius activation energy. It was first introduced by Flynn [1] in 1969. ASTM standard Test Method E1641 [2] reports this method in detail. However, due to the multi-experiment method with slow heating rates, the approach can take several days.
The MTGA technique introduced by TA Instruments provides model free kinetic analysis to determine Arrhenius activation energy with one single experiment. It is a useful tool to obtain continuous kinetic information for decomposition and volatilization reactions. ASTM Standard Test Method E2958 [3] outlines the detailed testing procedure for a Modulated ramp TGA test, which is followed very closely in this study. MTGA superimposes a sinusoidal temperature modulation on the traditional underlying heating profile. Evaluation of the rate of weight loss gives an experimental tool to study the kinetics of decomposition reactions. Reaction kinetics are often modeled using two equations. The first of these, the rate equation, describes the relationship between the rate of reaction and amount of material. The second, the Arrhenius equation, describes the temperature dependence. These two equations are commonly combined into a single form:

where α is the reaction fraction, dα ⁄ dt is the rate of reaction, Z is the preexponential factor, f(α) is the kinetic expression, E is the activation energy, R is the gas constant, and T is the absolute temperature. Among the kinetic parameters, activation energy is considered to be the most important because it describes how the reaction changes as a function of temperature. In MTGA, the activation energy is described as:

In this equation, T is the average temperature, A is the temperature amplitude, and L is the ratio of the natural logarithm of the maximum and minimum rate of weight loss taken at adjacent half cycles of the sine wave. It is applicable to any periodic forcing function whose period is sufficiently long to ensure equilibrium between the rate of weight loss and the oscillatory temperature forcing function [4]. This equation is also model free. The sample weight rate-of-change is continuously calculated and recorded as a function of temperature; the activation energy is then determined from the weight rate-of-change at two or more closely spaced temperature regions [3]. Many decomposition and volatilization reactions may be described using first order kinetics where the value for pre-exponential factor Z is determine as:

The pre-exponential factor is the probability that two (or more) molecules will at an energy level greater than the activation energy. It is an indicator of how quickly the reaction happens, or how frequently. Both activation energy and pre-exponential factor parameters are very important and can certainly be used in reaction engineering, process modelling, and optimization process.
Advantages of Using MDSC on Thermal Stability
A Quasi-isothermal MDSC method was used to test the stability of the materials. As mentioned in the previous Applications note, MDSC is a good tool to accurately measure heat capacity as it uses two simultaneous heating rates: one linear heating rate and the other is sinusoidal heating rate. The reversing heat capacity signal shows absolute values of heat capacity. The advantage of this MDSC® approach is that it looks for changes in heat capacity; whereas, TGA and MTGATM are looking at more major decomposition which results in a weight loss. The Quasi-isothermal MDSC method can detect changes in heat capacity of less than 0.01 J/(g·°C). Therefore, by looking at the changes in heat capacity, structural changes in the materials can be detected. When a material starts to lose its crystalline structure, the heat capacity will increase as a result. If the heat capacity stays stable over a long period of time, the material can be considered as thermally stable.
Experimental Conditions
Paraffin and two beeswaxes were investigated using a TA Instruments TGA 5500 and a TA Instruments DSC 2500 in N2 environment. Sample mass was controlled at 10-12 mg for all the tests. All MTGA experiments were carried out at 1 ˚C/min with an amplitude of 5 ˚C and a period of 200s from room temperature to 600 ˚C. The value of 5% mass loss of the specific decomposition step is commonly used in TGA and accelerated lifetime testing as the failure criteria per the ASTM E2985 method [3]. When there is no mass loss, the value for activation energy is set to zero. Once the onset of mass loss is detected, calculation of the kinetic parameter is initiated [4]. Calculation of the activation energy and the log pre-exponential factor was executed in Trios software. Below is an MTGA method with the recommended parameters:
- Modulate Temperature 5 ˚C for 200s
- Ramp 1 ˚C/min to 600 ˚C
Quasi-isothermal tests were carried out using hermetic pans with 200 second period and ±2 °C amplitude at 125 ˚C. 125 ˚C was selected because it is only about 10 ˚C below the temperature where these waxes start to decompose, which will provide good information on their thermal stability. The Quasi-isothermal MDSC method used in this study is provided below:
- Data Off
- Equilibrate 10.00 °C
- Modulate Temperature 1.00 °C for 120.0 s
- Isothermal 5.0 min
- Data On
- Isothermal 15.0 min
- Data Off
- Increment 10.00 °C
- Repeat 5 for 6 times
Results and Discussion
MTGA Results
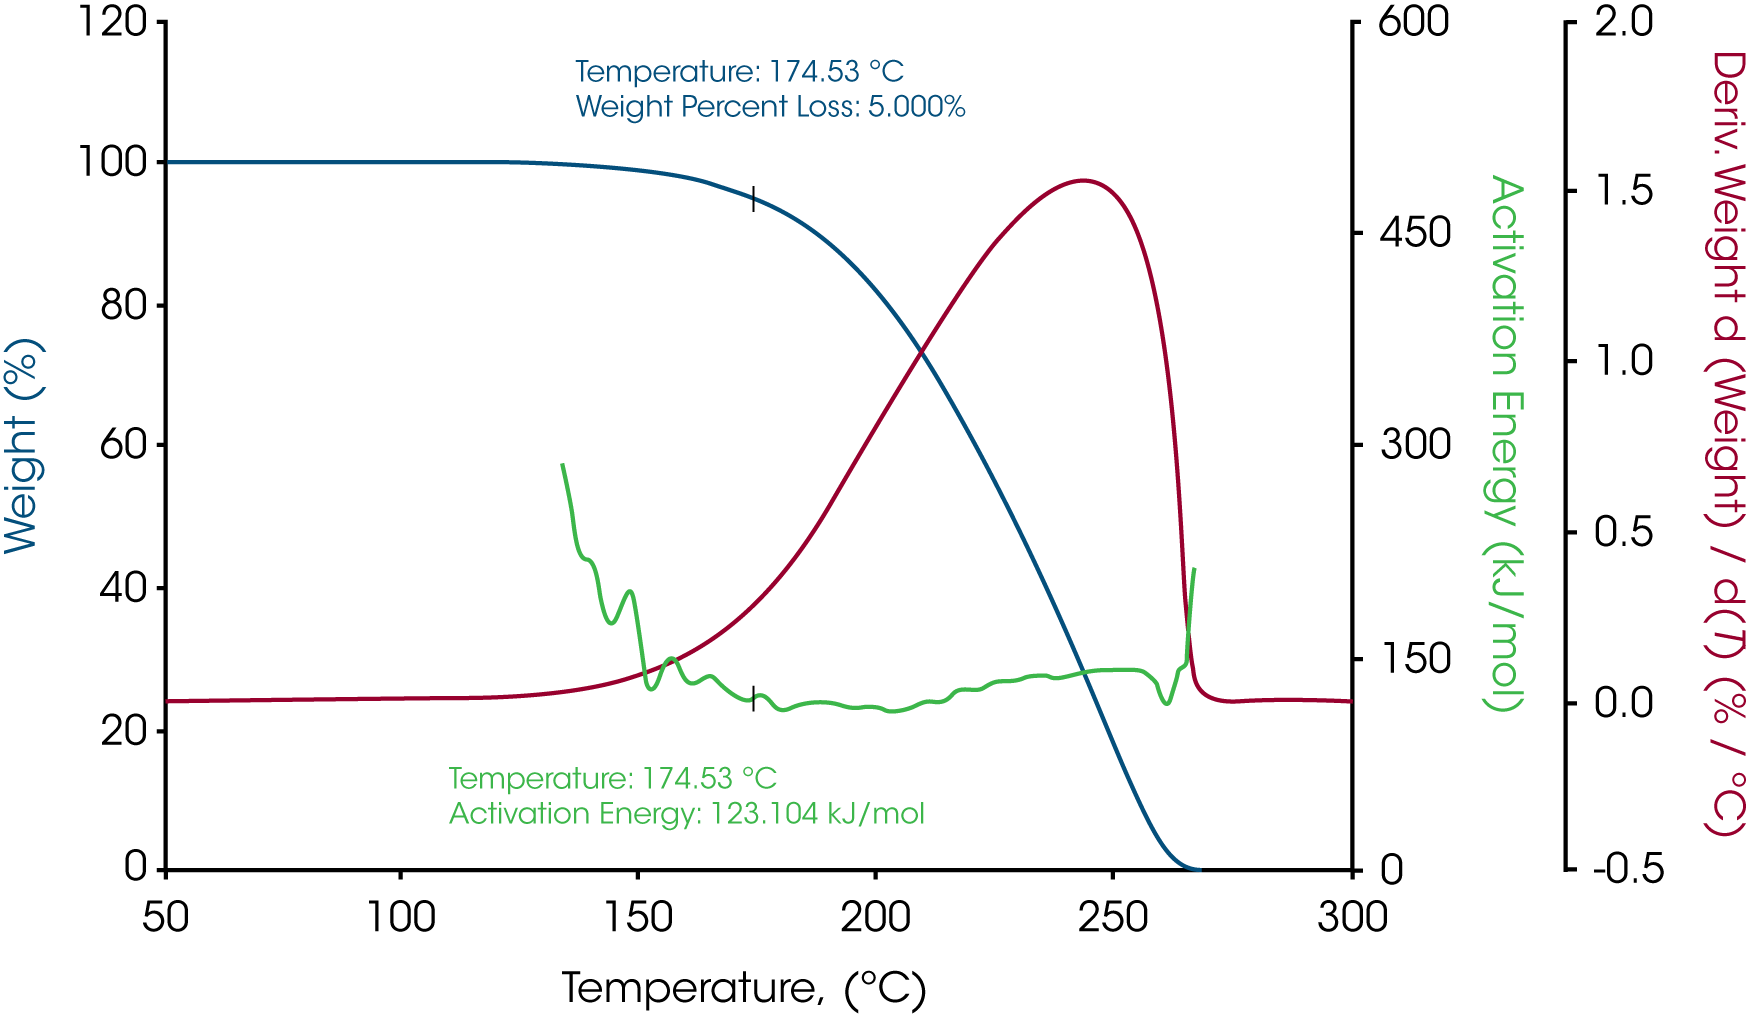
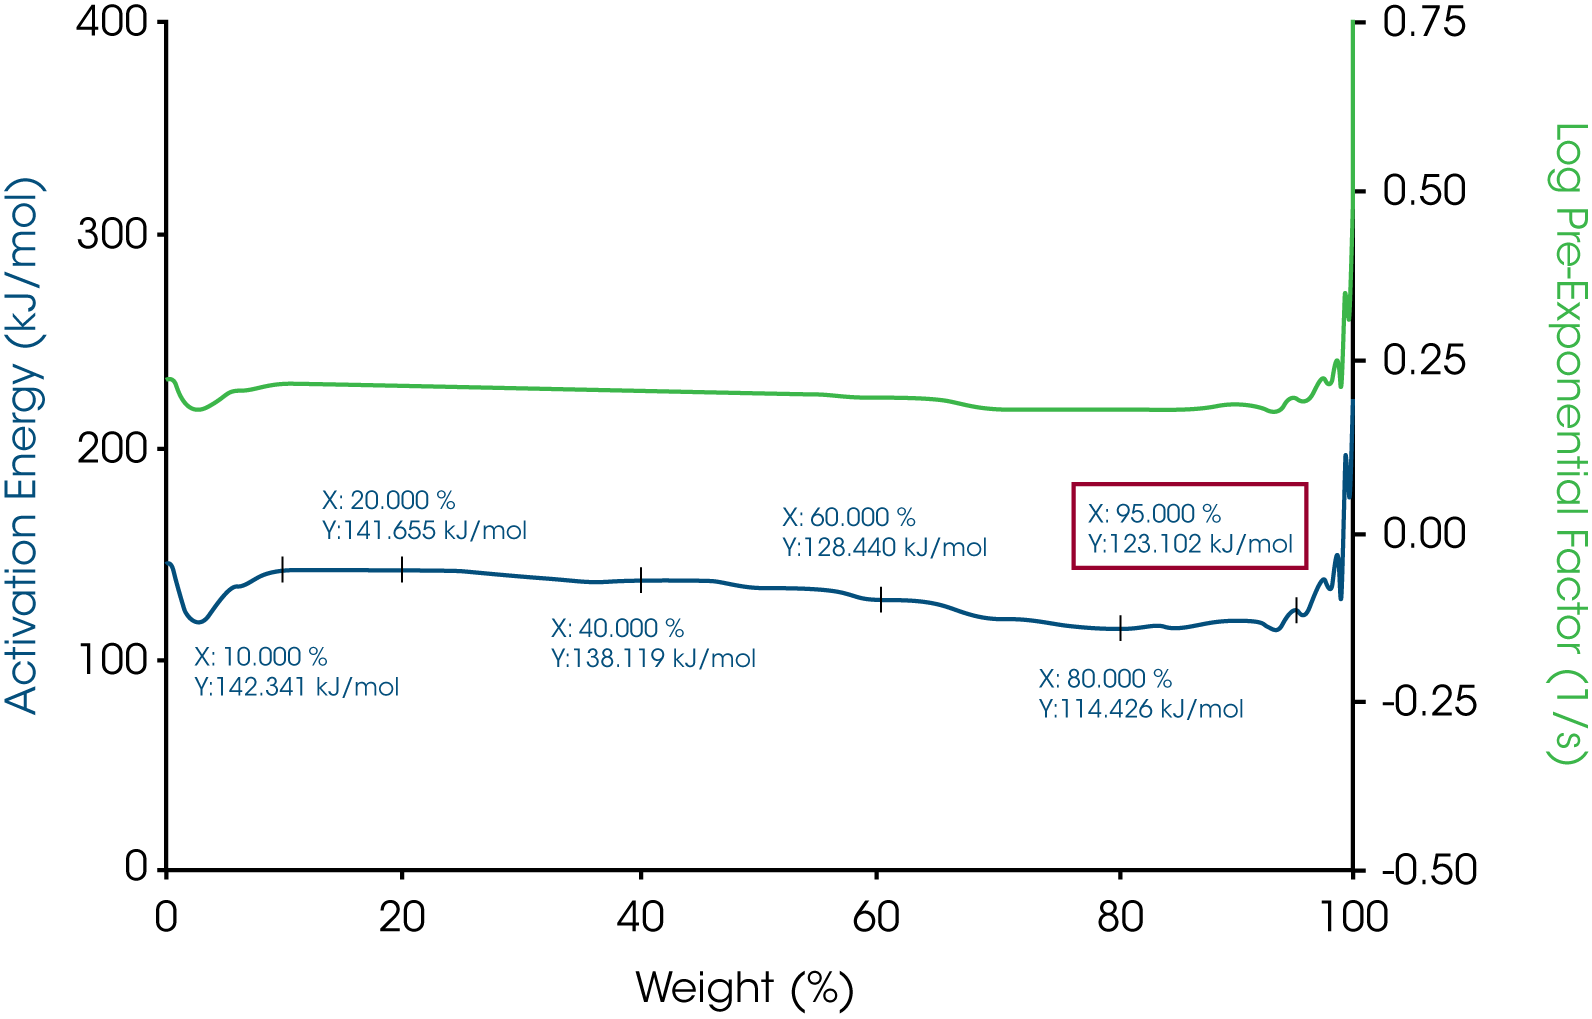
The MTGA results of all the samples are shown in Figures 1, 3 and 5. The activation energy was calculated at 5% weight loss. Paraffin gives a fairly flat activation energy curve during the entire decomposition as shown in Figure 1. At 5% weight loss where the temperate is 174.53 ˚C, the activation energy is 123.104 kJ/mol. Figure 2 shows the activation energy versus weight % for paraffin. Activation energy at different conversions can be easily calculated in Trios. At the same time, the pre-exponential factor Z is plotted on Y2 Axis, which is also easy for calculation at different levels of decompositions.
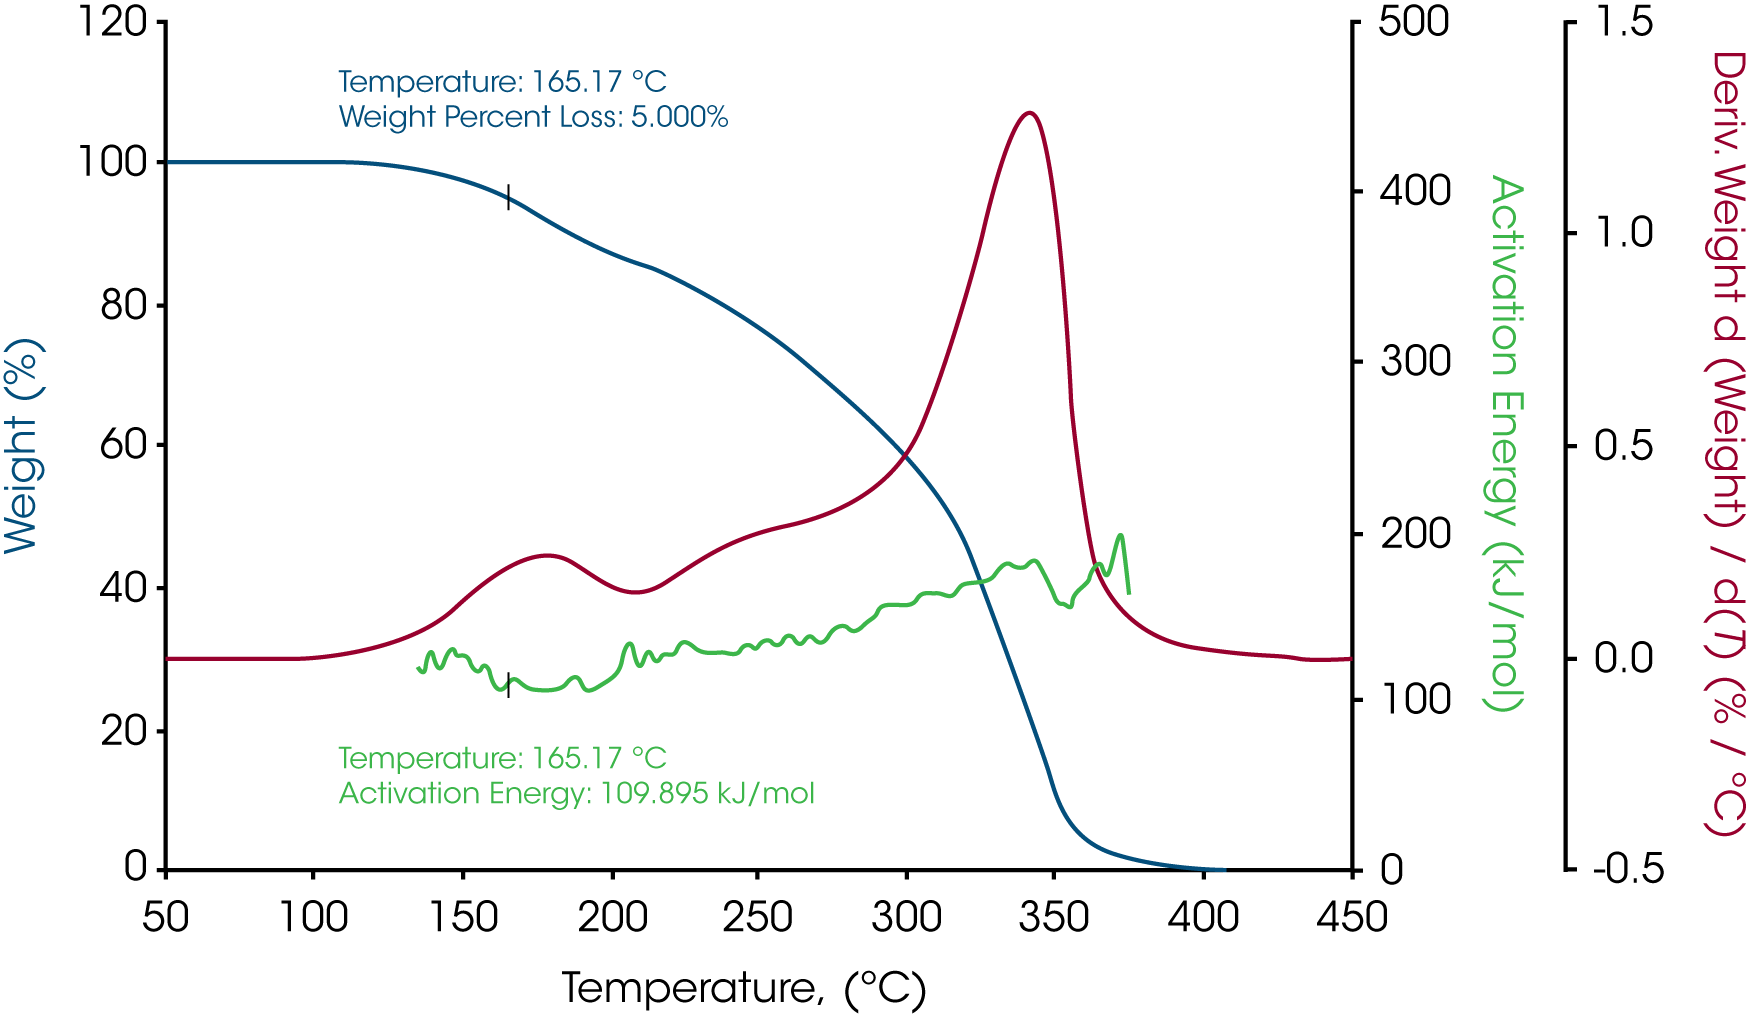
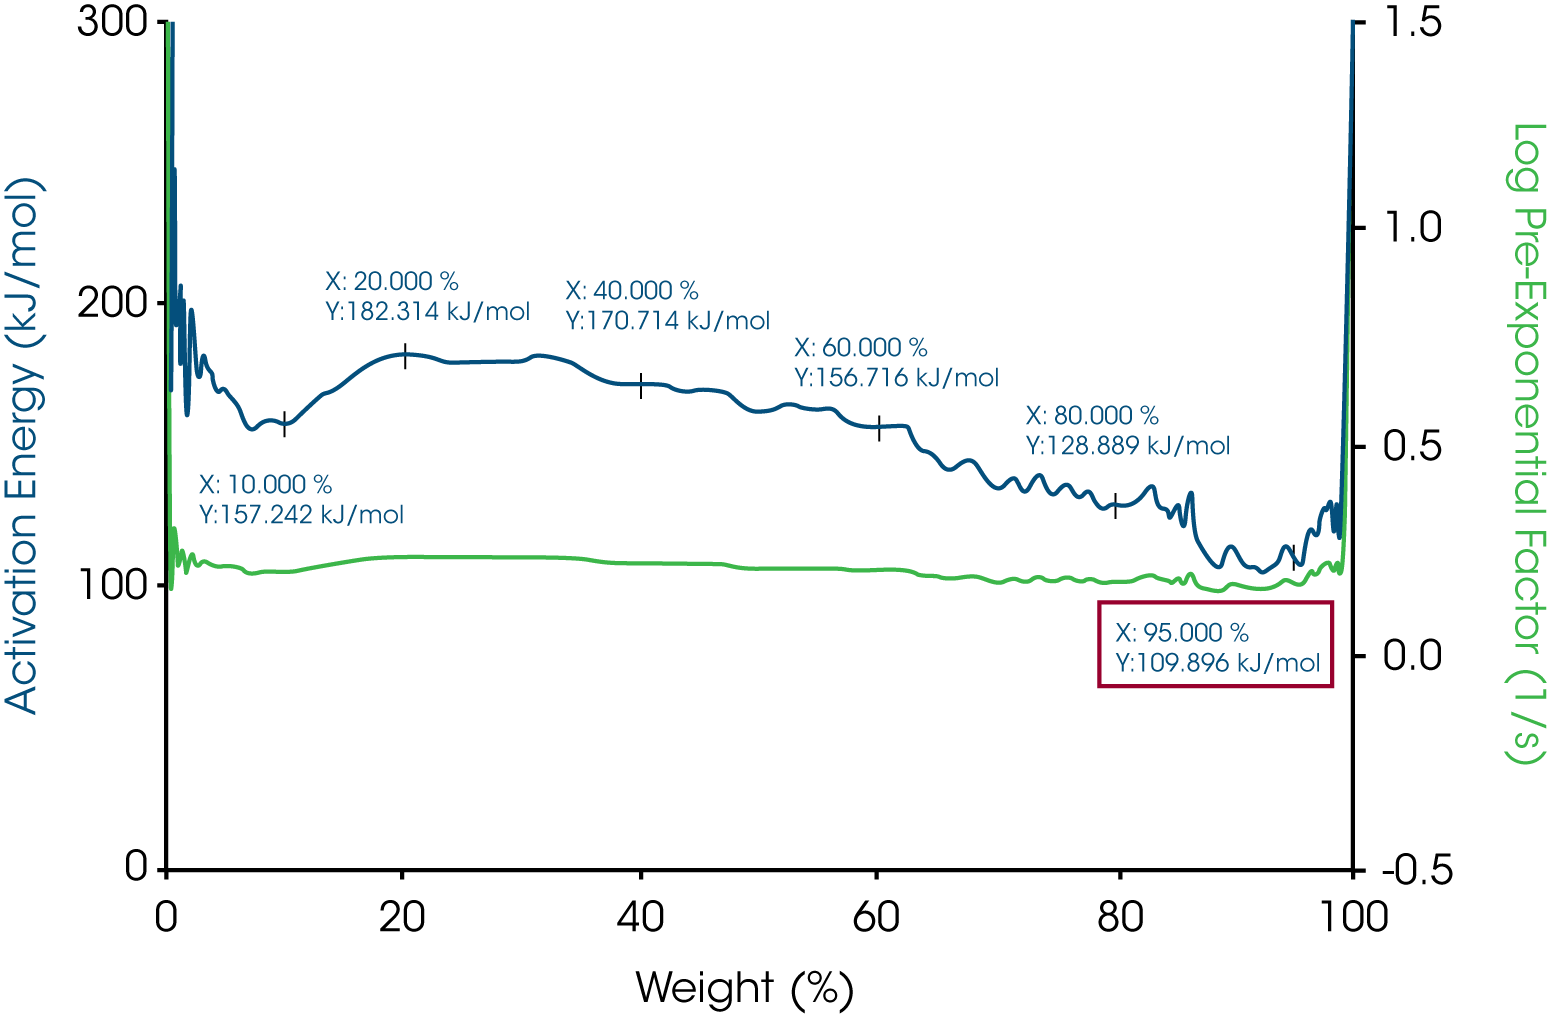
The activation energy of white beeswax slowly increases with temperature during the decomposition process as shown in Figure 3. During the entire weight loss, there are three stages of weight loss which suggests the beeswax contains different phases. At 5% weight loss where the temperature is 165.17 ˚C, the activation energy is 109.895 kJ/mol. Similarly, the activation energy of yellow beeswax slowly increases during the decomposition process as well (see Figure 5). Weight loss profile indicates that it has multiple components. At 5% weight loss where the temperature is 187.27 ˚C, the activation energy is 121.692 kJ/mol. The activation energy goes up to 191.974 kJ/mol as the last phase in the beeswax decomposes.
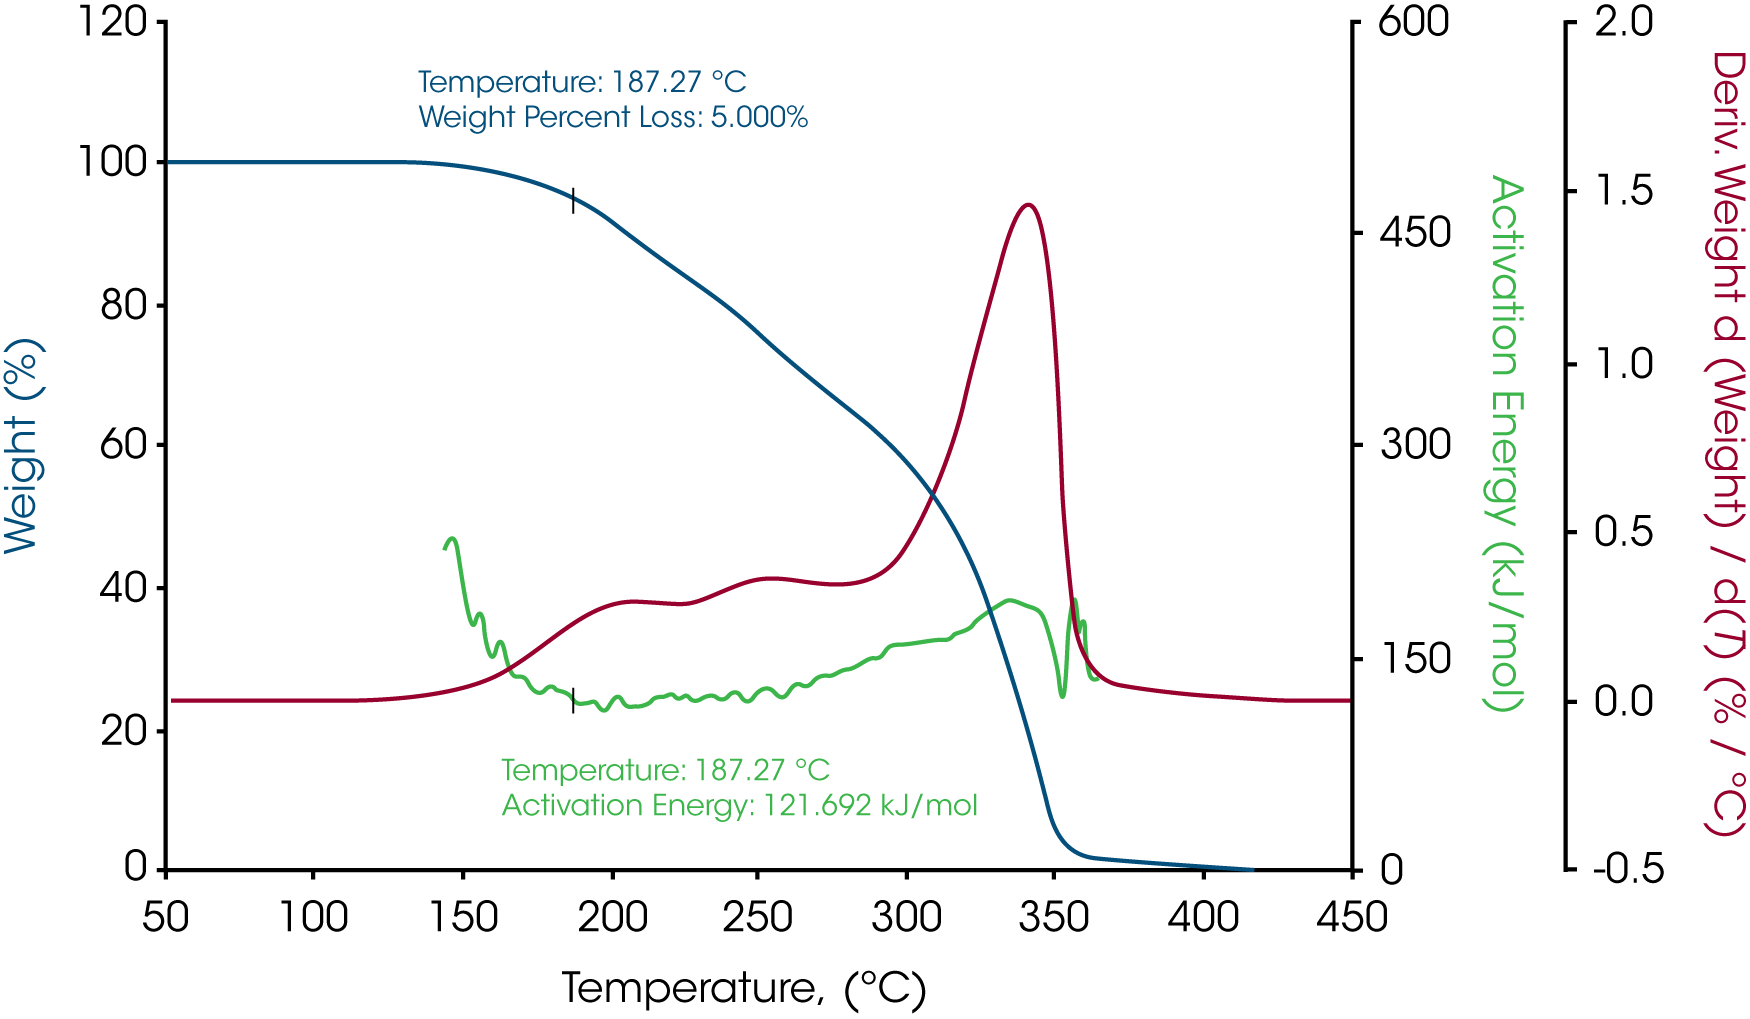
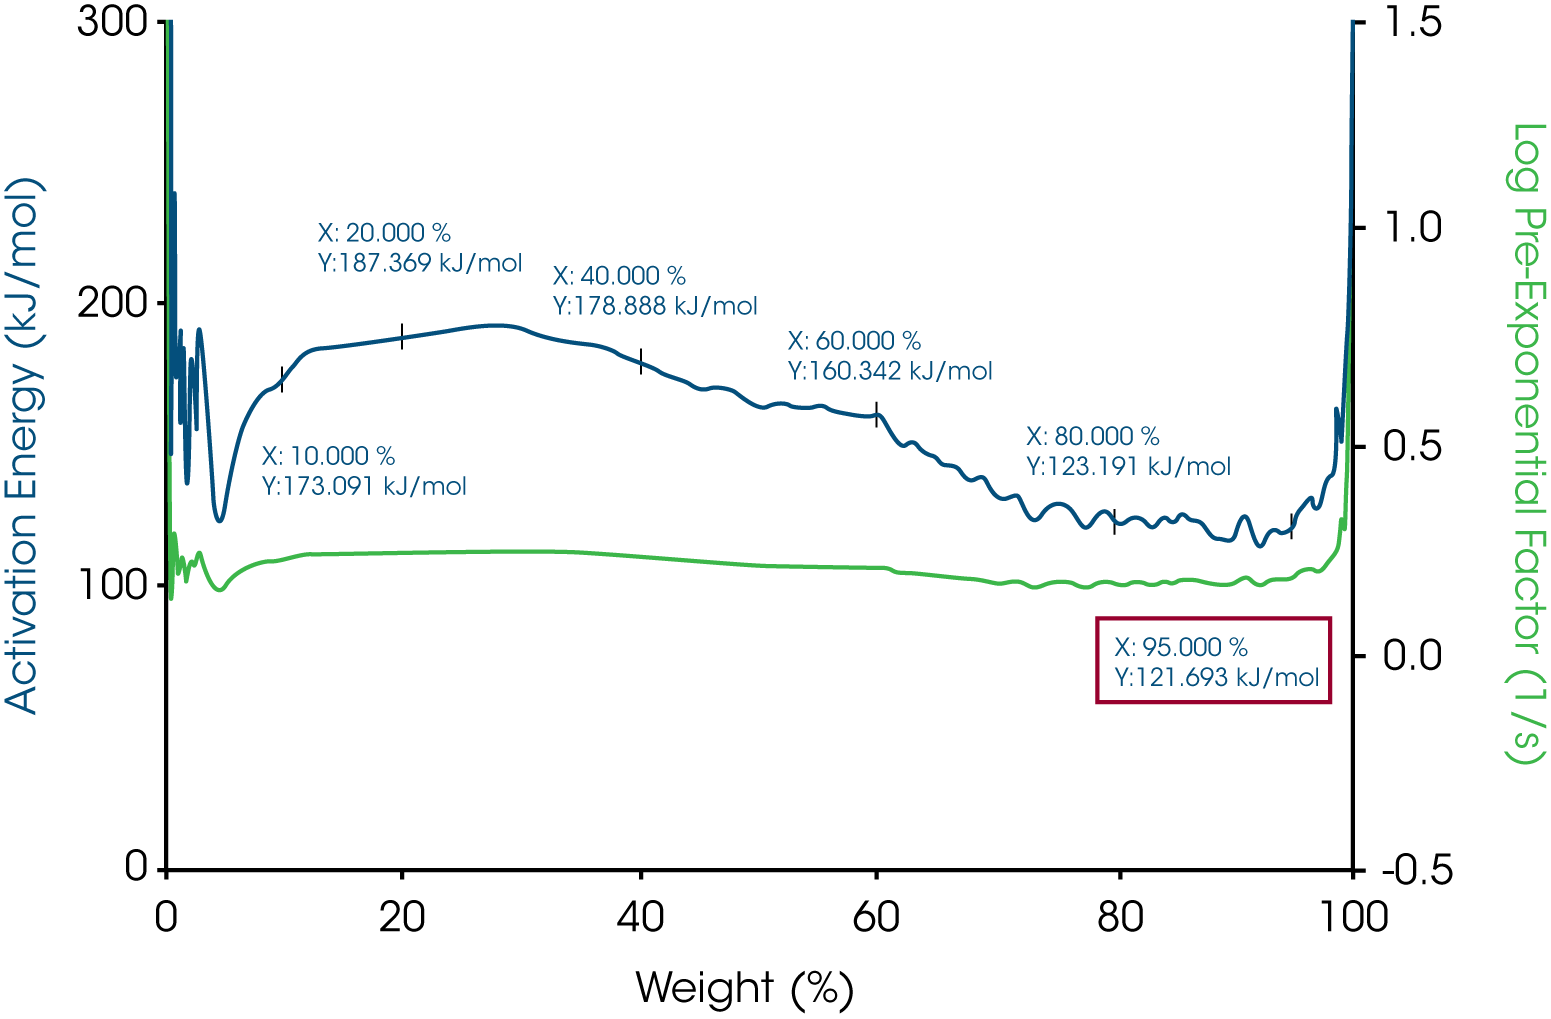
The activation energy for all three waxes are in the range of 115 kJ/mol to 123 kJ/mol. The yellow beeswax has a slightly higher activation energy than the white beeswax which could be explained by the main difference between the two beeswaxes which is the filtration process. The yellow beeswax is fully refined, and the white beeswax is naturally bleached by heating. All the activation energies at 5% weight loss are shown in Table 1. All the pre-exponential factors are plotted on Y2 Axis for all three waxes. With MTGATM and Trios, it is simple to calculate activation energy and pre-exponential factor at different weight losses. With activation energy and pre-exponential factor together, the thermal decomposition kinetic of these materials will be understood better.
Table 1 – Activation energies at 5% weight loss of the three waxes
| Sample Mass | Temperature at 5% weight loss, °C | Activation Energy at 5% weight loss, kJ/mol |
|---|---|---|
| Paraffin Wax | 177.02 | 123.104 |
| White beeswax | 165.17 | 109.895 |
| Yellow beeswax | 187.27 | 121.693 |
MDSC RESULTS
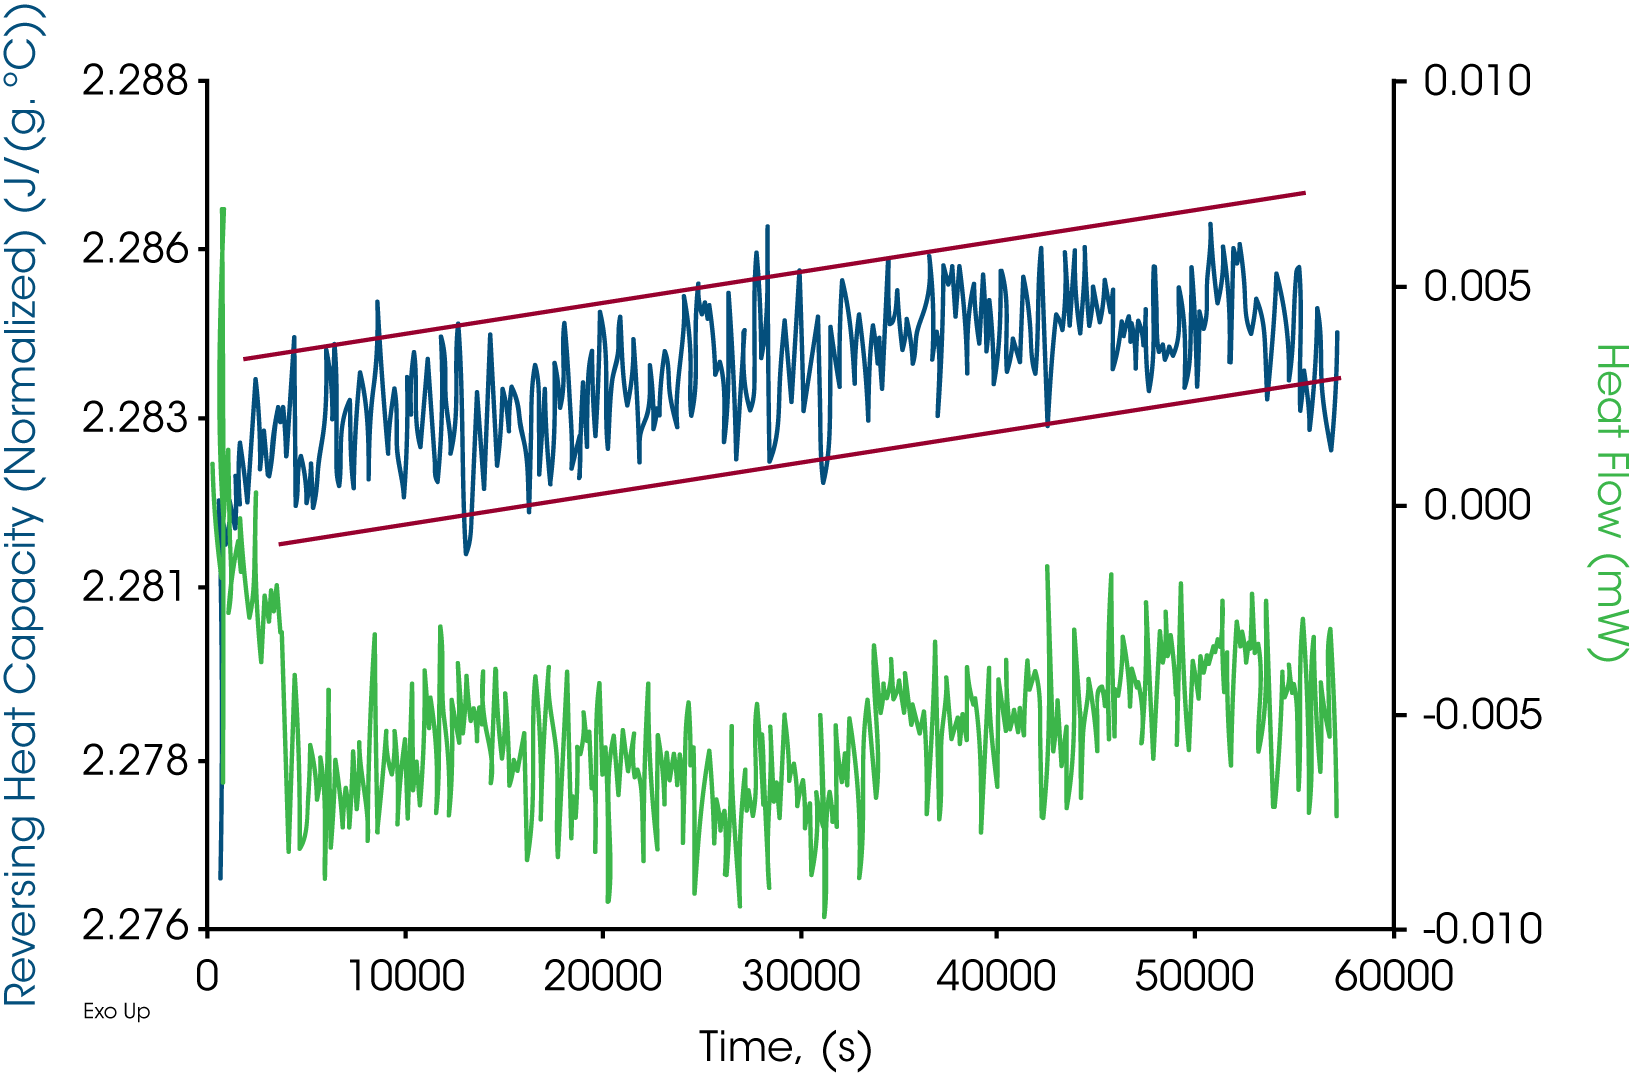
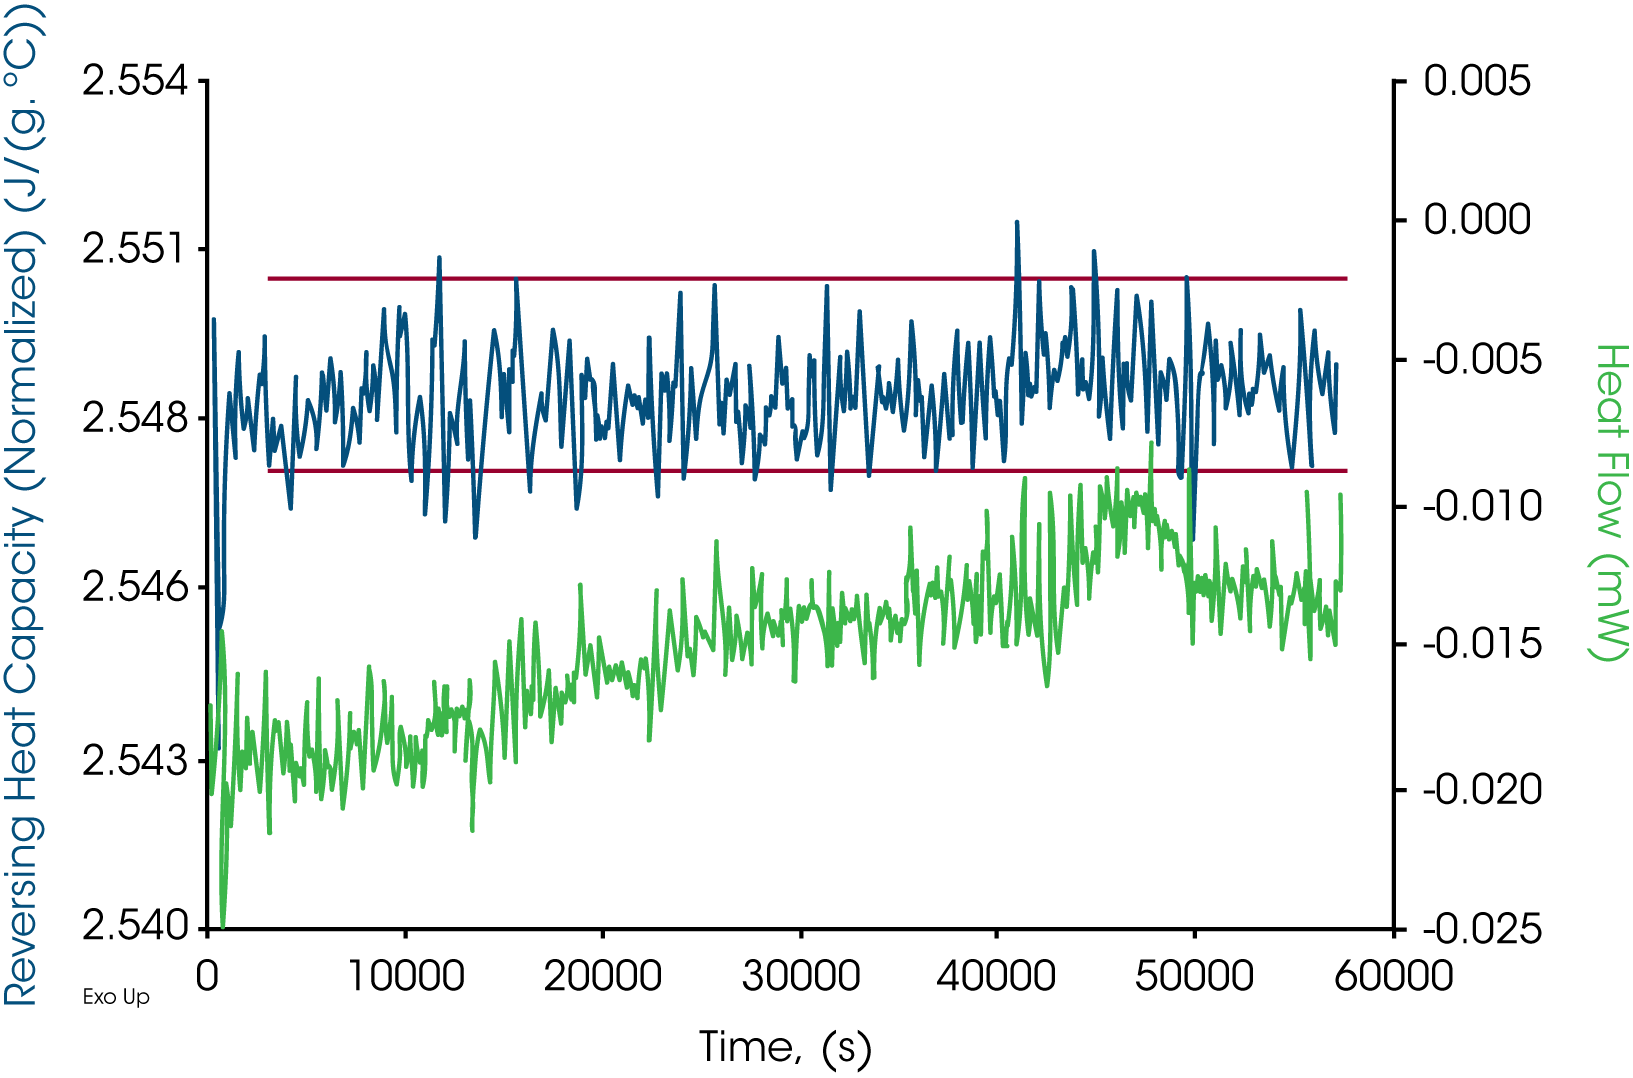
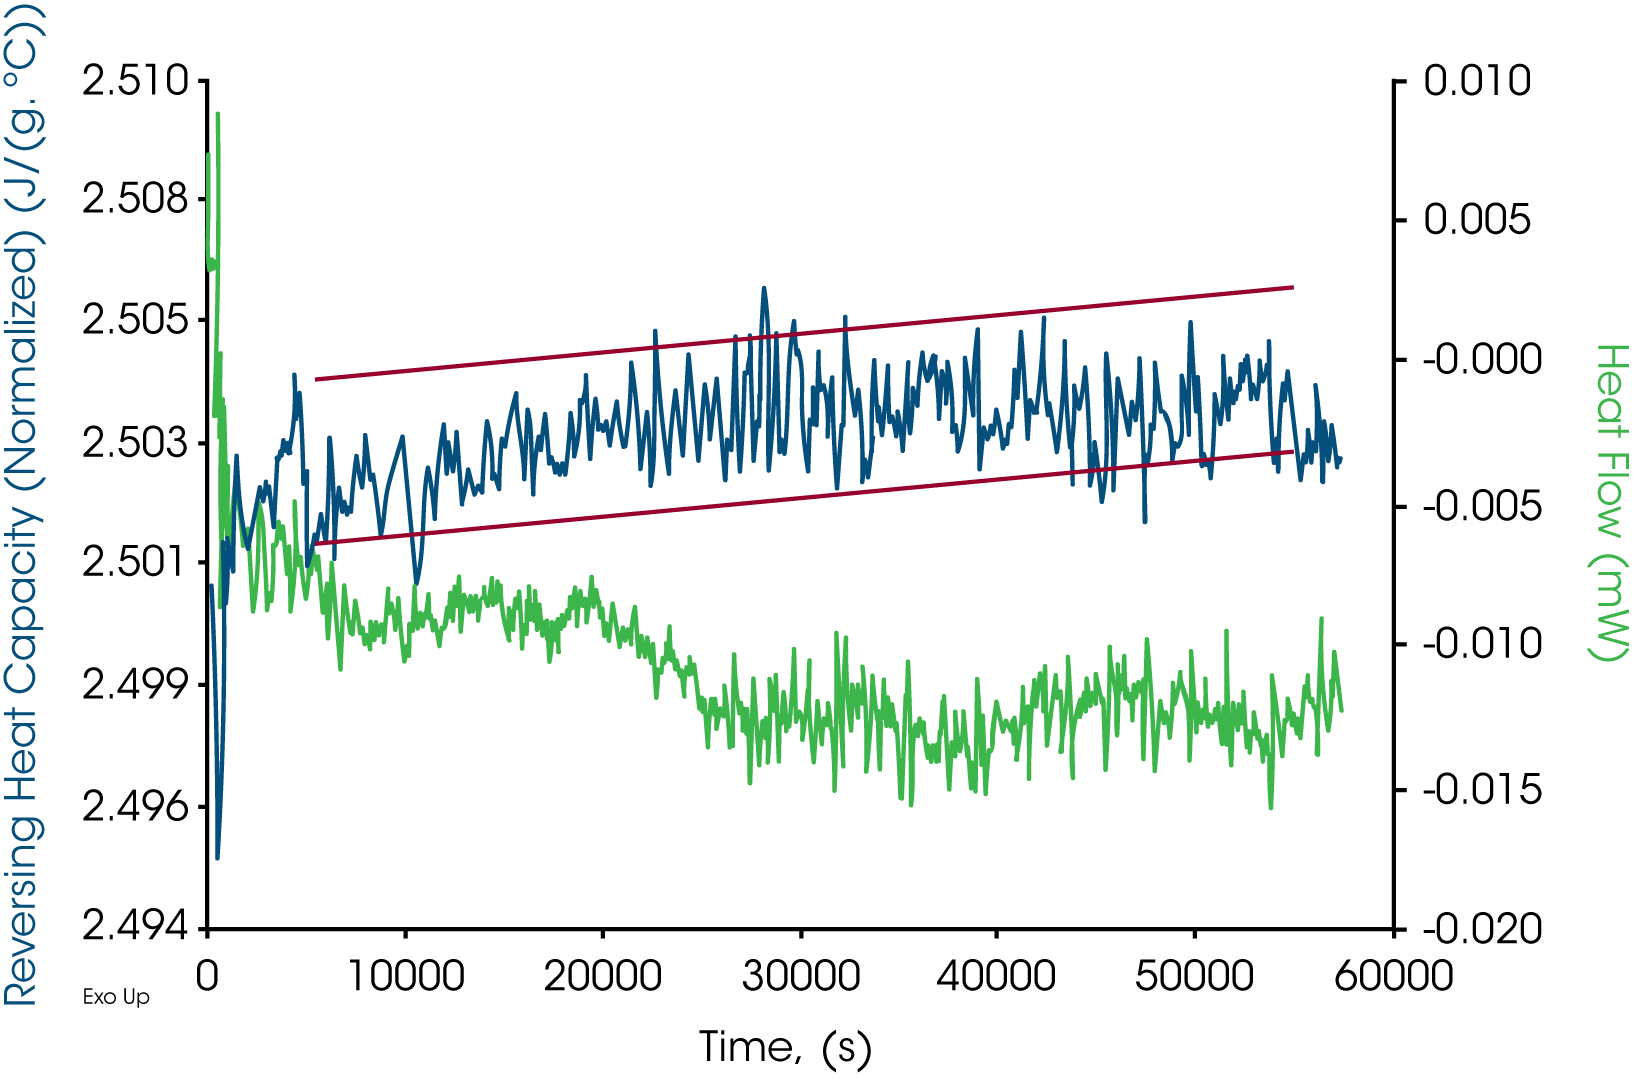
All the Quasi-Isothermal MDSC® results are plotted in Figures 7-9 for paraffin, white beeswax, and yellow beeswax, respectively. Three tests were run for a period of 16 hours at 125 ˚C. Reversing heat capacity and heat flow signals are both plotted in the graphs. From the scale on both Y axes, the stabilities of the signals are excellent. The drift of heat flow signals in green for paraffin is approximately ±0.004 mW. That for white beeswaxes is approximately ±0.005 mW and for yellow beeswax is approximately ±0.003 mW. The reversing heat capacity signals for all three samples are very stable as well. Drifts are within 0.005 J/(g·˚C). This method is a great tool to look at how the heat capacity changes for a long period of time which implies the thermal stability.
Summary
Two techniques, MTGATM and MDSC®, were introduced in this study to determine materials decomposition kinetics and thermal stability. MTGA only requires one single experiment to continuously measure kinetic parameters during the whole decomposition process. Parameters can be calculated using Trios. Moreover, Heat capacity is a good indicator of material structural change. MDSC can detect changes less than 0.01 J/(g·°C) in heat capacity. This way, using the Quasi-Isothermal MDSC method for a long period of time at a temperature slightly below the temperature where materials start to decompose will provide useful information on the thermal stability of materials.
References
- J. H. Flynn, and L. A. Wall, (1966), A quick, direct method for the determination of activation energy from thermogravimetric data. J. Polym. Sci. B Polym. Lett., 4: 323-328.
- ASTM E1641-16, Standard Test Method for Decomposition Kinetics by Thermogravimetry Using the Ozawa/Flynn/Wall Method, ASTM International, West Conshohocken, PA, 2016, www.astm.org
- ASTM E2958-14, Standard Test Methods for Kinetic Parameters by Factor Jump/Modulated Thermogravimetry, ASTM International, West Conshohocken, PA, 2014, www. astm.org
- R.L. Blaine and B.K. Hahn, Obtaining kinetic parameters by modulated thermogravimetry, TA Instruments Application.
Acknowledgement
This paper was written by Yue Schuman, Ph.D., Applications Support Engineer at TA Instruments | Waters.
Click here to download the printable version of this application note.

