Keywords: Discovery X3 DSC, thermoplastic, semi-crystalline, thermal history, polyester terephthalate, PET
TA448
Introduction
The Discovery X3 Differential Scanning Calorimeter
The Discovery X3 Differential Scanning Calorimeter features a multi-sample cell which can analyze up to three samples simultaneously. This arrangement enables a significant boost to productivity and sample throughput. This Applications Note discusses the advantages of the Discovery X3 DSC for thermoplastic analysis which includes the ability to identify potential differences in thermal properties as a function of thermal history. The Discovery X3 is a powerful tool for quality control. Up to three samples can be run at once under identical conditions and any differences can be readily identified. Research can also be improved through replicate testing and statistical analysis, a distinct advantage of the Discovery X3 multi-sample cell.
Semi-Crystalline Thermoplastics
Thermoplastic polymers can be semi-crystalline or amorphous. A polymer crystalline phase is a region wherein chains are aligned and oriented with long-range order. An amorphous region, by contrast, does not contain this long-range order. Many polymers have a blend of these two phases within their morphology and are identified as semi-crystalline. These polymers can be characterized by their “percent crystallinity.” Differences in percent crystallinity can have a dramatic effect on the material properties of a thermoplastic. Some properties which can be impacted include strength, hardness, ductility, and thermal stability. A polymer must have crystalline regions to have a melt temperature. This does not mean that an amorphous polymer cannot flow, but if there are no crystallites there cannot be a melt. The morphology of a polymer can be controlled by many factors including thermal and mechanical processing and the use of additives. To understand the final properties of a material it is crucial to understand its morphology and how it may be controlled. DSC is a key tool in understanding thermal properties and morphology of a material.
Polyethylene terephthalate (PET) is an example of a ubiquitous semi-crystalline thermoplastic polymer. It is used all over the world in applications as different as packaging and clothing. To serve these varied industries, PET must have the required properties for those end uses. One of the key factors which affects the material properties of PET is percent crystallinity, which can be controlled by thermal processing conditions.
This Applications Note showcases the capability of the Discovery X3 DSC to simultaneously probe the thermal properties of three semi-crystalline PET thermoplastics, to gain information about the thermal history of those materials.
Experimental
Three PET samples were prepared for this work. All samples were cut from a commercially available plastic water bottle, which is known to be made of PET. All the samples were loaded into TA Instruments Tzero™ Aluminum pans. Two of the samples were heated to 300 °C and melted in a DSC (to remove preexisting thermal history) then cooled using different methods. The “PET Quench Cooled” sample was removed from the DSC and rapidly cooled to room temperature in seconds by placing the pan on a chilled surface. The second melted sample was cooled back to room temperature at a controlled rate of 20 °C/min in the DSC. The final sample was tested directly as it was taken from the bottle and is identified here as “PET As Received.”
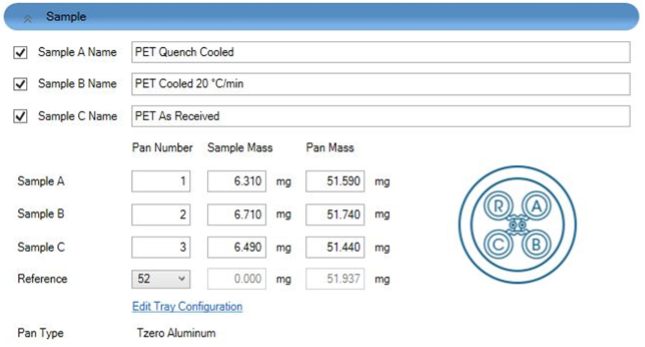
Three samples can be run at once under identical conditions in the Discovery X3 DSC. When designing an experiment in the TRIOS software with the equipped Autosampler the samples are identified as Sample A, B and C. The pan location from the Autosampler tray can be identified and programmed into the experiment along with the location of the reference pan. Figure 1 shows the interface in TRIOS when designing an experiment using all three available sample sensors. An illustration can also be observed of the four sensors of the Discovery X3 DSC cell; the sample sensors (A, B, and C) and the reference sensor (R).
The three PET samples with different thermal histories were run simultaneously in the Discovery X3 DSC. All sample masses were between 6.3 mg and 6.8 mg. A “Heat-Cool-Heat” experiment was performed in order to probe the effect of thermal history on the semi-crystalline PET samples. The samples were ramped at 20 °C/min from 40 °C to 300 °C (1st Heat), then cooled at a controlled rate of 10 °C/min back to 40 °C, and finally ramped again at 20 °C/min to 300 °C (2nd Heat).
By analyzing the 1st Heat, the thermal properties of the samples as they were initially loaded into the DSC can be studied. After a thermoplastic polymer goes through a melt (as these samples do during the 1st Heat step) all previous thermal history is erased. The 2nd Heat in this experiment is meant to identify the thermal properties of the thermoplastic samples after having the identical history of the 10 °C/min controlled cooling from the melt imparted onto them.

Results
Three semi-crystalline PET samples were run simultaneously in the Discovery X3 DSC. By analyzing the thermograms much can be learned about the thermal properties of the materials as a function of their individual thermal histories. The thermograms presented in this note are shown with exothermic transitions moving upward on the y-axis (“Exo Up”). An endothermic step change in the heat capacity baseline indicates the glass transition temperature (Tg). The magnitude of this step change is proportional to the percentage of amorphous phase in a polymer. The endothermic peak in the data indicates the melt transition of the crystalline phase for these samples. For polymer samples, the temperature of the minima of the melt peak is taken to be the melt temperature (Tm) even though melting does not occur at one discrete temperature point. Semi-crystalline polymers can undergo a process during a thermal ramp known as “cold crystallization.” Above the Tg, previously glassy polymer chains gain long range mobility which can result in those chains aligning and forming new crystallites which were not present at the beginning of the run. Cold crystallization results in an exothermic peak above the glass transition but below the melt Tm. Once all the crystalline region has melted thermal history is effectively erased.
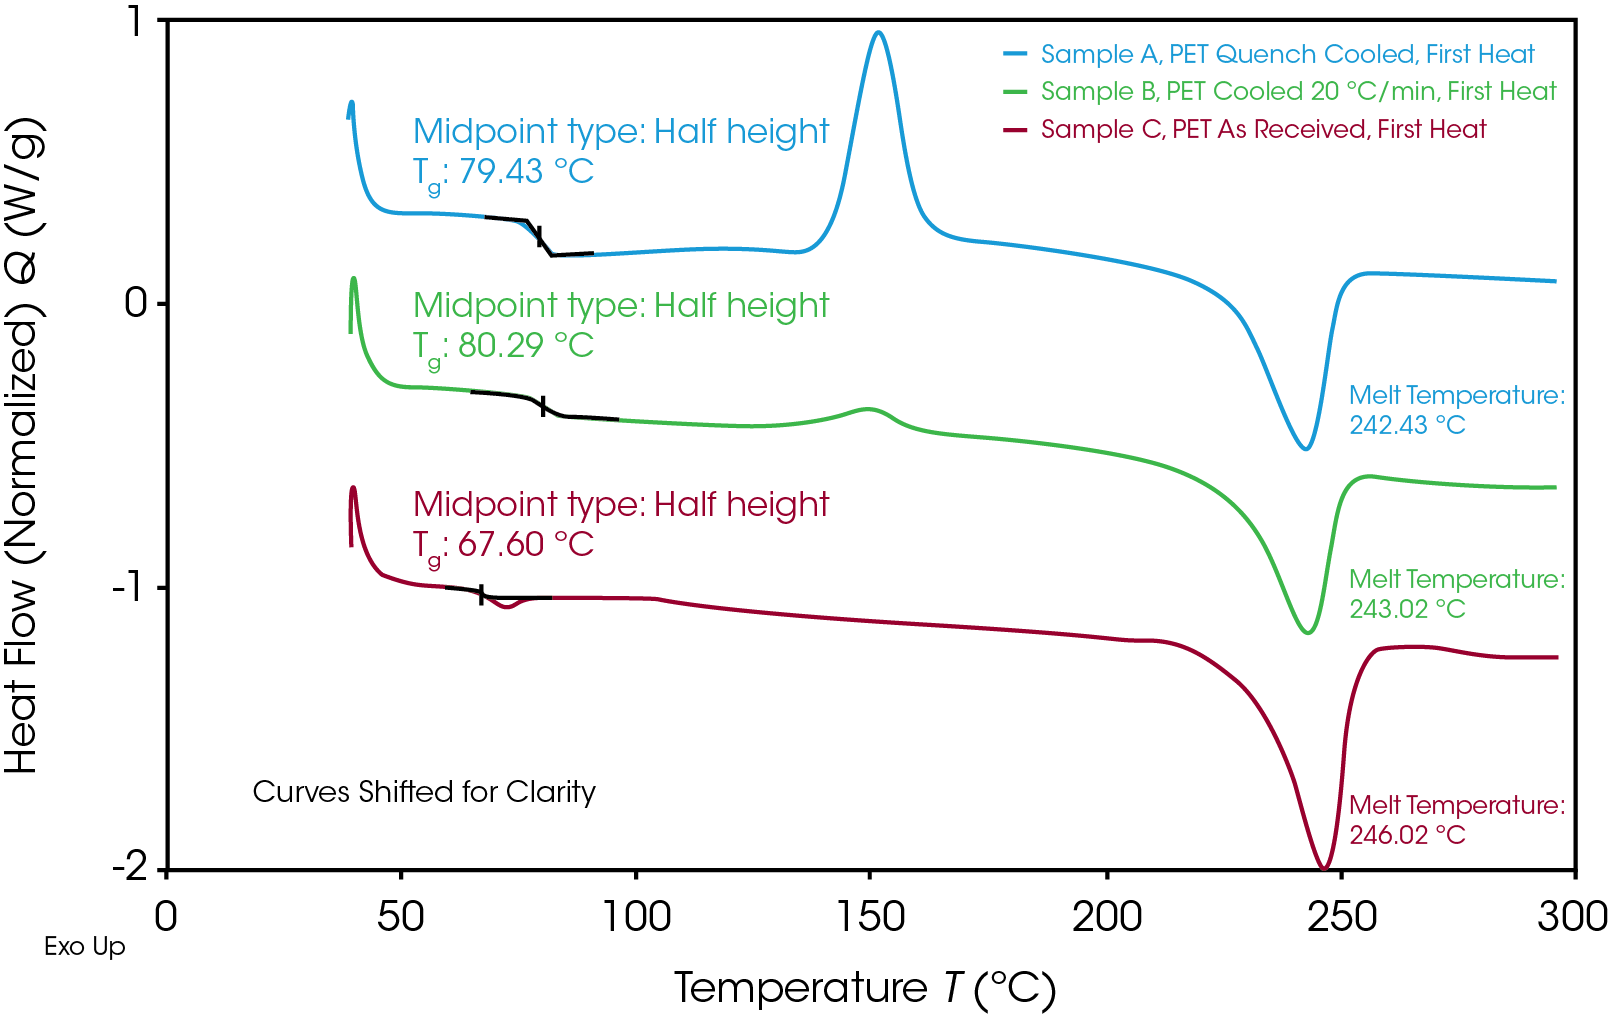
Figure 2 shows the 1st heat for the three samples run in this experiment. Samples A and B were taken from the same source as Sample C (As Received) but were first melted and cooled back to room temperature at different rates. The quench cooling process results in a cooling rate much greater than the crystallization rate of PET, which results in the polymer existing predominantly in its amorphous state. The high degree of amorphous content of Sample A can be observed in Figure 1 by the relatively large cold crystallization peak. This indicates the large volume of amorphous polymer which was available to align and crystalize during the thermal ramp. Additionally, the magnitude of the step change in the baseline at the glass transition temperature is largest in the quench cooled sample. Sample B was cooled at a slower (but controlled) rate of 20 °C/min. A larger percentage of the sample was able to crystalize at this rate, but some crystallization was suppressed by this step. The As Received sample shows very little exothermic activity during the thermal ramp. This, along with the small magnitude of the Tg step change, indicates a highly crystalline morphology.
It is interesting to note that the As Received sample has a lower Tg than either of the samples which were previously melted and cooled back to room temperature. It is not uncommon for commodity plastics to include low molecular weight plasticizers to control final material properties. Additionally, certain mechanical processes, such drawing and stretching from a blow molding process, can affect semi-crystalline morphology. Some of these factors may be at play in the observed thermal properties of Sample C. Regardless of thermal history, the melt temperature of the crystalline region is consistent in all three samples.
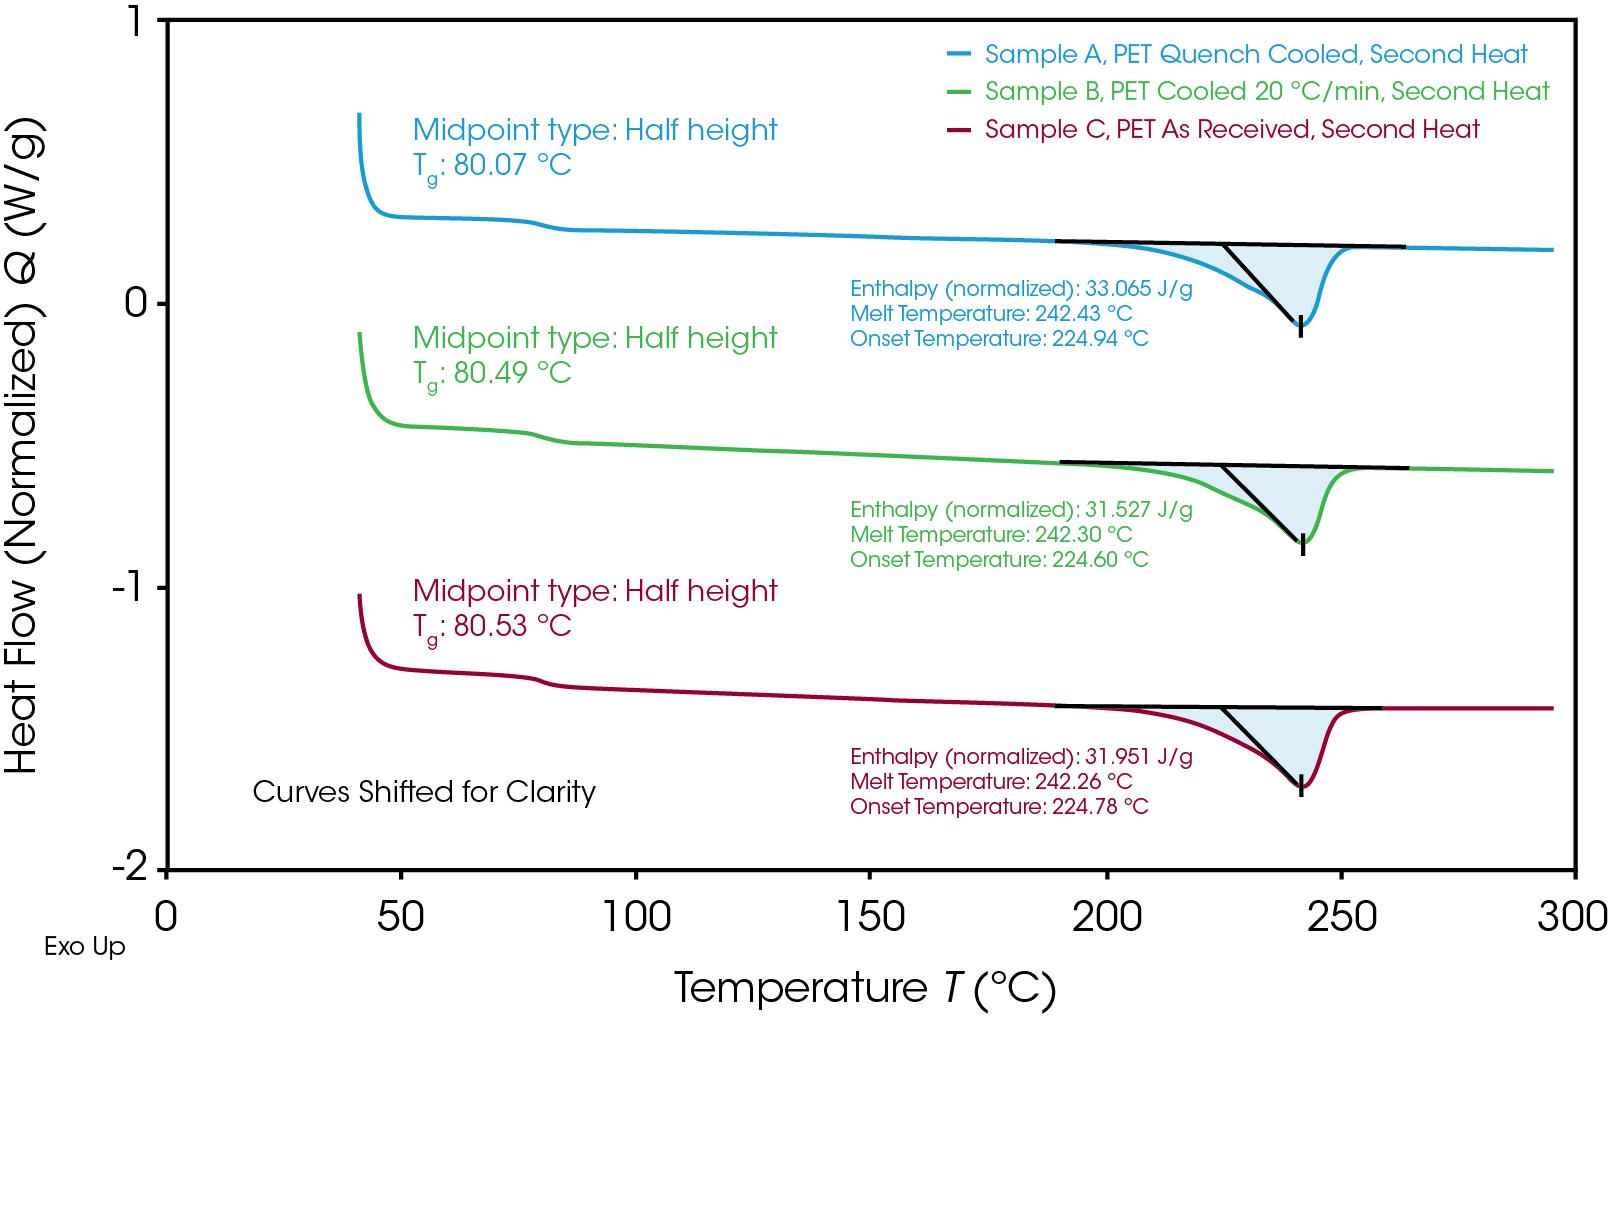
All three samples were heated past their melt temperatures and cooled simultaneously under the same conditions. Figure 3 shows the 2nd heat of these samples. It can be observed that controlled cooling at 10 °C/min allowed for a large amount of crystallization to occur in the samples. The Tg of Sample C increases to match 80 °C to match the values observed in the other samples. In addition to the glass transition temperature, the onset of the melt and the melt temperature are all consistent. Additionally, the enthalpies of the melt transitions are very similar, which shows that the samples have very nearly the same percent crystallinity.


Conclusion
In this Applications Note, the Discovery X3 DSC was used to showcase the effect of thermal history on semi-crystalline PET. Samples from the same source were treated with different cooling profiles after the melt. The X3 DSC then allowed for the samples to be studied under identical conditions, simultaneously. The different thermal treatments were shown to affect the properties of the samples. After experiencing cooling from the melt under the same conditions the three samples, which were taken from the same source, treated with the same thermal histories, and then run together, show nearly identical thermal properties. The Discovery X3 DSC allows for samples to be directly compared against each other under the same conditions while also increasing throughput. It is an instrument with the potential to increase research output, decrease run times, and improve the overall efficiency of a lab without sacrificing any of the characterization capabilities of a traditional TA Instruments DSC.
Acknowledgement
This note was written by Andrew Janisse, Ph.D., Applications Scientist at TA Instruments.
Click here to download the printable version of this application note.

