Keywords: TRIOS, JSON, Python
TB106
Abstract
This technical brief discusses how to interact with dataframe information in Python® within the context of a thermal analysis data file. It covers the contents of the data file, how to extract specific details, and introduces basic plotting of that information. This note is not a comprehensive guide to Python and its libraries; readers are encouraged to refer to the official documentation for more details.
Note: The exported JSON file and the final Python script (in Jupyter® code format) used in this technical brief can be downloaded here.
Introduction
The TA Instruments™ TRIOS™ Software instrument control and data analysis package offers numerous features for both routine and in-depth analysis of scientific data. However, you may sometimes need to generate uniform plot formats, overlay data from multiple sources, or apply advanced functions not available within TRIOS.
TRIOS Software has always supported data export in various formats, including plain text (ASCII), Comma Separated Values (CSV), and Excel™ workbooks. TRIOS Software version 5.8 introduced the ability to export data to a JavaScript™ Object Notation (JSON) file. The import of this JSON file into Python was discussed in a previous technical brief TB105. This note will explore how to interact with the resulting dataframe.
The Python Script and Working With the Dataframe
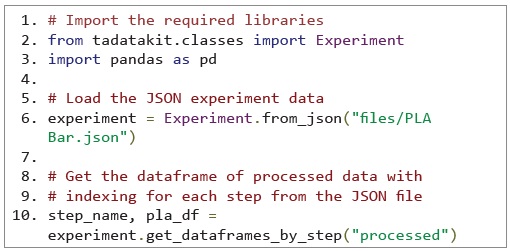
In a previous technical brief, importing the JSON file and creating the dataframe were discussed. When executing the Python script, the interaction with the dataframe occurs in the background; you typically see only the final results. However, it is often useful for you to examine the structure or contents of the dataframe. The Python code block below demonstrates how to import the JSON file into the dataframe, this can be downloaded as Script 1.
This script creates five dataframes (indexed 0 to 4), each representing a step in the measurement:
- pla_df[0]: Equilibrate 0.00 °C step
- pla_df[1]: Ramp 10.00 °C/min to 200.00 °C step
- pla_df[2]: Isothermal 2.0 min step
- pla_df[3]: Ramp 10.00 °C/min to 0.00 °C step
- pla_df[4]: Ramp 10.00 °C/min to 200.00 °C step
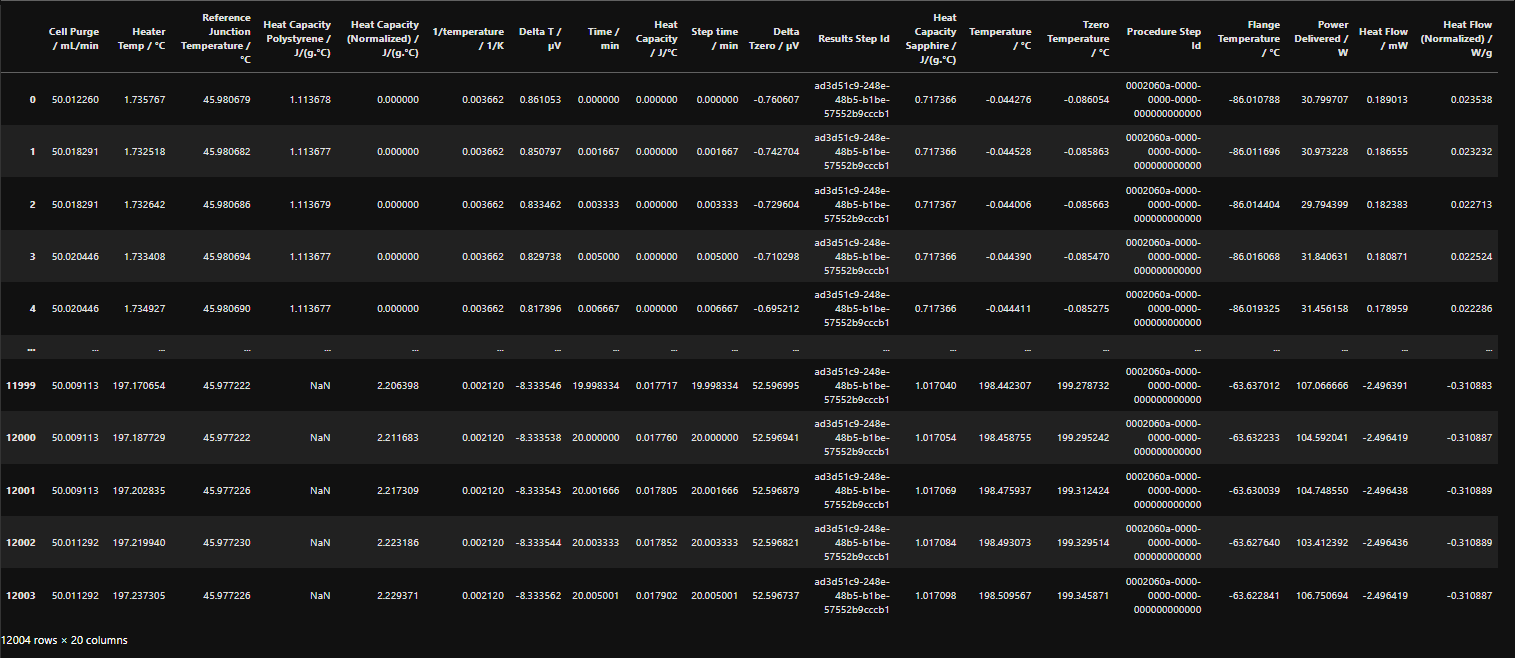
To view the dataframe for the first heating cycle you can use the Python code line:

This displays a snapshot of the complete dataframe, showing the signal labels and the first and last five rows of data as shown in Figure 1.
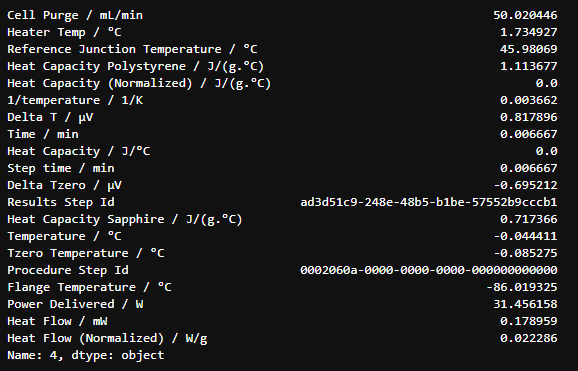
It is also possible to extract a single row of data using an index locator. The code below shows an example of this which will extract the fifth row of data on first heat dataframe.

The result of executing this code is shown in Figure 2.
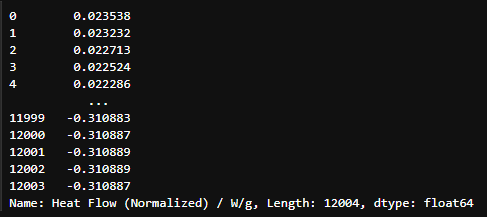
It is also possible to extract a single column of data using the code below.

Finally, it is also possible extract a single value from the dataframe by combining both the column name and the row index as in the following code line.

This example shows where the heat flow normalized value at the fifth row of the first heat dataframe is displayed with the resultant output in Figure 4.

Data Visualization
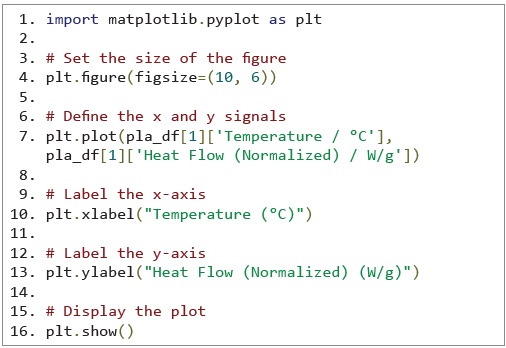
The Matplotlib library is a comprehensive visualization library for Python. Refer to the Matplotlib documentation [1] for more details. A basic plot can be created by first importing the library. Then the signals from the dataframe to be plotted can be defined, and labels added to the axes. The code block for this is shown below:
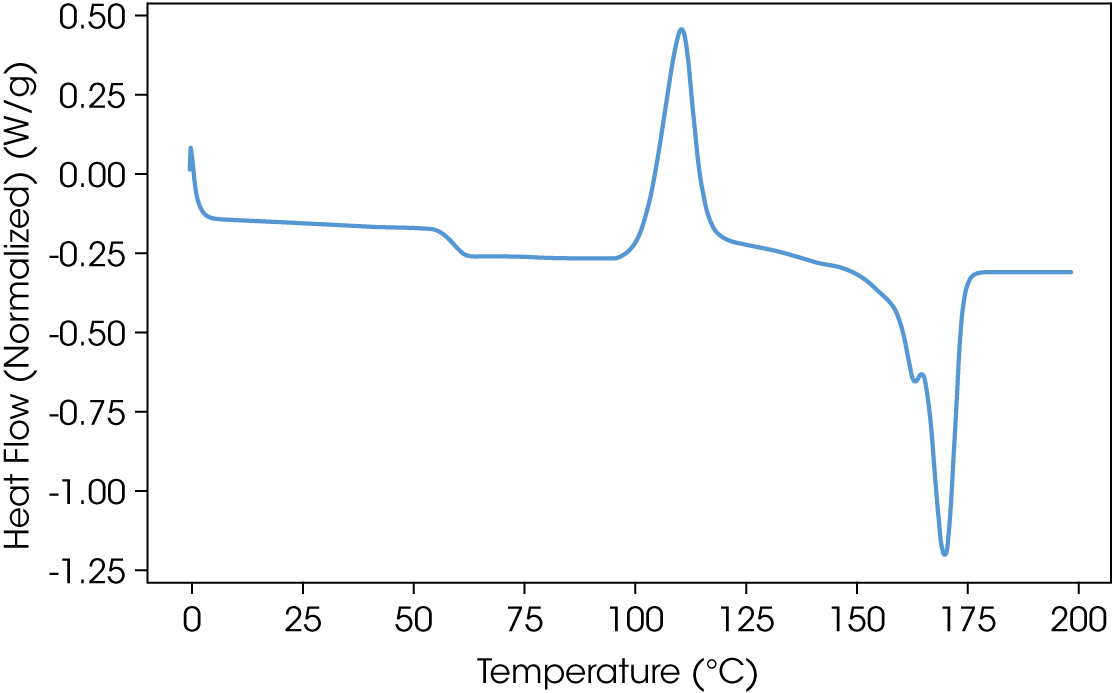
The plot generated is shown in Figure 5.
Conclusion
This technical brief highlights the basic steps required to interact with the dataframe generated from the JSON file. The basic steps to producing a plot are also highlighted.
Acknowledgement
This technical brief was written by Philip Davies, Principal Applications Scientist (Thermal Analysis)
For more information or to request a product quote, please visit www.tainstruments.com to locate your local sales office information.
Python is a registered mark of Python Software Foundation. Jupyter is a trademark of LF Charities, of which Project Jupyter is a part. Excel is a trademark of Microsoft Corporation, and JavaScript is a trademark of Oracle Corporation. Matplotlib is a trademark of NumFOCUS, Inc. TRIOS and TA Instruments are trademarks of Waters Technologies Corporation.
Click here to download the printable version of this application note.

