Keywords: petrolatum, ointment, personal care products, TGA, DSC
TA490
Abstract
The physical properties of personal care products like ointments can vary under modestly elevated temperatures. Differential Scanning Calorimetry (DSC) is commonly used during characterization to establish melting and crystallization temperatures, and Thermogravimetric Analysis (TGA) is used for thermal stability. Four different materials consisting predominately of petrolatum were easily distinguished due to the complex nature of the melting and crystallization transitions. The impact of changing cooling parameters is also evaluated through DSC experiments.
Introduction
Petrolatum, often referred to as petroleum jelly, has long been used as a topical ointment for healing or protecting skin. It is a primary ingredient in a variety of personal care products, from ointments and emollients to creams and moisturizers. Pharmaceutical variations or semisolid dosage forms may be used to treat conditions such as eczema and psoriasis. Petrolatum is a semi-solid, comprised of both solid and liquid fractions, and the wax-like material can be unstable at different temperatures.
It is well known that structure can depend on the specific thermal history a sample has experienced. Differential Scanning Calorimetry (DSC) monitors heat flow and can be used to understand changes occurring in a material with respect to temperature. DSC detects any endothermic or exothermic events in the sample, allowing sensitive detection of transition temperatures such as melting and crystallization. Thermogravimetric analysis (TGA) measures weight changes with respect to temperature and is beneficial to interrogate the stability of samples and guide method development across various analytical techniques. In this paper, over-thecounter petrolatum-based products are analyzed using TGA and DSC techniques demonstrating how thermal properties can vary in formulations.
Experimental
Four commercially available personal care products with petrolatum as the primary ingredient were used in this study. Table 1 contains a breakdown of the composition of the different materials, referred to as Samples A, B, C, and D.
TGA was used to evaluate the thermal stability of the four samples. Nominally 6 mg of sample was evaluated in the TA Instruments™ Discovery™ TGA 5500 Instrument. The samples were prepared in 100 uL platinum pans and ramped at 10 °C/min in nitrogen from ambient to 700 °C.
A TA Instruments Discovery DSC 2500 Instrument with RCS 90 cooling system was used for sample analysis. The instrument was calibrated and operated under standard conditions with 50 mL/min dry nitrogen purge. An average of 11 mg of sample was encapsulated in TZero™ Aluminum Hermetic Pans for testing. Masses were within ~7% for comparison of crystallization. Standard DSC ramps of 10 °C/min were used for preliminary heat-cool-heat evaluations. Further testing was completed utilizing additional ramp rates that will be discussed alongside results.
Table 1. Sample Information
| Sample | Compostion |
| A: 100 | 100% White Petrolatum, USP |
| B: 50 | 50% White Soft Paraffin + 50% Liquid Paraffin |
| C: 46.5 | 46.5% petrolatum + additional ingredients |
| D: 41 | 41% petrolatum + additional ingredients |
Results and Discussion
Thermogravimetric Analysis (TGA) Results
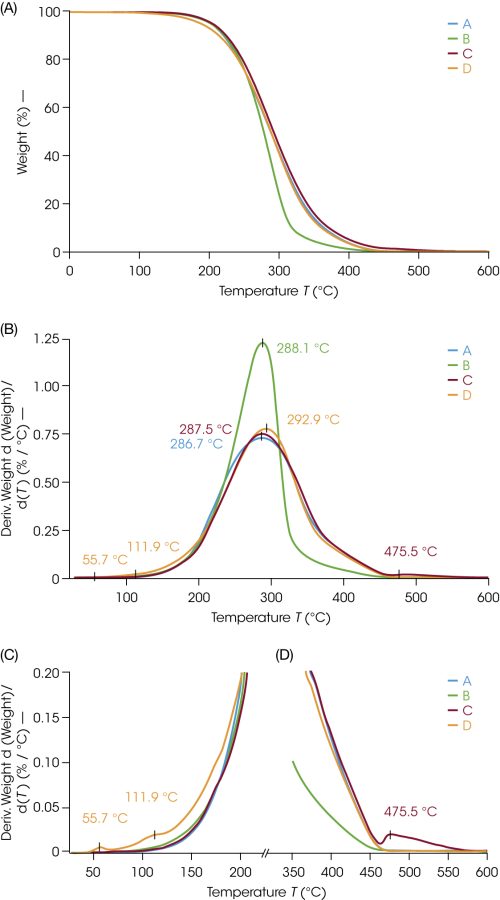
TGA results showed that all four samples decompose completely without residue; an overlay of the TGA ramp at 10 °C/min is plotted in Figure 1A. The peak decomposition temperature was similar for each with an average of 289 °C. This similarity is expected since the major component of each material is petrolatum. The onset temperatures vary slightly among the samples due to the various formulations. Sample B, the 50:50 blend with paraffin, has a narrower weight loss and faster decomposition compared to the other samples. Utilizing tight mass tolerances across all samples minimizes kinetic effects and enables comparison and detection of small changes.
TGA can also help identify more complex formulations. A finer evaluation can be conducted by looking at the derivative curve in Figure 1B to find both samples C and D have unique identifying features. Sample D has a small weight loss at 56 °C and 112 °C prior to the main decomposition (Figure 1C) and Sample C has a subsequent weight loss at 476 °C after the main decomposition (Figure 1D). Consolidated results are reported in Table 2. It is noteworthy that some changes in Sample D begin prior to the upper temperature limit of 80 °C utilized in the DSC methods. Based on the TGA results, a hermetically sealed pan was used for DSC to prevent any sample loss during the measurement.
Table 2. TGA Data
| Sample | Temp 2% wt loss (°C) | Peak Temp, deriv (°C) |
| A: 100 | 182.8 | 286.7 |
| B: 50 | 178.4 | 288.1 |
| C: 46.5 | 181.3 | 287.5, 475.5 |
| D: 41 | 158.4 | 55.7, 111.9, 292.9 |
Differential Scanning Calorimetry (DSC) Results
For many applications, a heat-cool-heat DSC experiment is a good starting point for sample evaluation. The first heat assesses the material as received, then a controlled cooling ramp imparts a common thermal history. Heating the sample above the melting temperature removes prior thermal history to enable a direct comparison on the second heat.
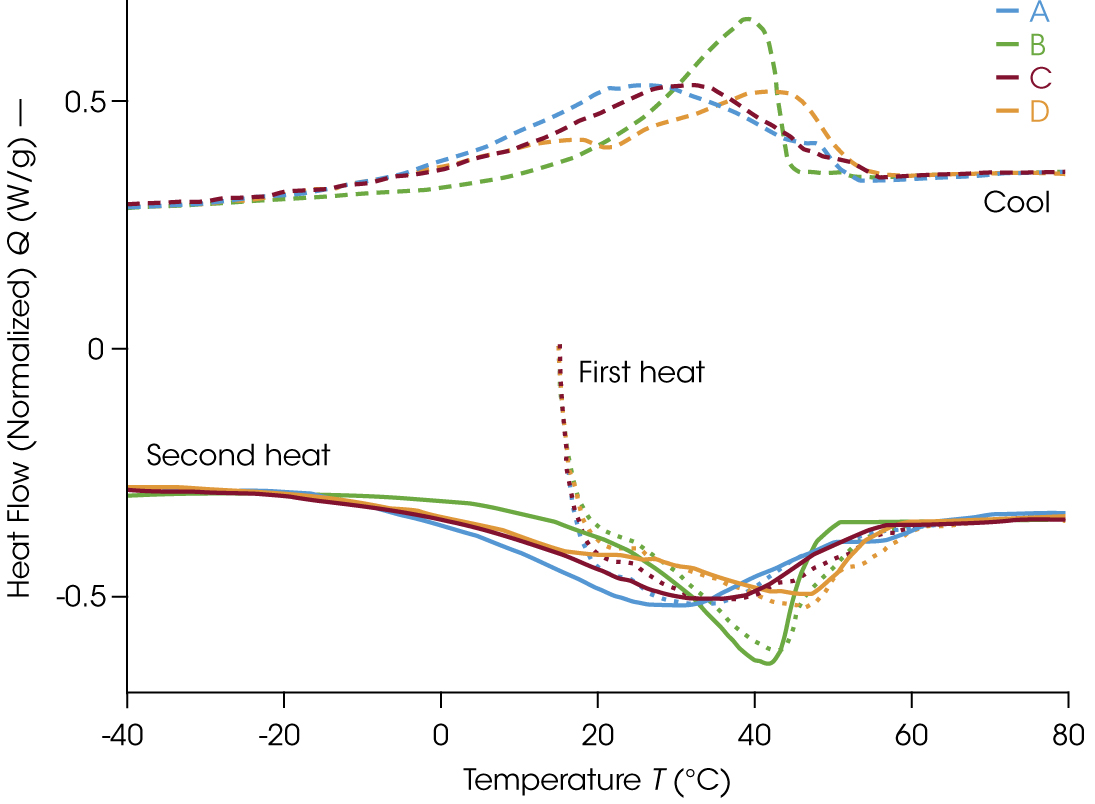
The results of the DSC experiments are shown in Figure 2. Although the materials are solid-like at room temperature, the first heat indicates that the samples begin melting immediately as the temperature ramp begins. The melt transition occurs over a large area. While thermodynamic melting of a pure small molecule or active pharmaceutical ingredient (API) is a sharp transition denoted by an extrapolated onset, materials such as petroleum products have a broader melt over a wider temperature range. Therefore, the melting point for petrolatum is identified by peak temperature. The observed melting temperatures increase in the order of A, C, B, D.
As seen in the cooling curve of Figure 2, the apparent crystallization seems to be comprised of overlapping exotherms. There is a preliminary shoulder near 50 °C for Samples A, B, and C before the peak maximum, and the peak shape is unique across the different materials. Sample D is significantly different with onset of the main peak preceding a prominent shoulder at lower temperature, 16 °C. These initial insights into the crystallization shows us the process is quite complex.
Each thermal profile is unique on both heating and cooling ramps, even though the samples are all comprised of 41-100% petrolatum. Therefore, DSC could help differentiate formulations using the same primary component. The results show that while the bulk ingredient may remain the same, the final products might process and store quite differently. During the second heat the baseline is more easily distinguished by starting at sub-ambient temperatures and it becomes apparent that some melting begins at temperatures of 0 °C and lower.


Each thermal profile is unique on both heating and cooling ramps, even though the samples are all comprised of 41-100% petrolatum. Therefore, DSC could help differentiate formulations using the same primary component. The results show that while the bulk ingredient may remain the same, the final products might process and store quite differently. During the second heat the baseline is more easily distinguished by starting at sub-ambient temperatures and it becomes apparent that some melting begins at temperatures of 0 °C and lower.
Many industrial standards exist as a starting point to help manufacturers consistently report similar information. For example, ASTM D4419 is a reference specific to analyzing petroleum-based products by DSC. [1] A general characterization may use a single temperature cycle to determine transition temperatures. However, additional experiments are possible to help further understand the material.
Most standard methods are adapted for broad applicability and utilize moderate heating rates to ensure enough signal. From Equation 1, note that the heat flow signal (dQ/dt) is proportional to ramp rate (dT/dt).

Where:
dQ/dt is the heat flow rate (mW)
dT/dt is the heating rate (°C / min)
Cp is specific heat capacity (J/g °C)
f(T,t) is a collection of terms dependent on time and temperature referred to as the kinetic contribution to the heat flow rate.
For some applications, slower ramp rates are desirable. A benefit of the Discovery DSC Instrument and Tzero Technology is the ability to use both small sample sizes and slow ramping rates without sacrificing data quality. One such example is wax appearance temperature determination, a DSC method analogous to the cloud point, where slower cooling ramps can be preferable for increased precision in the measurement [2, 3].
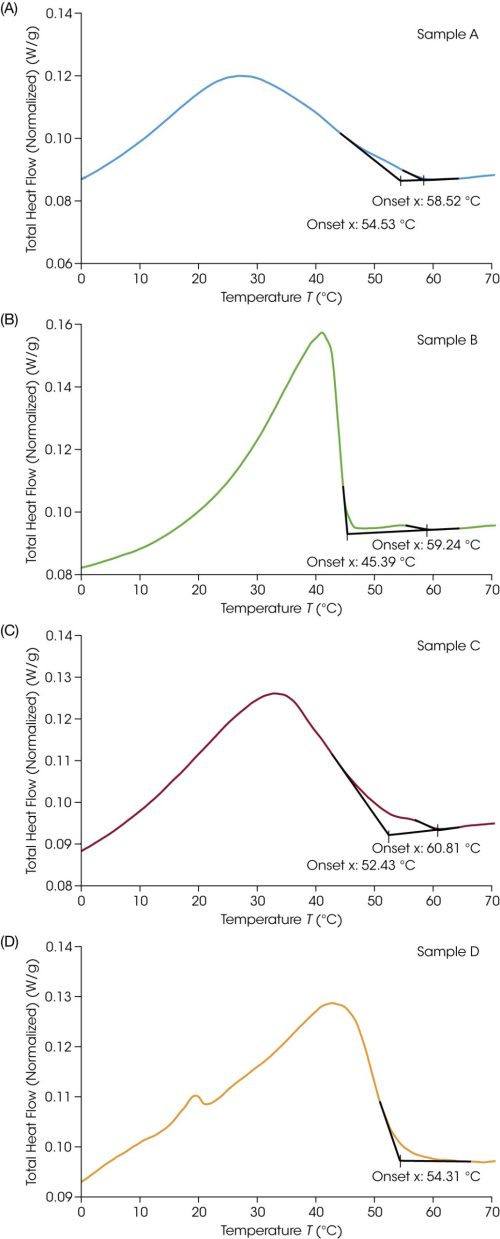
An additional method was conducted at a slower ramp rate of 2 °C/min. The sample was first cycled from 20 °C to 80 °C and subsequently cooled to -40 °C. Upon cooling, the extrapolated onset temperature was used to identify the onset of crystallization or outwaxing. For clarity, each sample is presented separately in Figure 3. When analyzing the data in TRIOS™ software, tangents to the baseline and peak were automatically fit based on the data selected. The user can adjust and select parameters manually as desired. The resulting onset (To) and peak maximum temperatures (Tc) are shown in Table 3.
Since the apparent crystallization peak of each sample is complex, it can be beneficial to have multiple techniques and methods of characterization for a more complete understanding of the material. An analogous study was completed using the Discovery HR Rheometer and microscope accessory and the same four materials, providing complementary data. Rheological studies have shown after heating petrolatum to either a modest 40 °C or above the melt at 80 °C and subsequently cooling back to ambient, there is increased rigidity compared to the material as received [4].
Table 3. Outwaxing temperature from DSC cooling at 2 °C/min
| Sample | Onset Temperature, To (°C) | Peak Temperature, Tc (°C) | Enthalpy (J/g) |
| A: 100 | 58.5, 54.5 | 27.1 | 46.2 |
| B: 50/50 | 59.2, 45.4 | 41.1 | 39.3 |
| C: 46.5 | 60.8, 52.4 | 33.0 | 40.5 |
| D: 41 | 54.3 | 42.8, 19.6 | 42.1 |


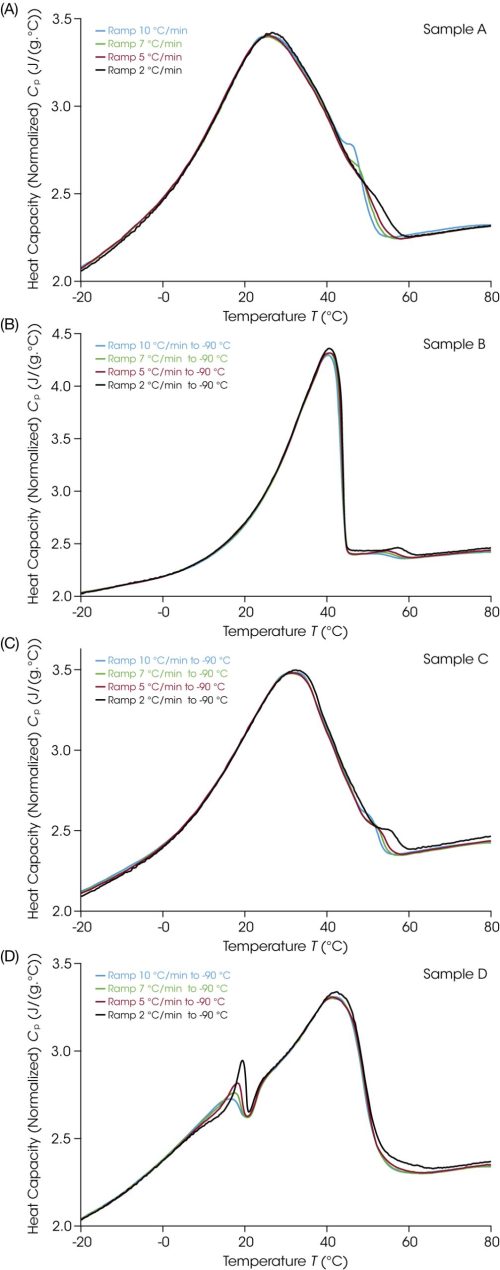
A multiple cooling rate method was created where the sample was heated at 10 °C/min to 90 °C, cooled at X °C/min to -90 °C, equilibrated at -90 °C, for different values of X = 10, 7, 5, and 2 sequentially. To more easily compare the impacts of the cooling rate, the data was plotted in heat capacity units in Figure 4. In general, the peak temperature increases with decreasing ramp rate, but the change is small in magnitude. The shoulder in each sample is most variable with respect to the different cooling rates. These screening results highlight the analytical capability of DSC to interrogate how different process conditions could impact the final structure of material.
It is well known that thermal history has implications for the structure of many materials. Generally, as ramp rates are selected during method development, users may choose fast cooling rates or quenching to yield a higher amorphous content, or conversely choose slow cooling to promote crystallization. Petrolatum is a broadly used excipient, so it has previously been used as a model material. While outside the direct scope of this paper, there is discussion in the literature of the morphological impacts of cooling rate on crystalline structure using complementary techniques, including rheology and x-ray scattering. The microstructure was examined by small angle x-ray diffraction and found that while there are similar amounts of structured material regardless of history, the ordering or layering is different on cooling than the structure that was lost during the initial heating. This observation correlated with a rheological study where the fast cooled (10 °C/min) petrolatum was found to have a higher yield stress than slow cooled petrolatum (0.1 °C/min) [5].
Both the source of petrolatum (i.e. different vendors) and the manufacturing process of pharmaceutical formulations have previously been correlated to significant changes in the in vitro release of qualitatively and quantitatively similar ophthalmic ointments [6]. Thermal and rheological methods can be used as an early indicator in quality control and during development. If pharmaceutical ointments have APIs that require precise dosing, investigating the physicochemical properties can provide valuable insights. Further evaluating the physical properties imparted by process conditions can be a consideration for both product usability and efficacy.
Conclusions
The four formulations examined here highlight that TGA and DSC can help differentiate over-the-counter personal care products comprised of the same primary constituent. While the materials examined here were purchased as final consumer products, both the TGA and DSC are beneficial for screening raw materials, as well, if manufacturers have a variable supply chain. Additionally, experiments with multiple cooling rates showed that simple differences in the thermal treatment may impact the observed morphological properties of a petrolatum ointment. TA Instruments provides a suite of Discovery Instruments including the TGA 5500, DSC 2500, and hybrid rheometer all on the TRIOS software platform that can provide benefits starting with the quality control of raw materials, providing valuable information during research and development, and evaluating the final products.
References
- ASTM International, “ASTM D4419-90 Standard Test Method for Measurement of Transition Temperatures of Petroleum Waxes by Differential Scanning Calorimetry (DSC),” ASTM International, West Conshohocken, PA, 2023.
- Energy Institute, “IP 389: Determination of wax appearance temperature (WAT) of middle distillate fuels by differential thermal analysis (DTA) or differential scanning calorimetry (DSC),” Energy Institute Publications, 1993.
- Y. Adhia, “TA429: Determination of Wax Appearance Temperature (WAT) for Crude Oil and Petroleum Products Using Differential Scanning Calorimetry (DSC),” TA Instruments, New Castle, DE.
- N. Cunningham and D. Williams, “RH141: Rheo-Microscopy: A New Tool for Characterising Wax-Based Formulations,” TA Instruments, New Castle, DE, 2024.
- A. P. van Heugten, J. Landman, A. V. Petukhov and H. Vromans, “Study of petrolatum structure: Explaining its variable rheological behavior,” International Journal of Pharmaceutics, vol. 540, no. 1-2, pp. 178-184, 2018.
- Q. Bao, M. D. Morales-Acosta and D. J. Burgess, “Physicochemical attributes of white petrolatum from various sources used for ophthalmic ointment formulations,” International Journal of Pharmaceutics, vol. 583, 2020.
Acknowledgments
For more information or to request a product quote, please visit www.tainstruments.com to locate your local sales office information.
This paper was written by Jennifer Schott, PhD.
TA Instruments, Discovery, TRIOS, and TZero are trademarks of Waters Technologies Corporation.
Click here to download the printable version of this application note.

