Keywords: Evolved Gas Analysis, EGA, TGA, TGA/GC/MS, TGA/FTIR, chorinated polyethylene, rubber, cross-linked rubber, Differential Scanning Calorimetry, Modulated DSC®, DSC, MDSC®, DMA, dynamic mechanical analysis, peroxide initiator, gas chromatography, mass spectrometry, FTIR.
TA416
Abstract
In this work, we combine evolved gas analysis (EGA) with DSC, MDSC, and DMA to identify a sample as cross-linked chlorintated polyethylene containing about 25% carbon black and 20% silica filler. Additionally, we identified the decomposition products of dicumyl peroxide detected during residual curing, occurring as the sample was heated, as well as two cross-linking coagents, trially cyanurate and trially isocyanurate. Viscoelastic information and glass transitions were obtained from the DMA. DSC analysis also shows the glass transition, confirms residual curing, and provides information on the change in heat capacity.
Introduction
Identification of an unknown polymer is a common request of an industrial laboratory and can be accomplished in many ways depending on the extent of the information required. FTIR is probably the most common initial approach because it provides a good overview of the composition of a polymer resin. Combined with excellent search capabilities of most instrument software and commercially available FTIR spectral libraries, it makes for a very fast, efficient analysis by users of all experience levels.
A different approach is needed when the unknown sample is not easily analyzed using transmission FTIR, as in the case of a cross-linked rubber containing a high level of mineral filler and carbon black. Techniques like attenuated total reflectance (ATR) and FTIR microspectroscopy sometimes do not yield quality data, and cross-linking effectively eliminates any techniques requiring dissolution.
Evolved gas analysis (EGA), which combines thermogravimetric analysis (TGA) with FTIR, mass spectrometry, or gas chromatography and mass spectrometry (TGA/FTIR, TGA/MS, TGA/GC/MS), may provide an alternate approach by determining the decomposition products and effectively ‘working backwards’ to determine the original composition of the unknown resin. Combining EGA data with thermal analysis techniques like DSC and DMA further elucidates the composition as well as providing other fundamental properties of the sample.
Experimental
- TGA – TA Instruments Discovery 5500
- Sample Mass – 5 mg nominal
- Purge – N2 at 25mL / min with gas switch to air at 600 °C. Evolved gas analysis runs were all performed using only N2.
- Crucible – 100 μL Pt
- Temperature range and heating rate – ambient to 1000 °C at 10 °C / min. TGA/GC/MS analysis was performed at 20 °C / min monitoring the evolved gas in real time using the FTIR.
- DSC – TA Instruments Discovery 2500
- Pan: Tzero aluminum
- Heating range and rate: -120 °C to 200 °C at 10 °C / min
- Purge: N2 at 50 mL / min
- MDSC Parameters
- Pan, range, and purge same as standard DSC experiment.
- Heating rate: 2 °C / min
- Amplitude: ± 1 °C
- Period: 60 s
- DMA – TA Instruments Discovery 850
- Temperature Range and Rate: -150 °C to 25 °C at 3 °C / min
- Strain: 0.01%
- Frequency: 1.0 Hz
- Initial Preload Force: 0.01N
- FTIR – Thermo Nicolet™ iS50
- Scans: 4
- Resolution 4 cm-1
- GC/MS – Agilent 7890B GC with 5977B mass spec detecor
- Column – HP 5MS 5% Pheny methyl siloxane; 30m x 250 µm x 0.25 µm
- Mass range: m/z 50 to 500
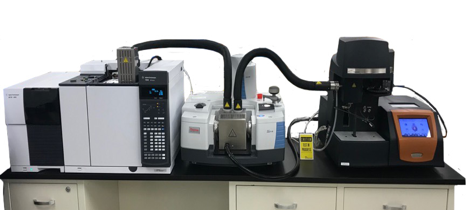
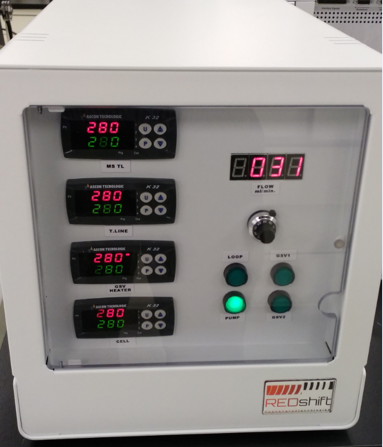
- Redshift Interface – A schematic of the EGA interface is shown below in Figure 1. From the TGA, the gas sample passes through the FTIR and can be introduced into the GC/MS or can be sent directly to the mass spec. The FTIR can be monitored in real time to determine when to inject the evolving gas sample of interest onto the GC column. Alternatively, the injection can be programmed to a pre-determined temperature within the TGA experiment logic. Photographs of the instrumentation are shown in Figures 2 and 3.

Results and Discussion
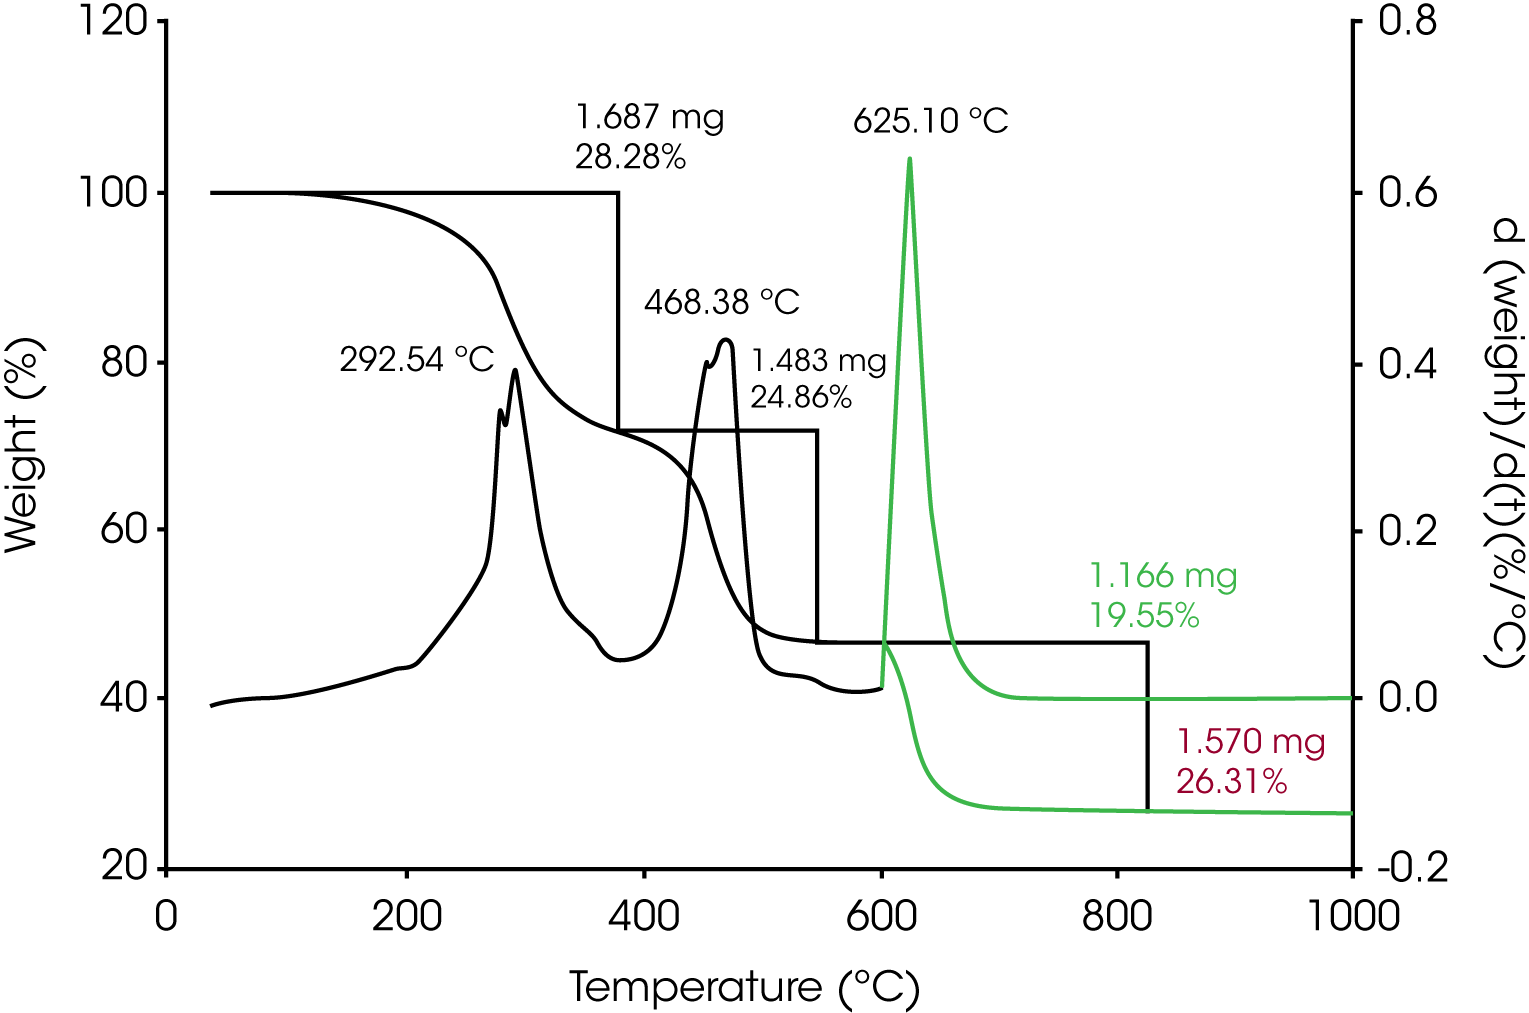
1. TGA – (Figure 4) Three main mass loss transitions were determined; the first is 28.28% and reaches its maximum rate at 293 °C, the second is 24.86% and reaches its maximum rate at 468 °C, the third occurs after the gas switch to air at 600 °C is 19.55% and reaches its maximum rate at 625 °C. This transition is due to the evolution of CO2 from the carbon black filler. Plotting the derivative curve with respect to temperature shows that after the gas switch an approximately monotonous mass loss occurs, which likely indicates no pyrolytic carbon present, and that mass loss is due only to the carbon black. Residue due to the reinforcing filler is 26.31%.
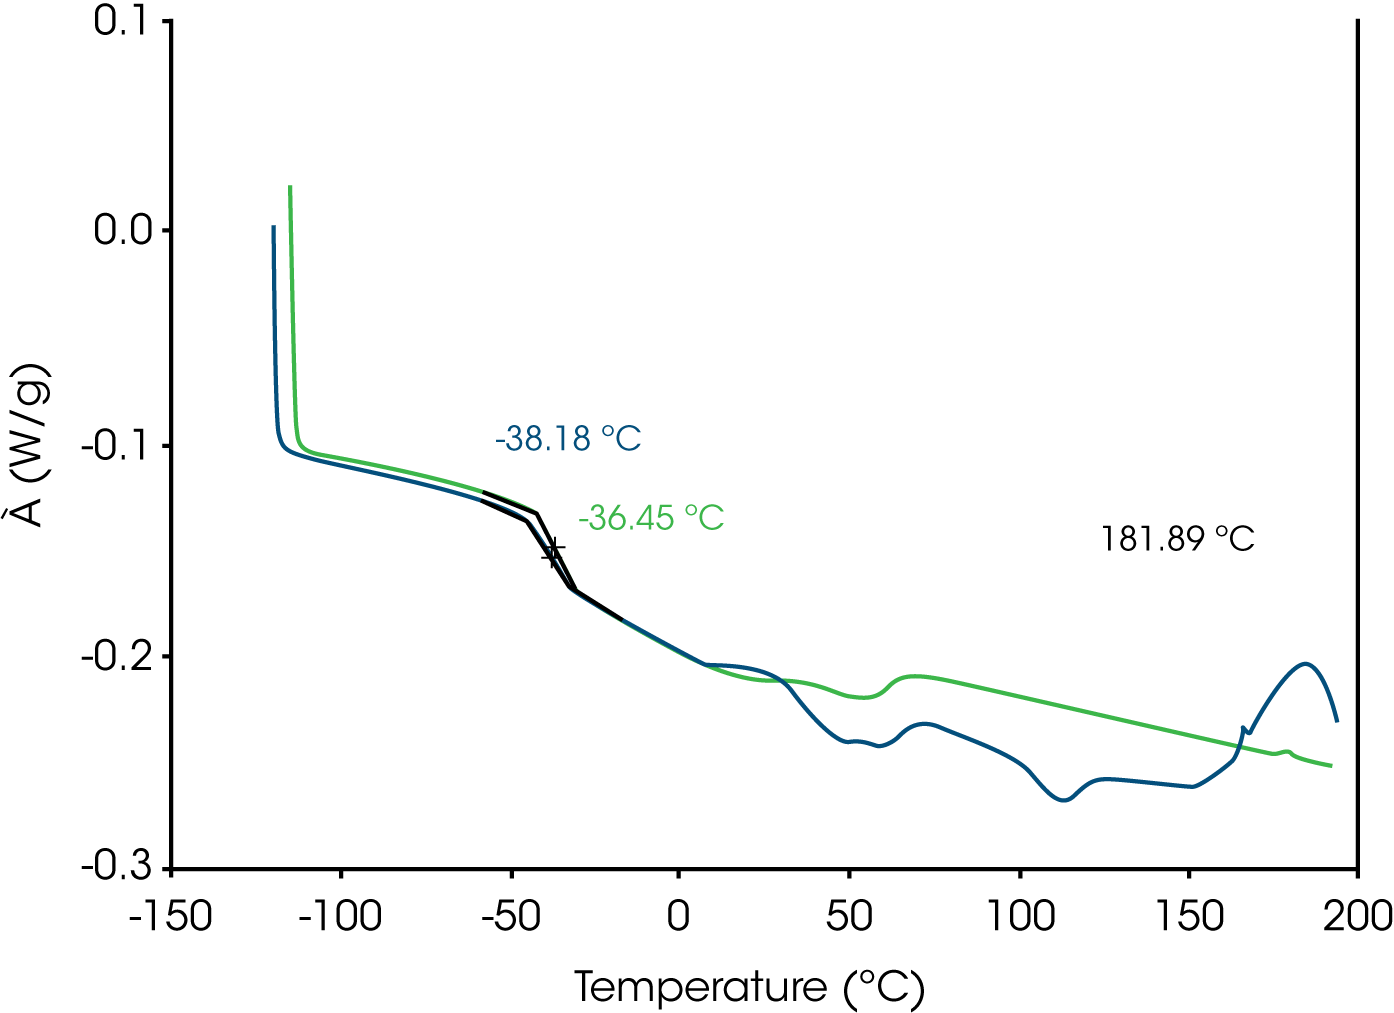
2. DSC – (Figure 5) Prominent glass transitions were identified in the first heat at -38 °C with a slight shift observed in the second heat at -36 °C. An exotherm due to residual curing was observed at 182 °C which is absent in the second heat. Various endothermic transitions were observed in the first heat from 25 °C to approximately 125 °C. These transitions were absent in the second heat and are not apparent in the cooling curve (not shown).
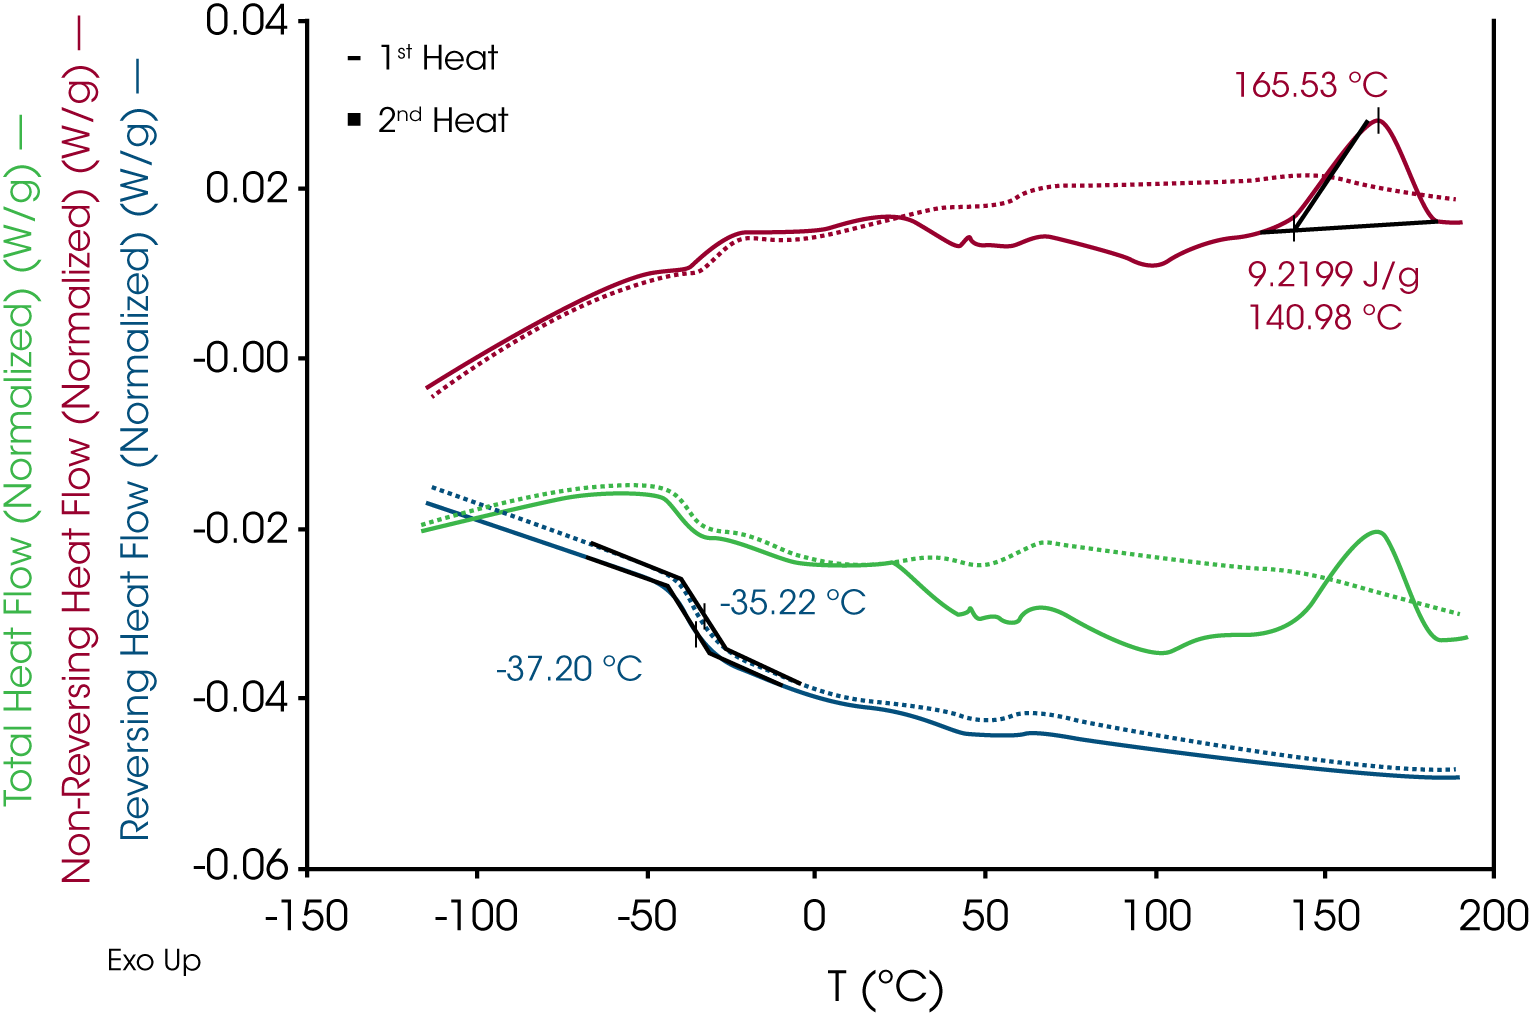
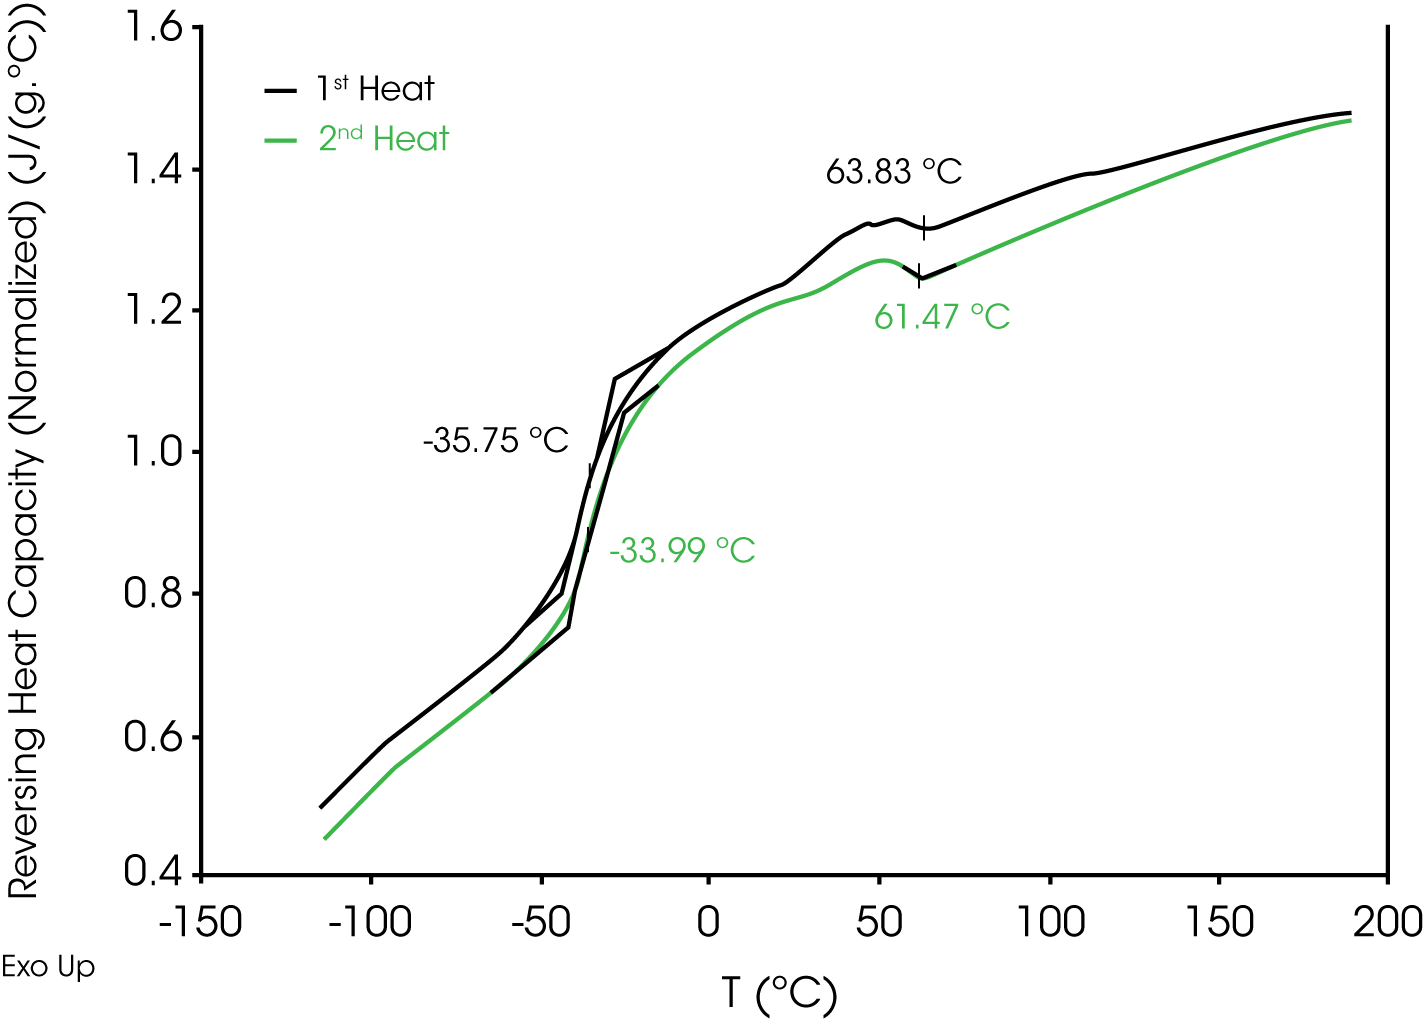
3. Modulated DSC® – (Figure 6) – Reversing heat flow shows the 1st and 2nd heat glass transitions at -35 and -33 °C respectively and an exotherm at 165 °C due to residual curing. The glass transition shift is also an indicator of residual curing. The endotherms observed in the conventional DSC experiment were found in the non-reversing heat flow signal implying that they are likely kinetic processes. These endothermic transitions are not found in the second heat. Comparison of the reversing heat capacities of the 1st and 2nd heats (Figure 7) shows a step decrease in heat capacity1 at ~ 62 °C, which is apparent in both the 1st and 2nd heats and appears to be a reversible transition – possibly a temperature-dependent conformational transition.
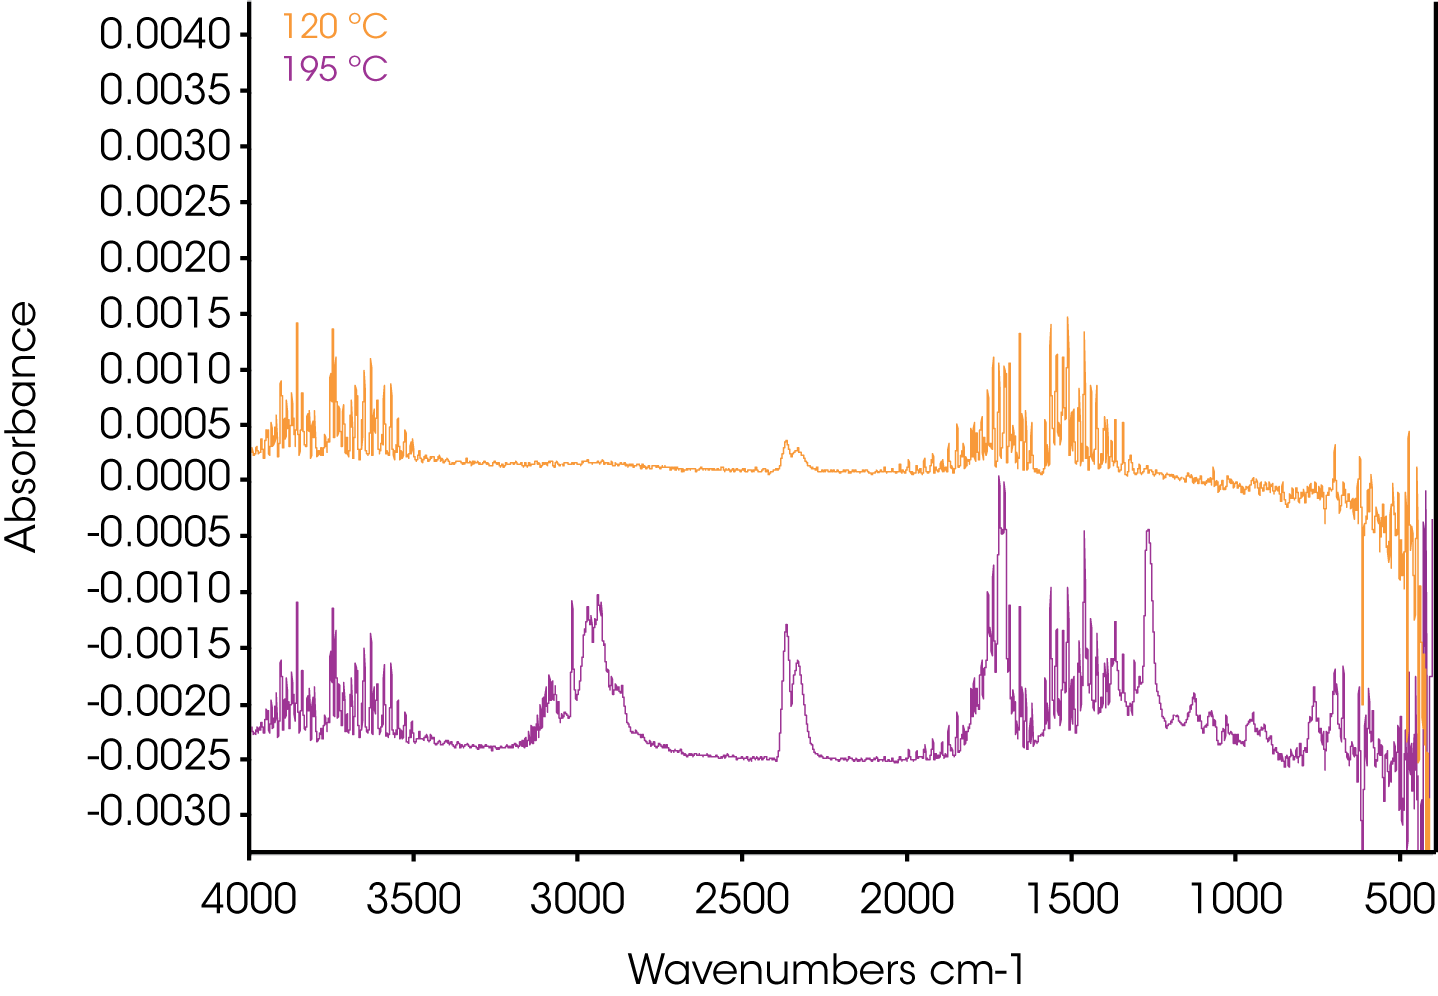
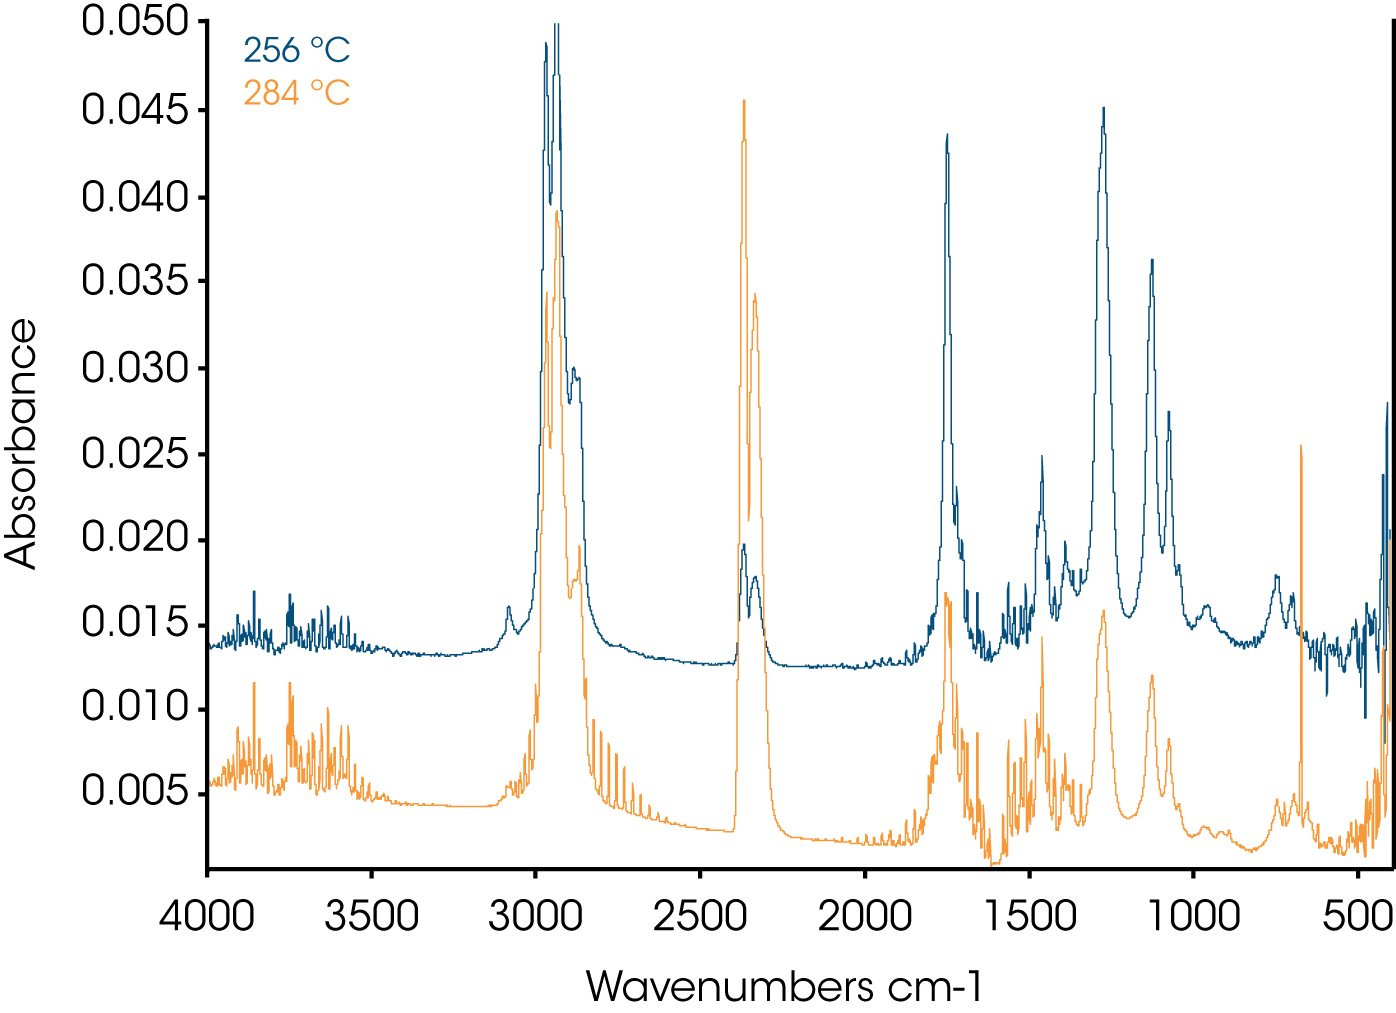
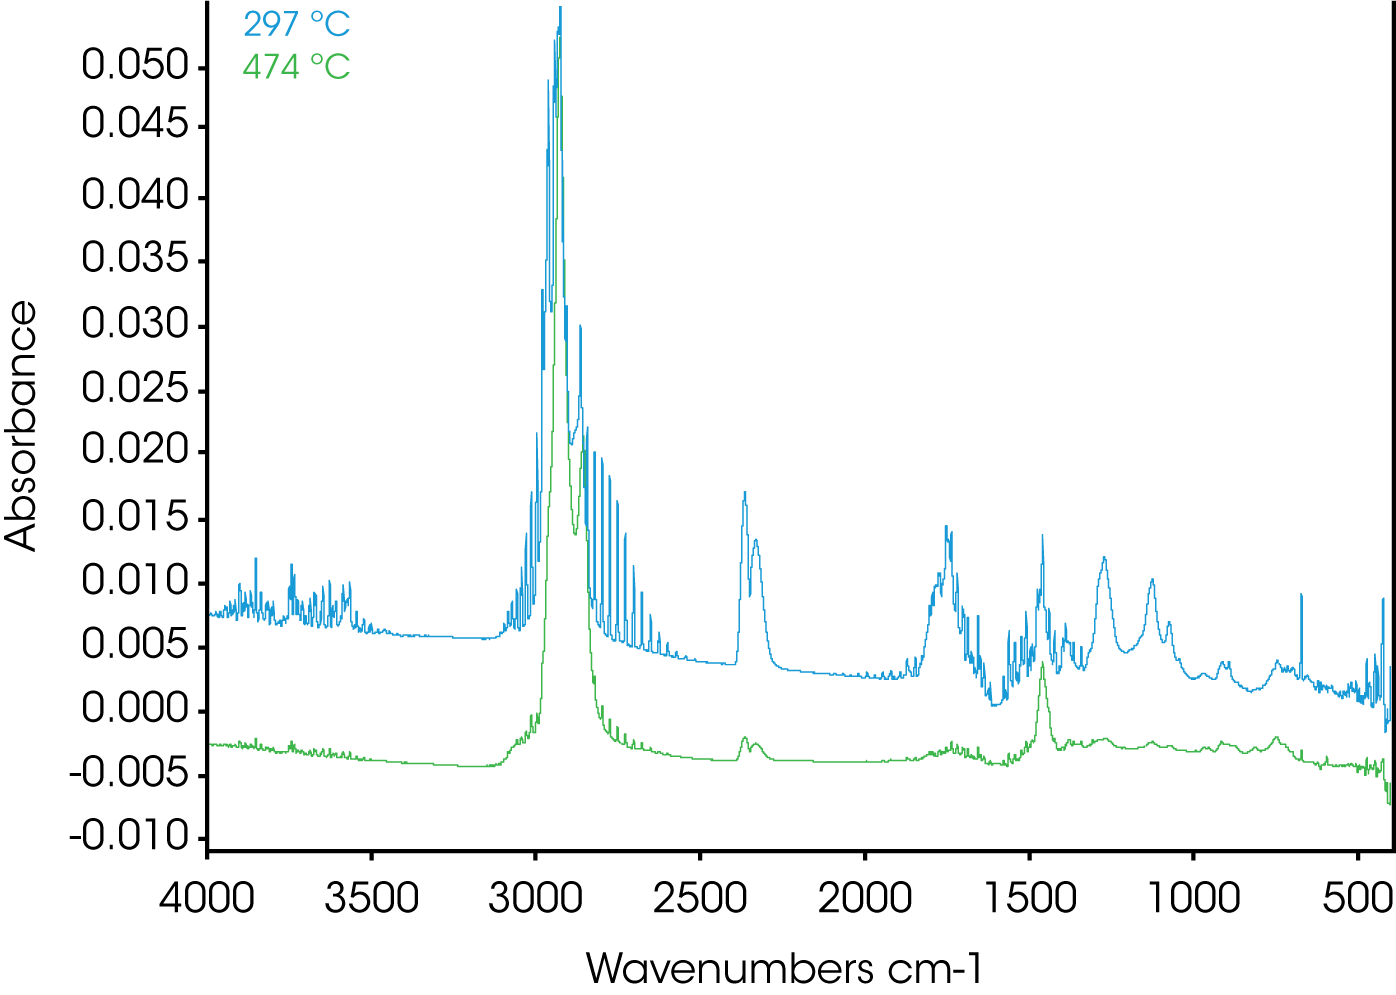
4. Evolved Gas Analysis (TGA/FTIR) – Figure 8 shows an overlay of the TGA mass loss and Gram Schmidt reconstruction which contains the total spectral response of the evolving gases. Often the Gram Schmidt reconstruction will resemble the derivative of the mass loss signal. Spectra were obtained at each of the annotated temperatures on the Gram Schmidt reconstruction shown in Figure 8 and spectral interpretation is summarized in Table 1. Infrared spectra are shown in Figures 10-12.
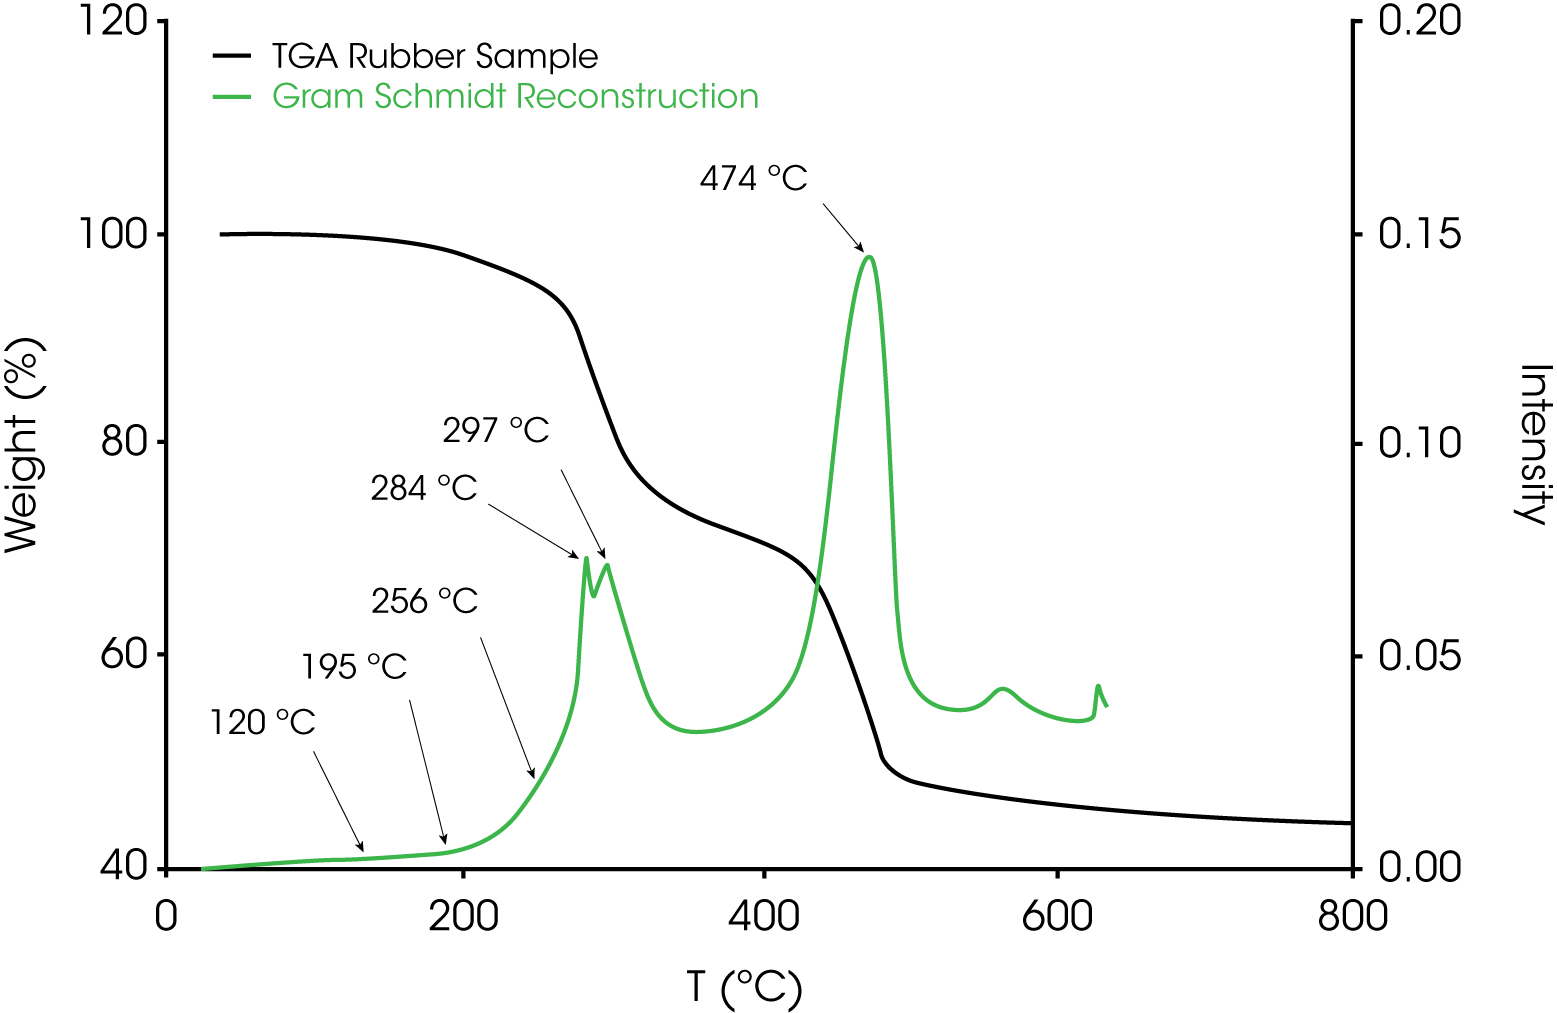
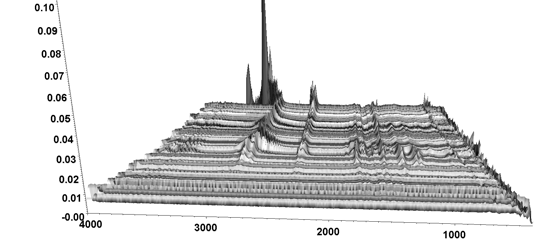
Table 1. Summary of TGA/FTIR Data Shown in Figures 10-1
| Elution Temperature | Spectral Interpretation |
|---|---|
| 120 ºC | Water CO2 |
| 195 ºC | Water, methane, acetophenone, CO2 |
| 256 ºC | Phthalate, water, CO2 |
| 284 ºC | Phthalate, HCI, CO2, water |
| 297 ºC | HCI, water, CO2, phthalate, hydrocarbon |
| 474 ºC | Aliphatic hydrocarbon, HCI, CO2, water |
5. Evolved Gas Analysis (TGA/GC/MS) – The evolution of methane and acetophenone early in the decomposition of the rubber sample (~195 °C) was further investigated by injecting the gases evolving at ~ 210 °C into the GC/MS. The Redshift system allows simultaneous monitoring of the evolving gas using the FTIR and manual injection as the gases of interest evolve. Alternatively the injection can be made at a pre-determined temperature within the TGA programming logic. The total ion chromatogram (TIC) with structures is shown in Figure 13 and summarized by retention time in Table 2. The compounds identified are consistent with the expected by-products of decomposition of dicumyl peroxide, a common cross-linking initiator (1). Additionally, two cross-linking coagents, trially cyanurate (TIC) and triallyl isocyanurate (TAIC) were also identified (2). Didecyl phthalate and its decomposition products were also observed; this is likely the solvent for the peroxide.

Table 2. Compounds and Retention Times from 210 °C Injection
| RT (min) | Compound |
|---|---|
| 8.27 | α-methyl styrene |
| 10.95 | Acetophenone |
| 11.40 | α-cumyl alcohol |
| 11.60 | Methyl-cumyl ether |
| 18-22 | Phthalic anhydride and phthalic acid2 |
| 26.35 | Trially isocyanurate (TAIC) |
| 28.90 | Trially cyanurate (TIC) |


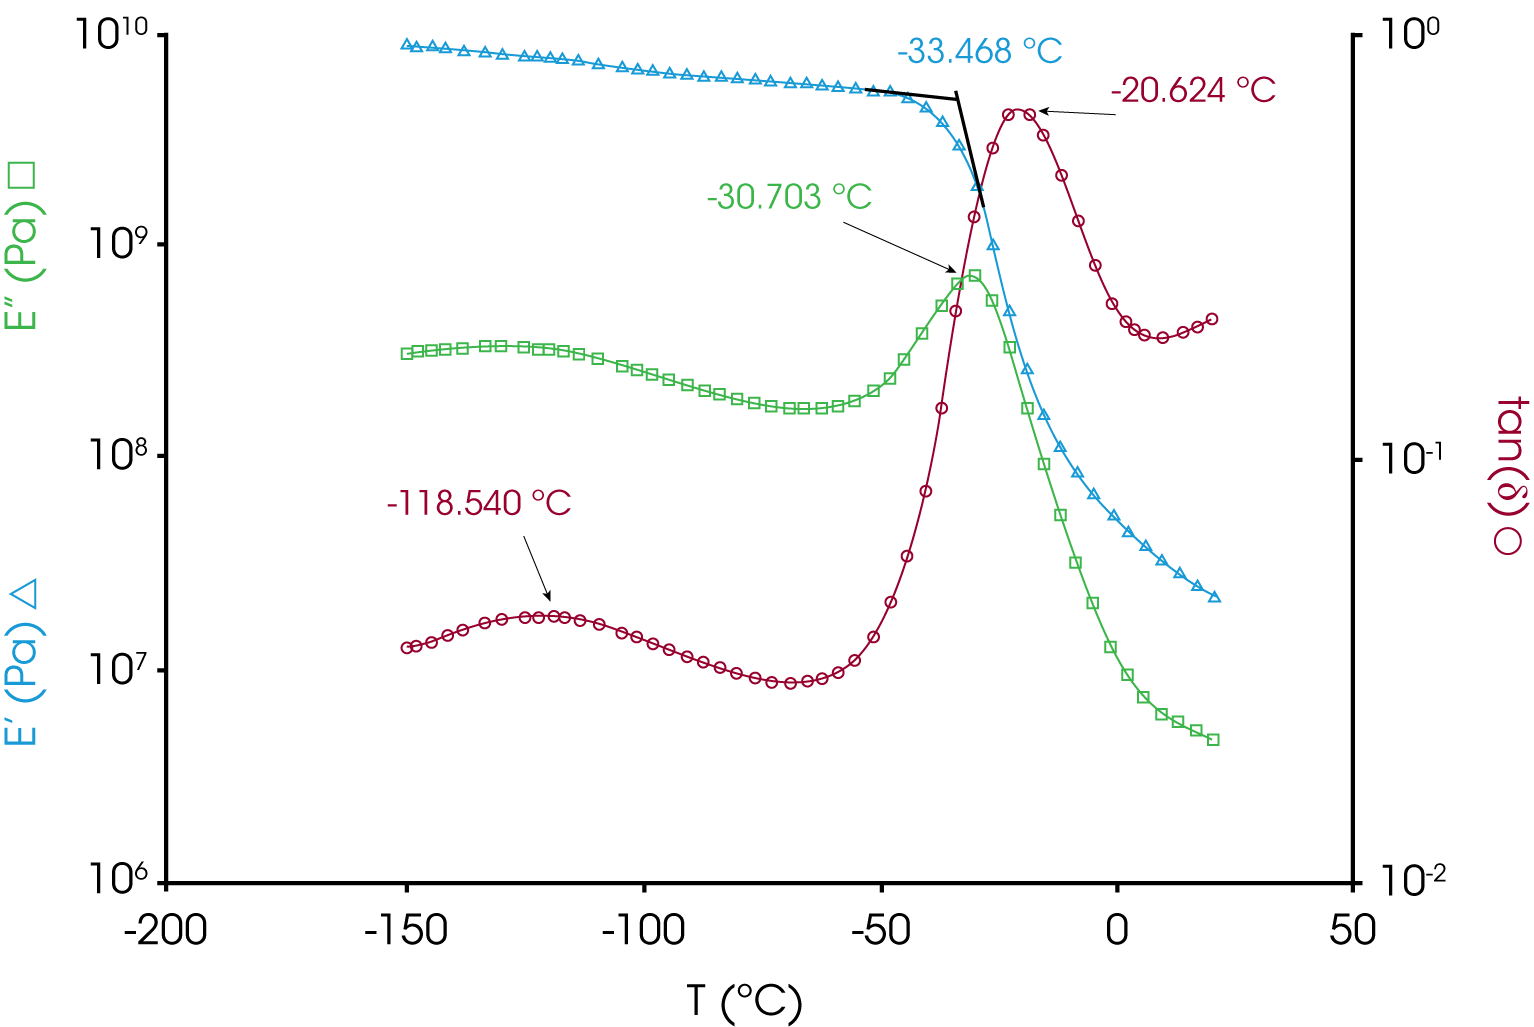
6. Dynamic Mechanical Analysis (DMA) – Figure 16 shows viscoelastic data for the rubber sample with glass transitions apparent at ~ -30 °C and ~ -118 °C
Conclusions
The rubber sample is a chlororinated polyethylene. Sample is highly filled containing about 20% carbon black and 25% filler. Residual curing was detected in the DSC and MDSC® runs which explains the evolution of acetophenone and methane at 195 °C. Further analysis using TGA/GC/MS was used to identify by-products of the residual curing reaction and identify the peroxide initiator and two cross-linking coagents.
References
- I. Ben Talouba, L. Balland, N. Mouhab, M.Am Abdelghani-Idrissi. Kinetic Parameter Estimation for Decompostion of Organic Peroxides by Means of DSC Measurements. Journal of Loss Prevention in the Process Industries. 24, 2011, Vols.391- 396.
- Maria Daniela Stelescu, Elena Maniala, Niculina Zuga. The Use of Polyfunctional Monomers in the Radical Cure of Chlorinated Polyethylene. Polymer Journal. 2011, Vol. 43,792- 800.
- T. Andrews, R.N. Hampton, A. Smedberg, D. Wald, V Waschk, W. Weissenberg. The Role of Degassing in XLPE Power Cable Manufacture. IEEE Electrical Insulation Magazine. November / December, 2006, Vol. 22, 6.
- Hong Zhao, Junqi Chen, Hui Zhang, Yan Shang, Xuan Wang, Baozhong Han, Zeseng Li. Theoretical Study on the Reaction of Triallyl Isocyanurate in the UV Radiation Cross-Linking of Polythylene. Royal Society of Chemistry Advances. July 26, 2017, Vol. 7, 37095.
Acknowledgement
- James Browne, Sr. Applications Support Engineer (TA Instruments)
- Yash Adhia, Applications Scientist (TA Instruments)
- Kevin Whitcomb, Ph.D, Applications Scientist (TA Instruments)
- Terri Chen, Ph.D, Applications Scientist (TA Instruments)
Click here to download the printable version of this application note.

