Keywords: TGA, kinetics, Activation Energy, Lifetime, PTFE, PCTFE, Insulation materials
TA125
Abstract
In many polymer applications the ability to predict product lifetime is valuable because the costs of premature failure in actual end use can be high. For example, federal regulations require the estimation of component lifetime in nuclear reactors, while power companies need to know how long insulation in transformers and transmission lines will last. Thermogravimetric Analysis (TGA) provides a method for accelerating the lifetime testing of polymers so that short term experiments can be used to predict in-use lifetime.
Introduction
Wire insulation is an important polymer application in which the insulated material to use must be resistant to an electric current. The evaluation of the long-term product lifetime of wire insulation materials is of vital importance, and a rapid way to do so is prominent. One test commonly used for estimating wire insulation lifetime is ANSI/ASTM procedure D-2307. In this procedure, twisted pairs of insulated wire are oven aged (for up to 50 days) at elevated temperatures (up to 240 °C) until voltage breakdown occurs. A series of such tests, performed at different oven temperatures, creates a semi-logarithmic plot of lifetime versus the reciprocal of failure temperature. The method assumes first order kinetics and uses extrapolation to estimate the long lifetimes encountered at normal use temperature. The application of first order kinetics to the estimation of polymer lifetimes is particularly arbitrary. Many polymers are known to decompose with first order kinetics. For those that do not, the earliest stages of decomposition can be approximated well with first order kinetics. [1,2,3,4,5]. This procedure, while useful, is very time consuming, often taking many months particularly for highly stable materials. As more and more stable polymeric electrical insulation materials are introduced, the time needed for a full series of tests become excessive. Therefore, It is desirable, if not necessary, to find a more practical technique.
Thermogravimetric Analysis (TGA), which monitors weight changes in a material as temperature changes, offers a viable alternative to oven aging. In the TGA approach, the material is heated at several different rates through its decomposition region. From the resultant thermal curves, the temperatures for a constant decomposition level are determined. The kinetic activation energy is then determined from a plot of the logarithm of the heating rate versus the reciprocal of the temperature of constant decomposition level. This activation energy may then be used to calculate estimated lifetime at a given temperature or the maximum operating temperature for a given estimated lifetime. This TGA approach requires a minimum of three different heating profiles per material. However, even with the associated calculations, the total time to evaluate a material is less than one day. With an automated TGA such as the TA Instruments TGA 5500, the actual operator time is even lower with overnight evaluation being possible.
Experimental
The specific experimental conditions used (such as temperature range and specimen atmosphere) depend upon the material being tested. However experimental design and data reduction are similar for each material. In the analysis illustrated here, commercial polymers Polytetrafluoroethylene (PTFE) (Sigma Aldrich, powder, particle size >40 µm) and Polychlorotrifluoroethylene (PCTFE or PTFCE) (Eastman Organic Chemicals, pellets), which are high temperature fluoropolymer materials used in wire insulation applications were examined.
The sample sizes were 48 ± 2 mg for PTFE and 46 ± 2 mg for PCTFE. Decomposition profiles were obtained while heating at 1, 2, 5, 10 and 20 °C/min in Nitrogen as purge gas, between 200 °C and 700 °C. The profile during the first 25% of sample weight loss was used for subsequent calculations.
All tests were done in duplicate.
Results & Discussion
Figures 1 and 2 display the overlaid weight loss curves at several different heating rates for PTFE and PCTFE respectively. The first step in the data analysis process is the choice of level of decomposition. Typically, a value early in the decomposition profile is desired since the mechanism here is more likely to be that of the actual product failure. On the other hand, taking the value too early on the curve may result in the measurement of some volatilization (e.g. moisture) which is not involved in the failure mechanism. A value of 5% decomposition level (sometimes called “conversion”) is a commonly chosen value. A 5% conversion rate usually corresponds to the beginning of the degradation process, and this level of degradation can cause a significant decrease of the mechanical properties of a material. Other values may be selected to provide correlation with other types of lifetime testing [6].
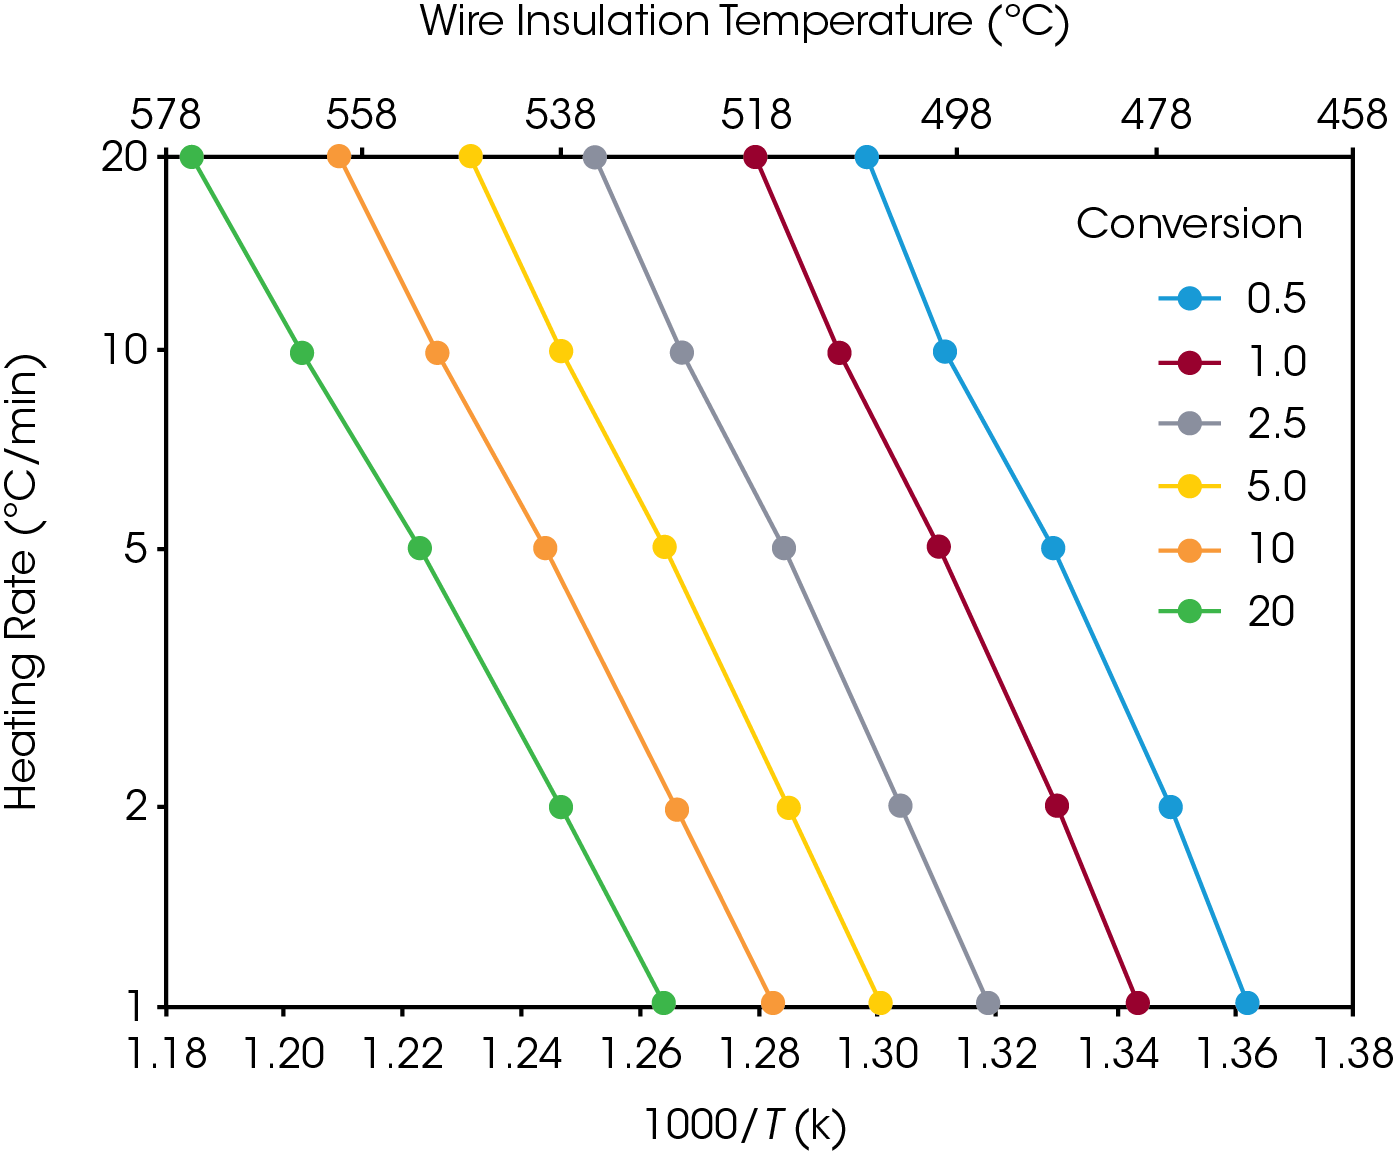
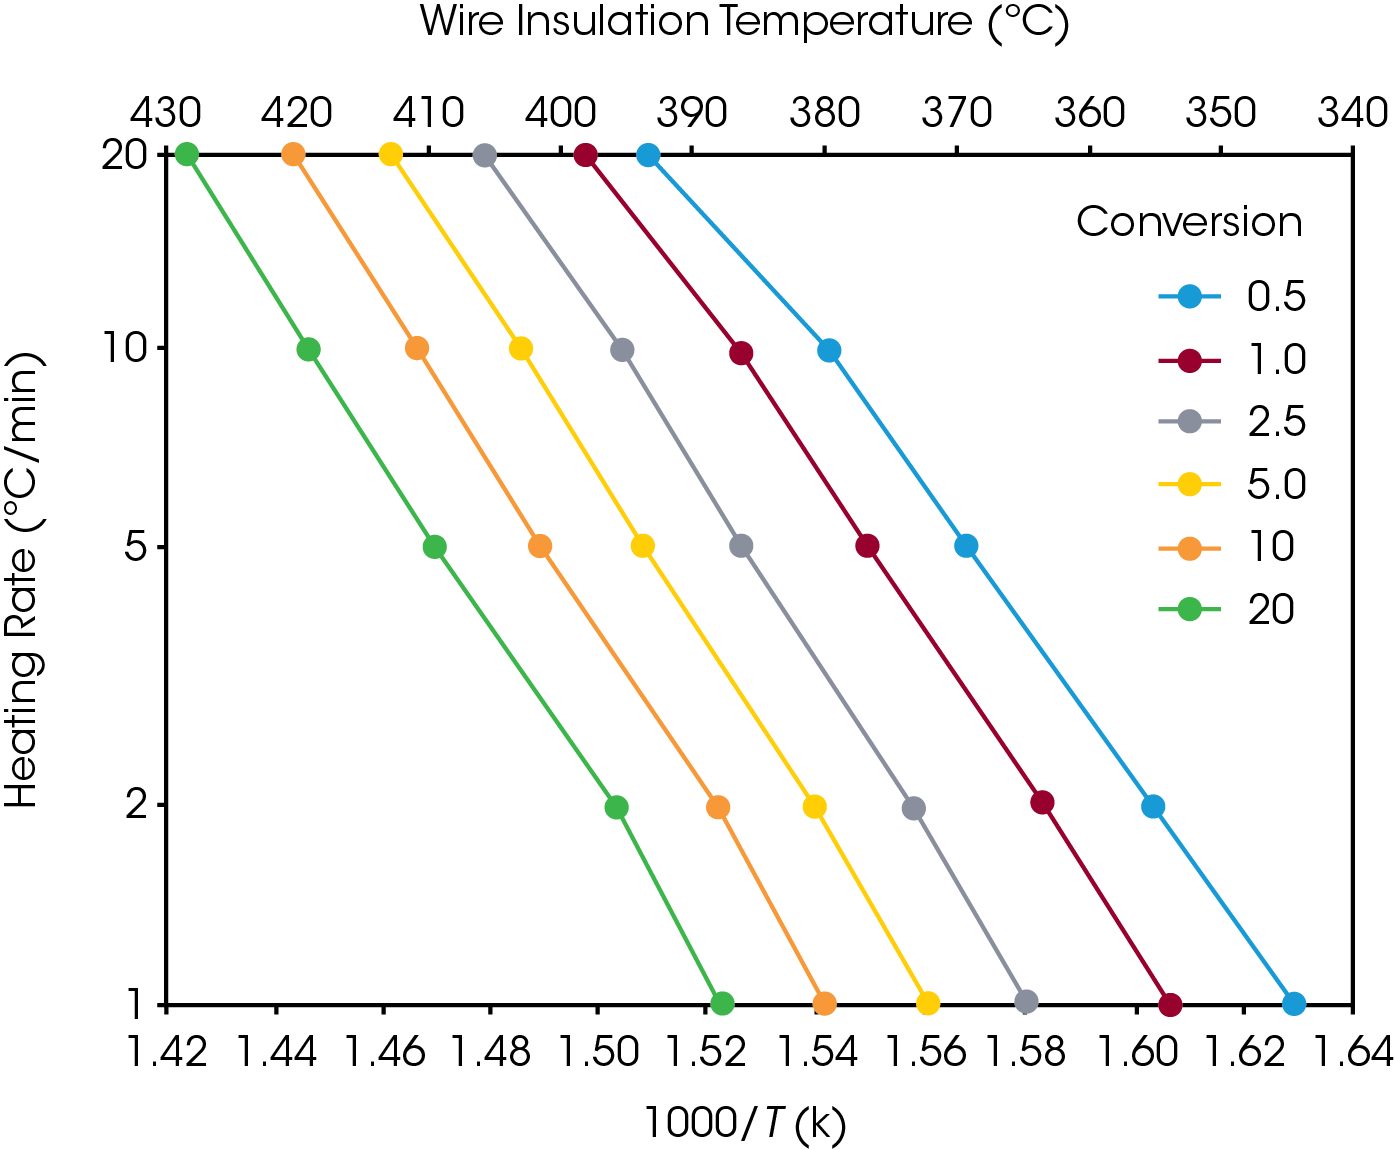
Using the selected value of conversion, the temperature (in kelvin) at that conversion level is measured for each thermal curve. A plot of the logarithm of the heating rate versus the corresponding reciprocal temperature at constant conversion is prepared. The plotted data should produce a straight line.
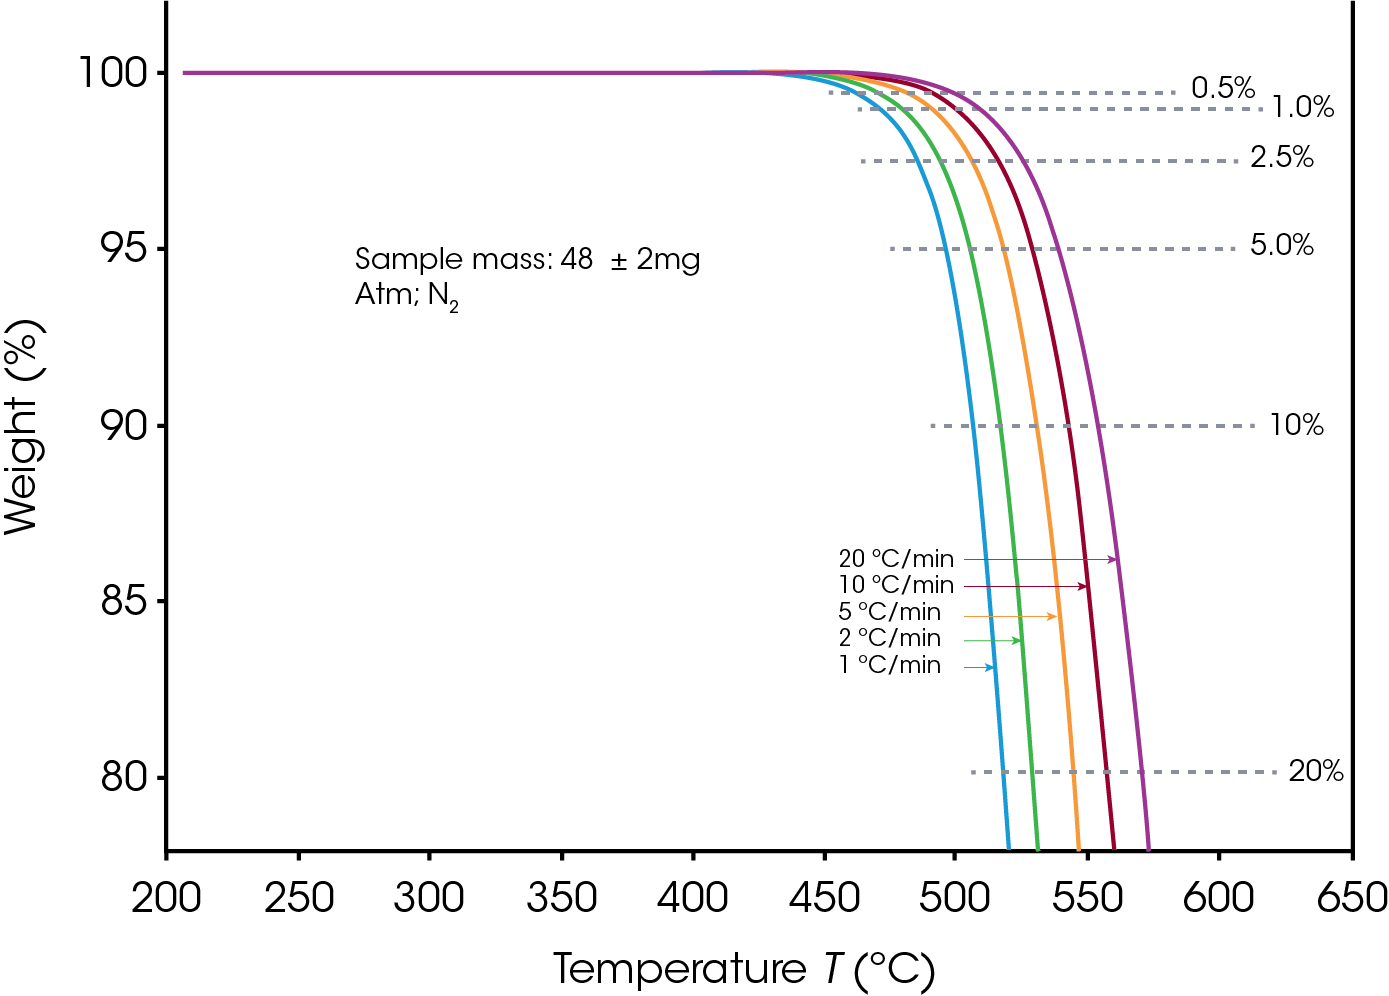
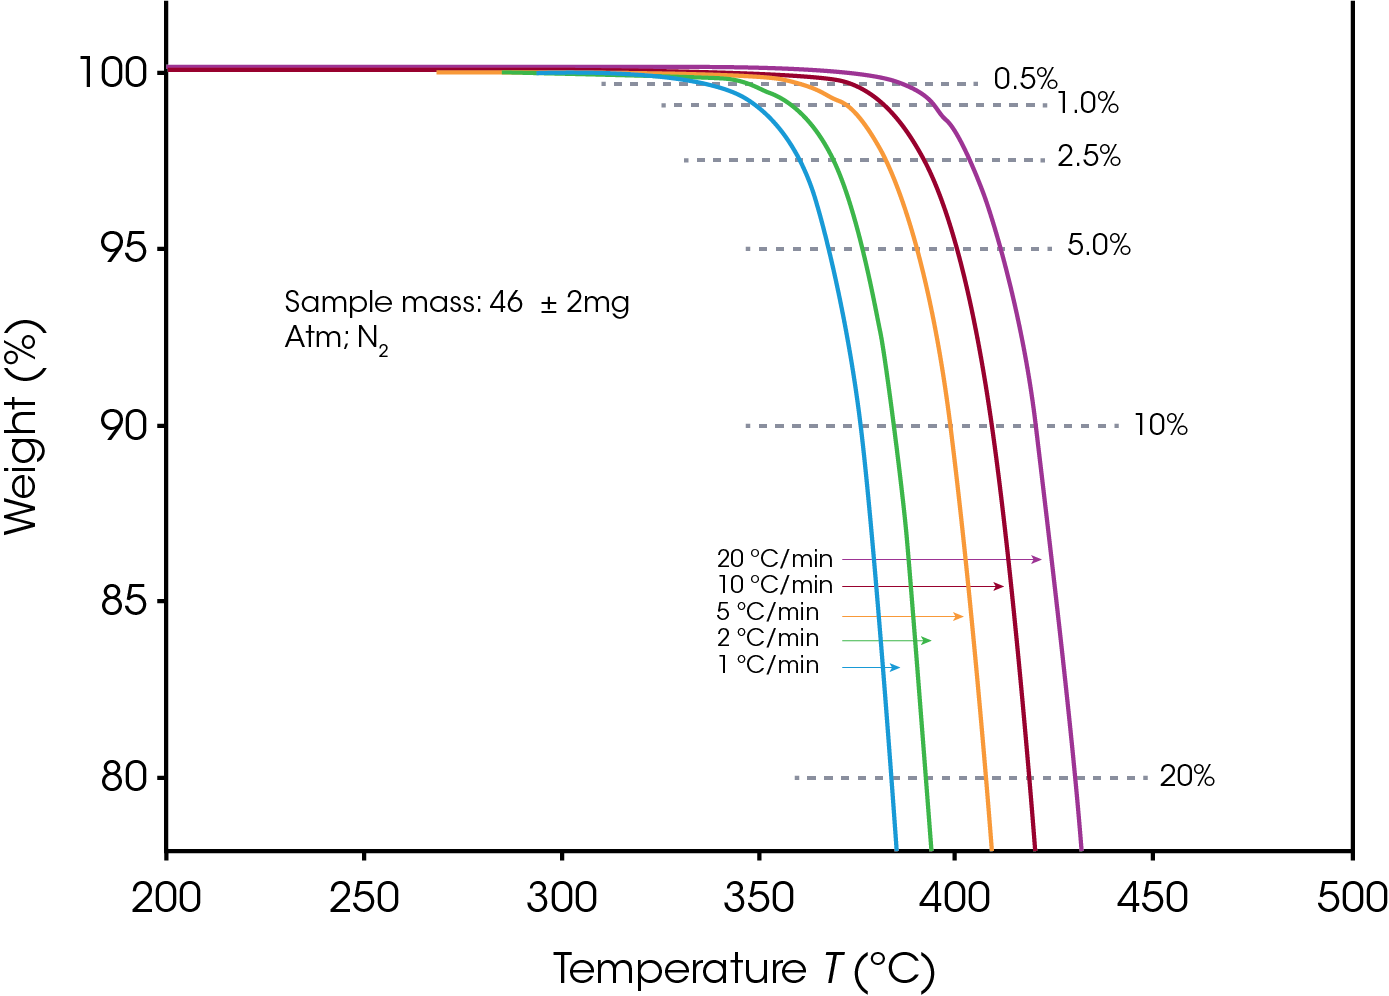
Figures 3 and 4 show a series of such lines created from the four curves shown in Figures 1 and 2 by plotting data at different conversion levels. If the particular specimen decomposition mechanism were the same at all conversion levels, the lines would all have the same slope. This is not the case here. The lines for the low conversion cases are somewhat different from those of 5% and higher conversion. This justifies our selection of 5% conversion as the “best” point of constant conversion for the purposes of this test.
The next step in the process is the calculation of activation energy (E) from the slopes in Figures 3 and 4 using the method of Flynn and Wall [7, 8].
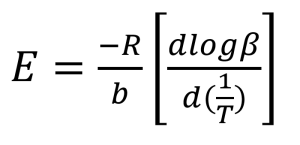
Where:
E = Activation Energy (J/mol)
R = Gas Constant (8.314 J/mol K)
T = Temperature at Constant Conversion (K)
β = Heating Rate (°C/min)
b = Constant, approximation derivative (0.457) [7]
The value of the derivative term (dlogβ)/[d(1/T)] is the slope of the line in Figures 3 and 4.
The value for the constant b (given in tabular form in references [7] and [8]) will vary depending upon the value of E/RT. Therefore, an iterative process must be used where E is first estimated by replacing in equation (1) the suggested b value above and the calculated slope of the lines in Figures 3 and 4; next calculate the value for E/RTc, where Tc is the temperature at constant conversion for the heating rate closest to the midpoint of the experimental heating rates [7], (for example, if conversion is 5%, Tc = 791.2K, which corresponds to the temperature at 5 °C/min heating rate at that conversion). then, using the obtained value for E/RTc, choose a corresponding value for b from table 1 in reference [7] (see Appendix A).
This process is continued until E no longer changes with successive iterations.
The activation energy values and the corresponding values for E/RT calculated for the conversion cases shown in figures 3 and 4 are presented below (For all iterations, Tc is the temperature at a heating rate of 5 °C/min at each specific conversion).
| Activation Energy for PTFE | ||
|---|---|---|
| (Wire Insulation Decomposition) | ||
| Conversion % | E/RT | Activation Energy (kJ/mol) |
| 0.5 | 59 | 373.49 |
| 1.0 | 59 | 374.41 |
| 2.5 | 56 | 365.38 |
| 5.0 | 53 | 346.21 |
| 10 | 49 | 325.0 |
| 20 | 44 | 301.85 |
| Activation Energy for PTFE | ||
|---|---|---|
| (Wire Insulation Decomposition) | ||
| Conversion % | E/RT | Activation Energy (kJ/mol) |
| 0.5 | 40 | 211.74 |
| 1.0 | 41 | 222.18 |
| 2.5 | 43 | 237.09 |
| 5.0 | 43 | 238.68 |
| 10 | 43 | 238.43 |
| 20 | 41 | 238.68 |
Using the activation energy obtained for the conversion rate of 5%, an analysis of the lifetime of the polymer in relation to different temperatures can be done by using the following equation, proposed by Toop [9]:

Where:
tf = Estimated Time to Failure (min)
E = Activation Energy (J/mol)
Tf = Failure Temperature (K)
R = Gas Constant (8.314 J/mol K)
P(Xf) = A function whose values depend on E at the failure temperature.
Tc = Temperature at constant conversion at β (K)
β = Heating rate (°C/min) (closest to the midpoint of the experimental heating rates)
To calculate the estimated time to failure (tf), the value for the temperature (Tc) at the constant conversion point is first selected for a slow heating rate (β) (for this study, Tc is the temperature at 5% weight loss and β is 5 °C/min). This value, along with the activation energy (E) is used to calculate the quantity E/RT. The E/RT value is then used to select a value for log P(Xf) from the numerical integration table given in reference [9] (see Appendix B). The numerical value for P(Xf) can then be calculated by taking the antilogarithm. Selection of a value for failure (or operation) temperature (Tf) permits the calculation of tf from equation 2 above.
Rearrangement of equation 2 yields a form which may be used to calculate the maximum use temperature (Tf) for a given lifetime (tf).

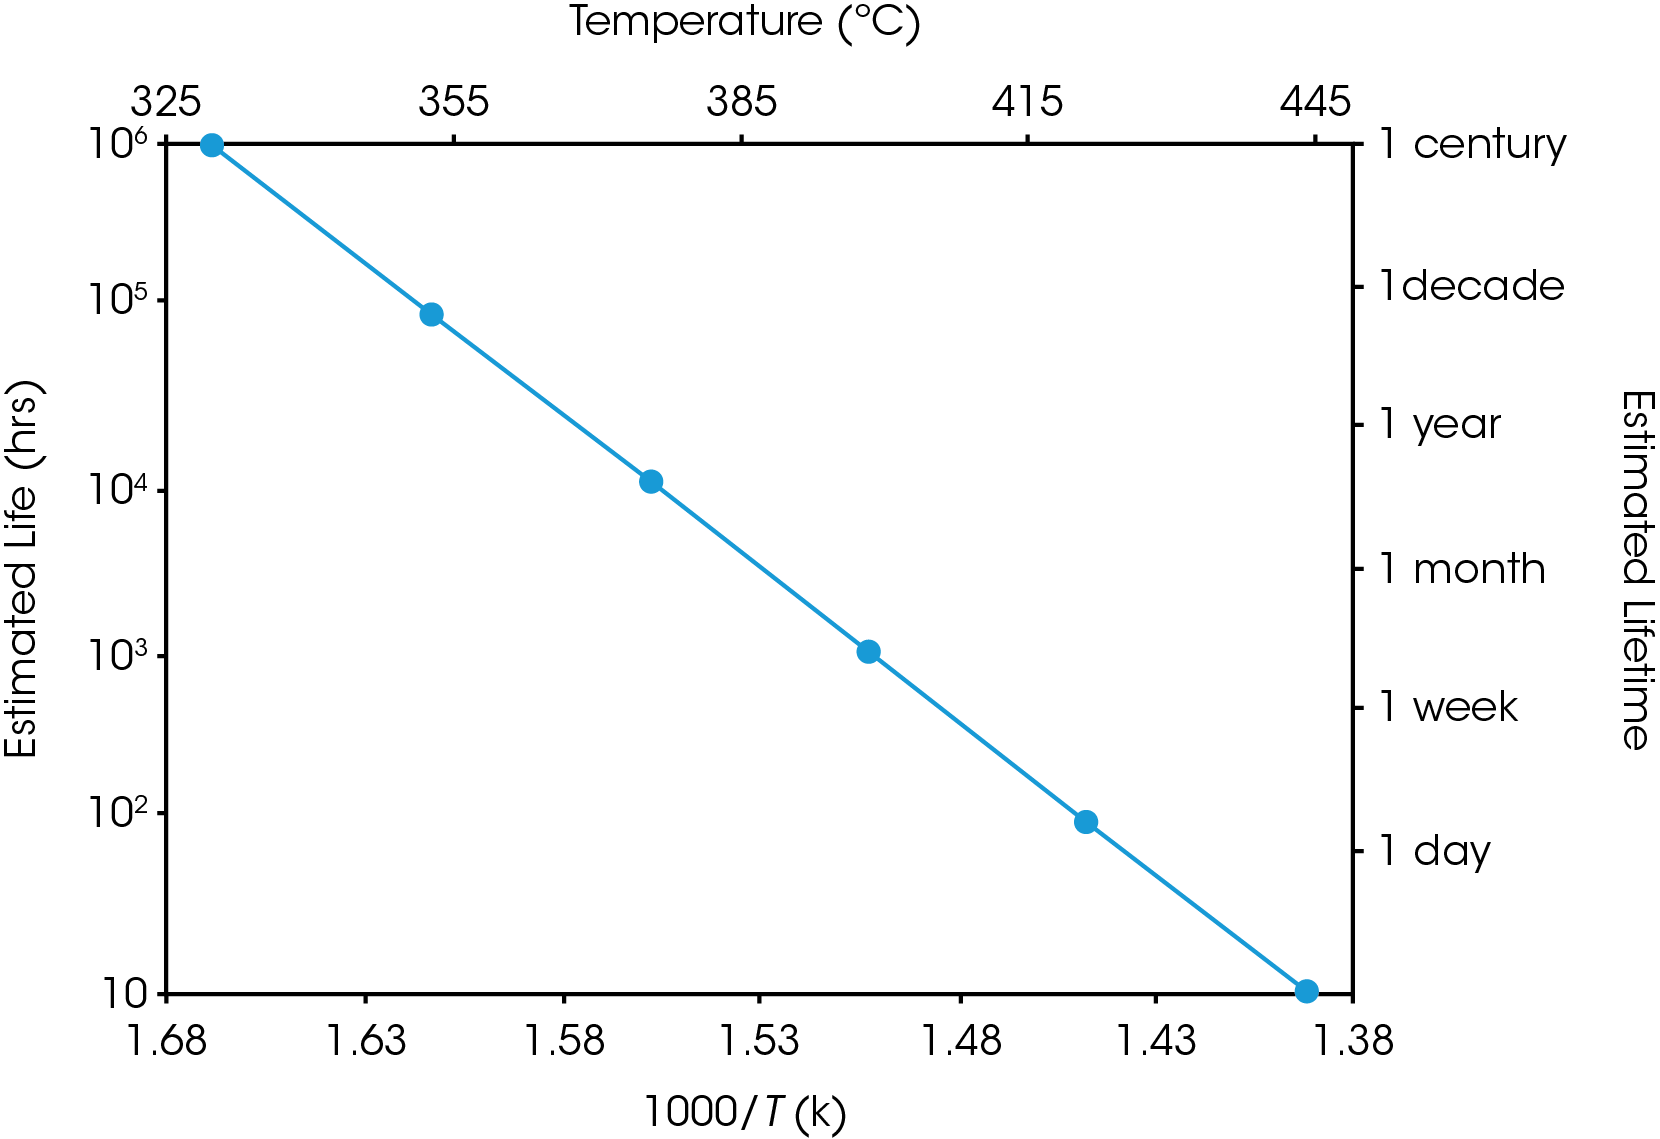
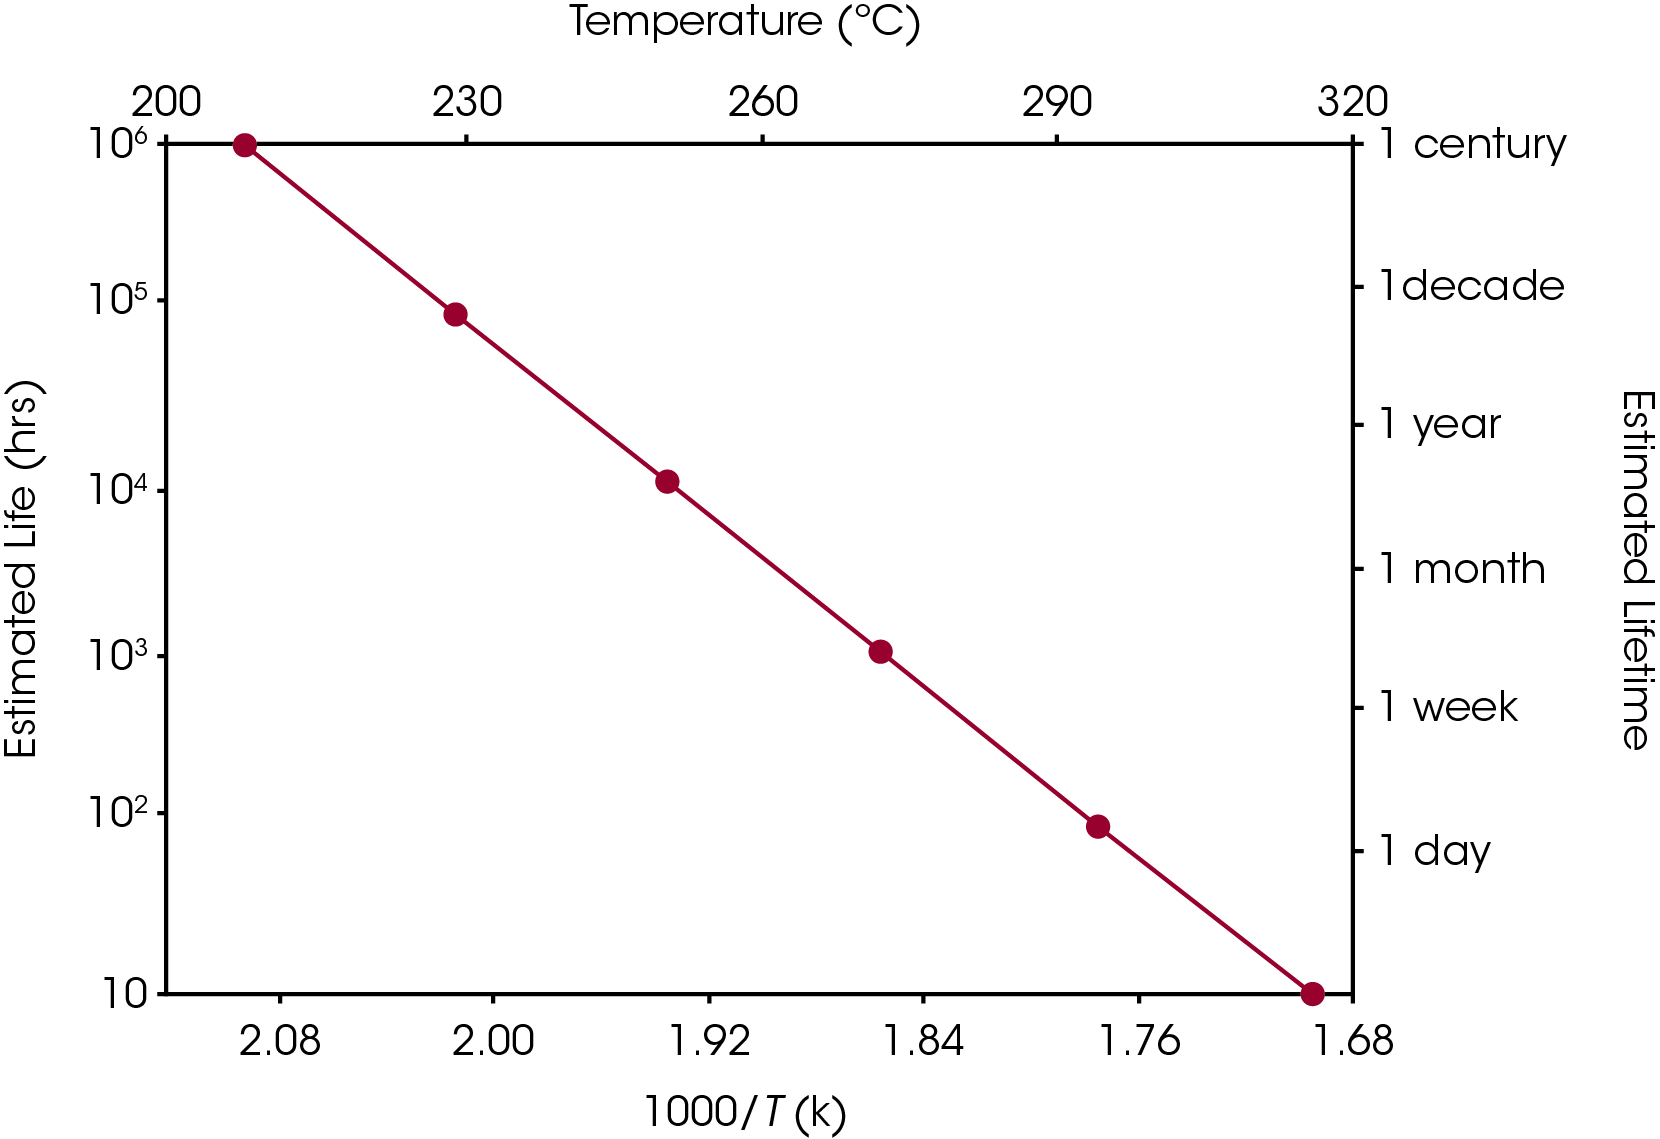
Equation 2 may be used to create a plot, similar to the ones in Figures 5 and 6, in which (the logarithm of) estimated lifetime is plotted versus (the reciprocal) of the failure temperature. From a plot of this nature, the dramatic increase in estimated lifetime for a small decrease in temperature can be more easily visualized.
Kinetic parameters may also be determined by other thermoanalytical techniques. Differential Scanning Calorimetry (DSC) and Pressure DSC may be used to obtain such parameters for using in the estimation of thermal hazard potential of chemicals [10].
Conclusions
The kinetic analysis of the thermogravimetry of polymers involves comparison of data from tests performed at different temperature programs, at least three different heating rates per material must be used. In this study, the estimated lifetime of polymeric materials used in wire insulation applications can be conducted using the TGA approach, which is an alternative to the time consuming oven aged technique.
References
1. ASTM D2307 – 07a (2013), Standard Test Method for Thermal Endurance of Film-Insulated Round Magnet Wire. ASTM International, West Conshohocken, PA, 2011, www.astm.org.
2. IEEE Guide for the Statistical Analysis of Thermal Life Test Data,” in ANSI/IEEE Std 101-1987(R2010) (Revision of IEEE Std 101-1972), vol., no., pp.1-34, 31 Dec. 1988.
3. IEEE Standard Test Procedure for Evaluation of Systems of Insulation for Dry-Type Specialty and General-Purpose Transformers,” in ANSI/IEEE Std 259-1999, 15 Sep. 1999.
4. IEEE Test Procedure for Evaluation of Insulation Systems for Electronics Power Transformers,” in IEEE No 266-1969, vol., no., pp.1-14, 26 March 1969.
5. EEE Trial-Use Standard: General Guide for Qualifying Class I Electric Equipment for Nuclear Power Generating Stations,” in IEEE No 323, April 1971, vol., no., pp.1-7, 1 April 1971.
6. L. Krizanovsky, et. al. materials. J. Therm. Anal., 13, 571 (1978).
7. ASTM E1641-18, Standard Test Method for Decomposition Kinetics by Thermogravimetry Using the Ozawa/Flynn/Wall Method, ASTM International, West Conshohocken, PA, 2018, www.astm.org
8. Flynn, J.H. and Wall, L.A. A Quick, Direct Method for the Determination of Activation Energy from Thermogravimetric Data. Polymer Letters, 4, 323-328 (1966)
9. D.J. Toop, “Theory of Life Testing and Use of Thermogravimetric Analysis to Predict the Thermal Life of Wire Enamels”, IEEE Trans. Elec. Insul., E1-6, 2 (1971).
10. ASTM E698-18, Standard Test Method for Kinetic Parameters for Thermally Unstable Materials Using Differential Scanning Calorimetry and the Flynn/Wall/Ozawa Method, ASTM International, West Conshohocken, PA, 2018, www.astm.org
Acknowledgement
This note was edited by Yaritza Sanchez, Applications Support Engineer at TA Instruments | Waters.
Click here to download the printable version of this application note.

