Keywords: 3D Printing, Additive Manufacturing, UV Curing, Photosensitive Resins, moduli crossover, rheology
RH118
Abstract
Photo-curing 3D printing or additive manufacturing is a popular method of 3D printing where a light source projects light onto a print surface, to cure UV photosensitive resins in a layer-by-layer fashion, to produce a three-dimensional object. Advancements in printer cost, software availability, resin development, and other technological breakthroughs have made photo-curing printing more accessible, opening the market further to hobbyists, researchers, and industry. [1] The properties of the photosensitive resins play a key role in the curing process and the final properties of the 3D printed object, ultimately resulting in optimization both the fluid and cured solid properties. These include resin viscosity, storage and loss moduli, shrinkage, and curing time. Rheology allows for the characterization of these highly relevant properties, pertaining to both the liquid and final solid state of the resin, while the resin undergoes UV curing. In this applications note several UV resins are characterized and compared, all using a TA Instruments Discovery HR model rheometer, equipped with the UV curing accessory.
Introduction
Photo-curing printing is one of many 3D printing technologies, where photosensitive materials in a vat (volumetric container) are cured in a selective geometric sequence while adhered to a substrate. There are various names for photo-curing printers depending on the light source, light spectrum, curing mechanism, and instrument specific design, these include stereo lithography appearance (SLA), digital light processing (DLP), liquid crystal display printing (LCD), continuous liquid interface production (CLIP), as well as others. [1,2] For each method, the material is cured in a layer-by-layer fashion (2.5D printing), where the newest layer of cured material adheres to the previous and forms the new surface of the growing substrate. As the substrated volume grows, or as each layer is completed, a vertically moving platform advances, either advancing further into the liquid vat, or out of the vat into air. The final sequence of thin cured layers (each layer on the length scale of 1-100µm) forms a three-dimensional object. The sequence of instructions that the printer uses to fabricate the object, is derived from a “slicing” algorithm, which takes a 3D digital model of an object and breaks it into layers based on user processing inputs. [3] Each layer is further broken down into an image where the light source is focused to trace out the layer geometry. The overall sequence is saved as an instruction file that the photo-curing printer can read back from at real time, similar to a computer numerical controlled (CNC) gantry. The “slicer” algorithm can customize this sequence based on user processing inputs, such as light power (intensity), exposure time, layer thickness, raster width, raster orientation, infill density, etc.
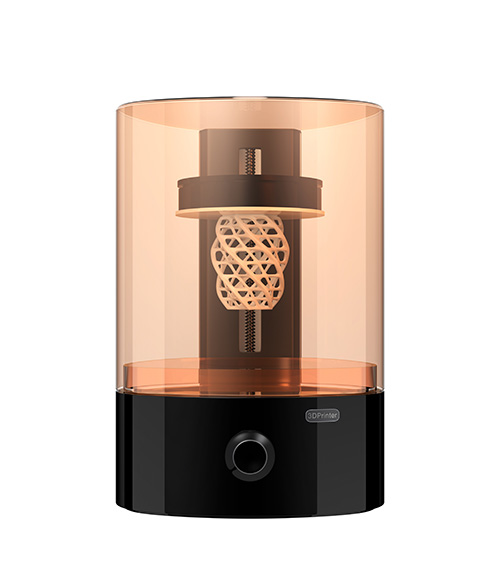
Photo-curing printing has become much more accessible, and the cost of entry has opened the market to an expanded diverse group of users. As such research efforts have been focused on the development of improved formulations of existing resins, resins based on newer materials, and other ventures such as biodegradable/biobased resins. [4,5] Important characteristics of the resins include shrinkage on cure, modulus after a cure cycle, and resin viscosity. Shrinkage determines the difference between the programmed dimensions of the printed part, and the final dimensions after printing. [6,7,8] Modulus allows for the qualitative determination of the extent of cure, and of final part performance.[9,10] Viscosity gives a metric indicating whether or not a material needs to be printed with support, and if viscous forces will peel apart from the base substrate prematurely as the print proceeds and the part is pulled out of the liquid resin vat.[6] While the properties and performance of these resins can be characterized in a variety of ways, capturing multiple metrics simultaneously can present a challenge. Here in this applications note, we demonstrate methods of characterizing the UV resins using rheology.
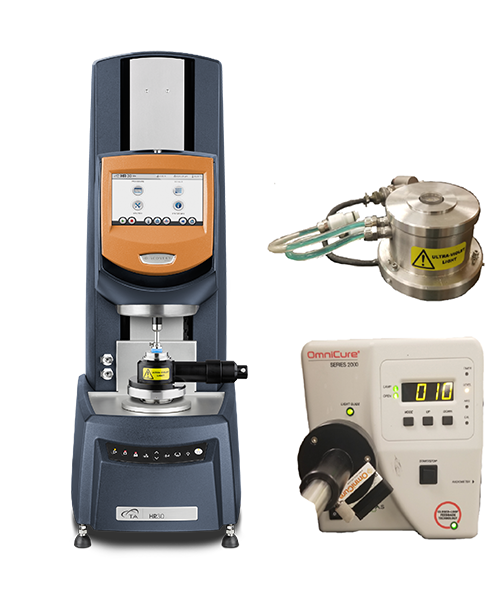
Rheology allows for the characterization of the viscosity or the resistance of flow for a fluid. Oscillatory rheological measurements can measure the viscoelastic properties of a material (fluids or solids). The viscoelastic properties include the elastic modulus, the loss modulus, the phase angle delta (damping factor), and the resistance to flow or viscosity. For UV resins, with the appropriate UV accessory, these properties can be measured during the curing process. Light accessories include monochromatic filters for the OmniCure mercury lamp, as well as standalone LED fixtures with specific wavelengths. Additionally, the rheometer allows for the simulation of the processing conditions that a resin may experience during typical photo-curing printing, mimicking the layer thickness, laser intensity (or power), and exposure time of a layer. This demonstrates the rapid characterization and comparison of various UV resin candidates that can be performed using a TA instruments Discovery HR rheometer (or an ARES-G2 rheometer).
Experimental
Three UV photo-curing commercial resins (grey color) were used in this note, each sold at a different price point, and purchased online. Measurements were performed on a TA Instruments Discovery HR model rheometer with the light guide UV geometry. The light source was an OmniCure 2000 series equipped with a mercury lamp, with a spectral distribution of 320-500nm.
Initial flow sweep experiments were performed at shear rates of 0.01-100 s-1, to obtain viscosity as a function of shear rate for the three resins. Curing tests were performed using oscillatory time sweeps in fast sampling mode at 2 rad/s and 25 rad/s, axial force control was enabled at a setpoint of 0N, fast sampling mode allows for a sampling rate of twice the oscillatory frequency up to 25 rad/s. Samples were oscillated for a period of 30 seconds, and then were exposed to UV at a set intensity and time duration. Storage modulus, loss modulus, complex viscosity and gap were all monitored during curing as a function of time. The bottom plate geometry used was a 20mm disposable acrylic plate, which provides uniformly distributed light to the loaded sample. The top plate geometry was a 20mm aluminum disposable plate.
Results and Discussions
Comparison of Curing Resins
Viscosity of photo-curing UV resins plays a role in adhesion to the build plate in bottom-up photo-curing systems, where the light source is below the resin vat and the cured part is pulled up. As the material on the bottom of the vat is cured, and the moving platform is raised, viscous forces pull down on the part, allowing for the separation of the part from the build plate. This could be imagined as pulling a rod out of water versus out of tar. As such, the viscosity of the resins should be suitably low, or support material may have to be considered. Figure 3 features flow sweep experiment data, where viscosity is plotted as a function of shear rate for the three resins. Each is shear thinning and have viscosity values approximately spanning a decade. Variation in platform adhesion issues of a standard object using different resins may indicate a resin having too high of a viscosity, which can be identified here.
The final mechanical properties of cured parts are very important, as they relate to the applications and performance of the final printed part. Measuring the complex shear moduli of the materials as the cure proceeds allows for the comparison of resins cured with specific processing conditions (exposure intensity, exposure duration, layer thickness), and for the comparison of a resins final properties when subjected to changes in processing conditions. This indicates the relative amount of energy that is stored elastically or dissipated when the material is deformed with the linear viscoelastic region (LVR).
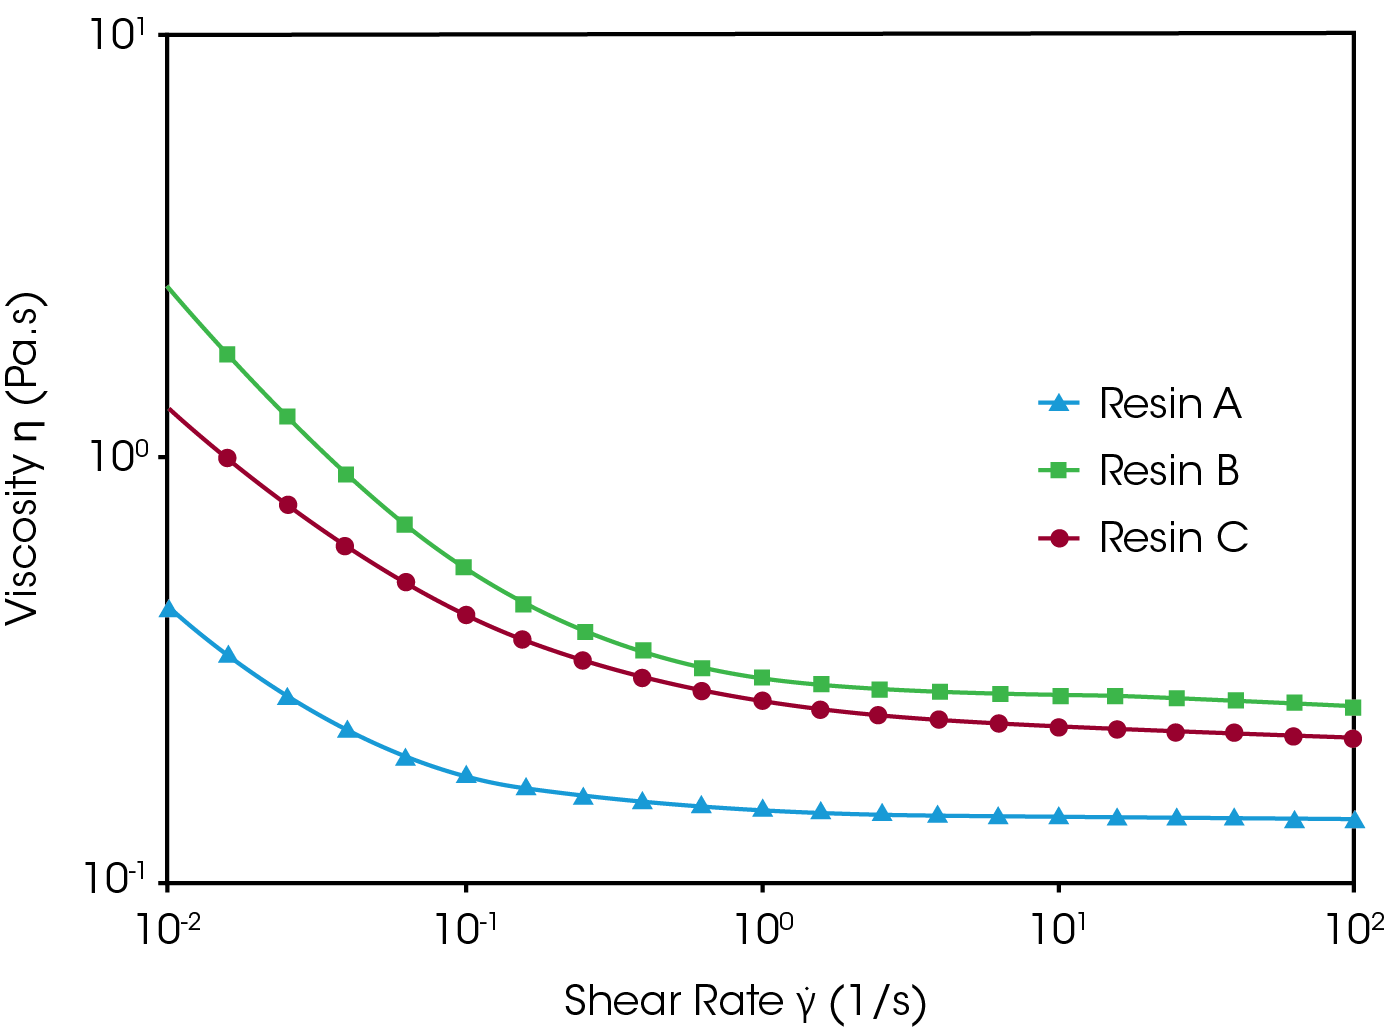
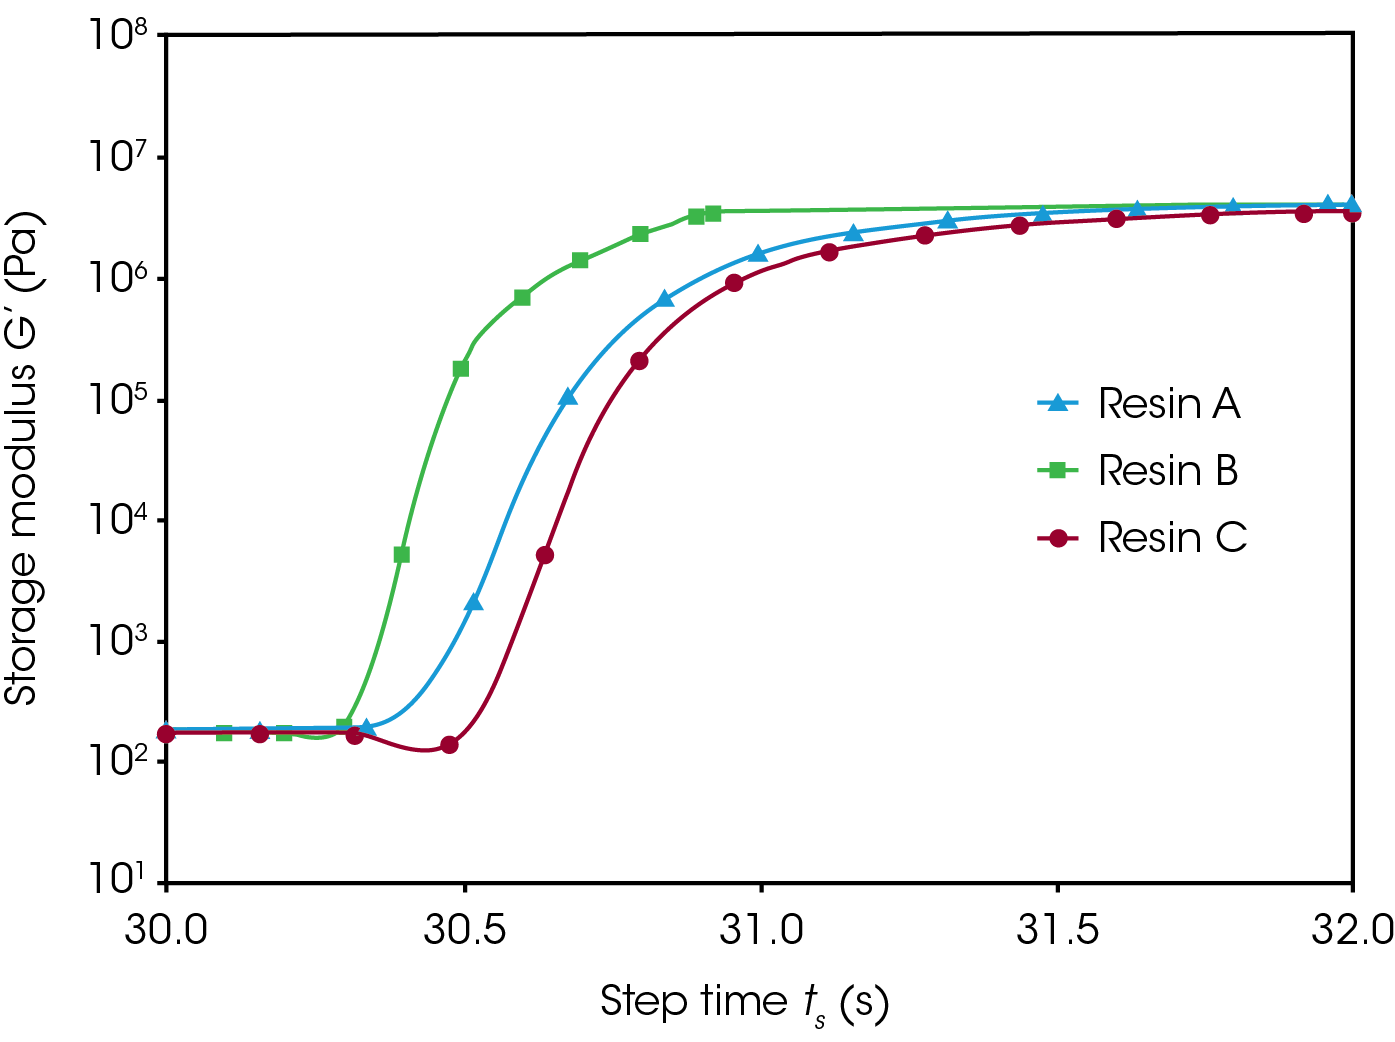
Figure 4 features data from on oscillatory time sweep experiment, where the storage and loss moduli are measured throughout a curing process for three different resins. Samples were loaded to a 100µm gap, and the 20 mW/cm2 light source was activated 30 seconds into the experiment, for a total exposure time of 10 seconds, representative of conditions used in photo-curing. What can be observed is that after curing resin B has a significantly higher storage modulus than the other two resins, which have similar storage modulus magnitudes. The loss modulus of resin B is also the largest in magnitude of the three, with the three resins also all having considerably different loss modulus magnitudes after curing. This gives an indication of the resin that may produce the strongest parts.
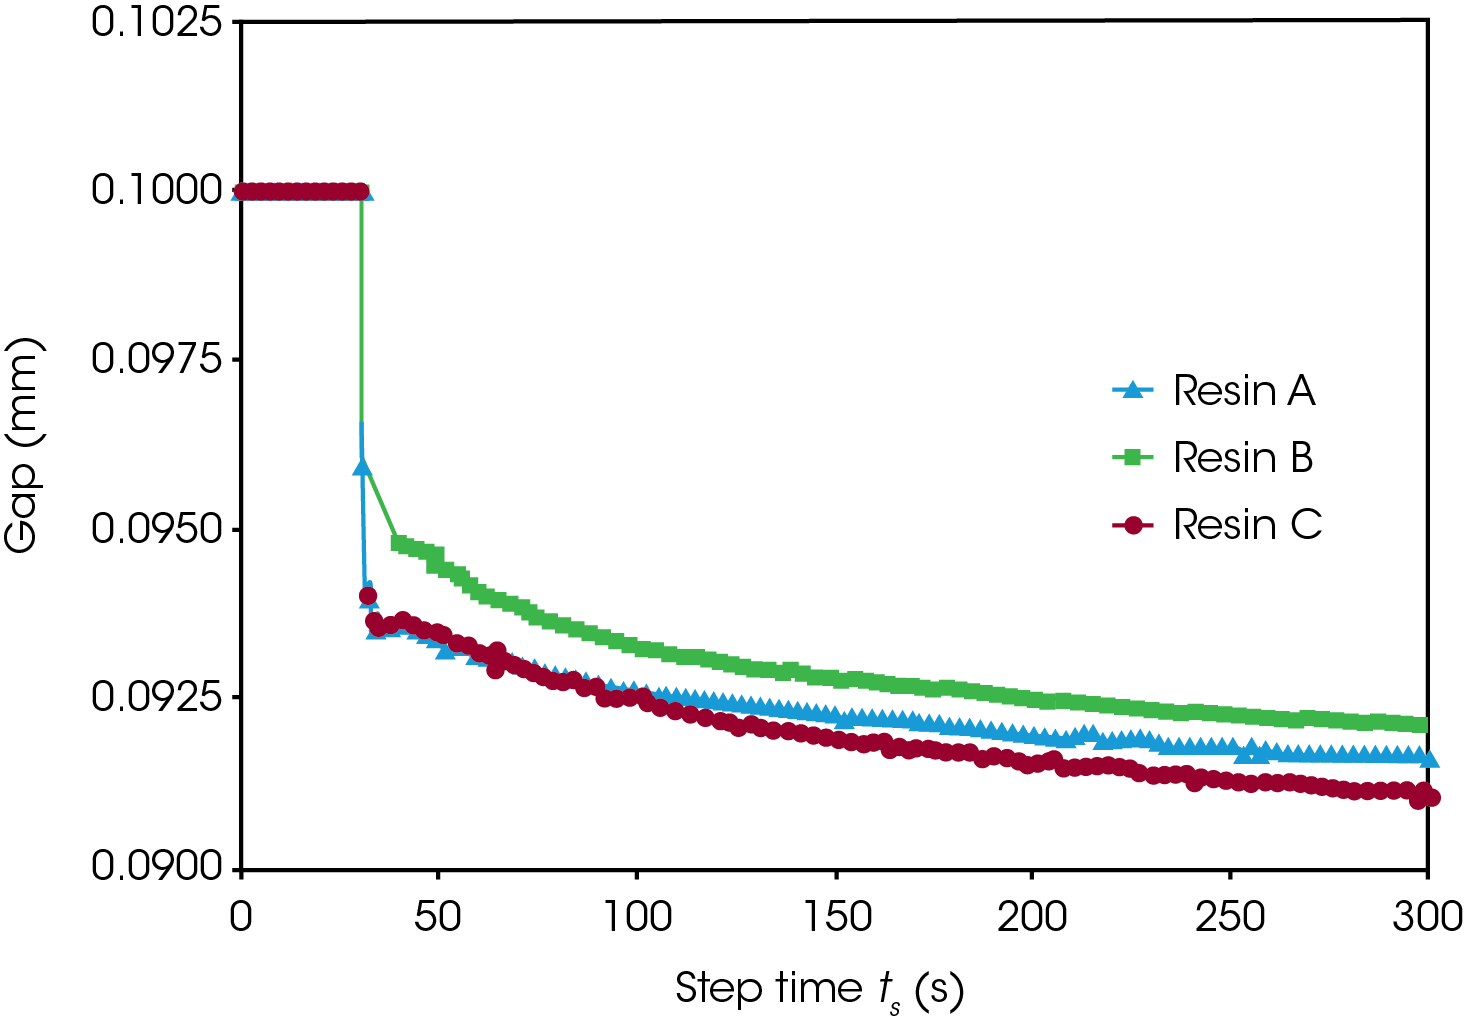
Figure 5 features data from the same experiment as in Figure 4, however here the instrument gap is plotted as a function of time. In curing experiments, the axial force is set at zero and is maintained there by adjusting the gap, this allows for the determination of shrinkage percentage after curing, an important property for photo-curing printing. Between the start and the end of the three experiments, the gap is reduced between 8-9%, with a difference 0.5% of shrinkage between the three resins. For applications requiring tight tolerances, 0.5% difference in shrinkage between resins can be considerable.
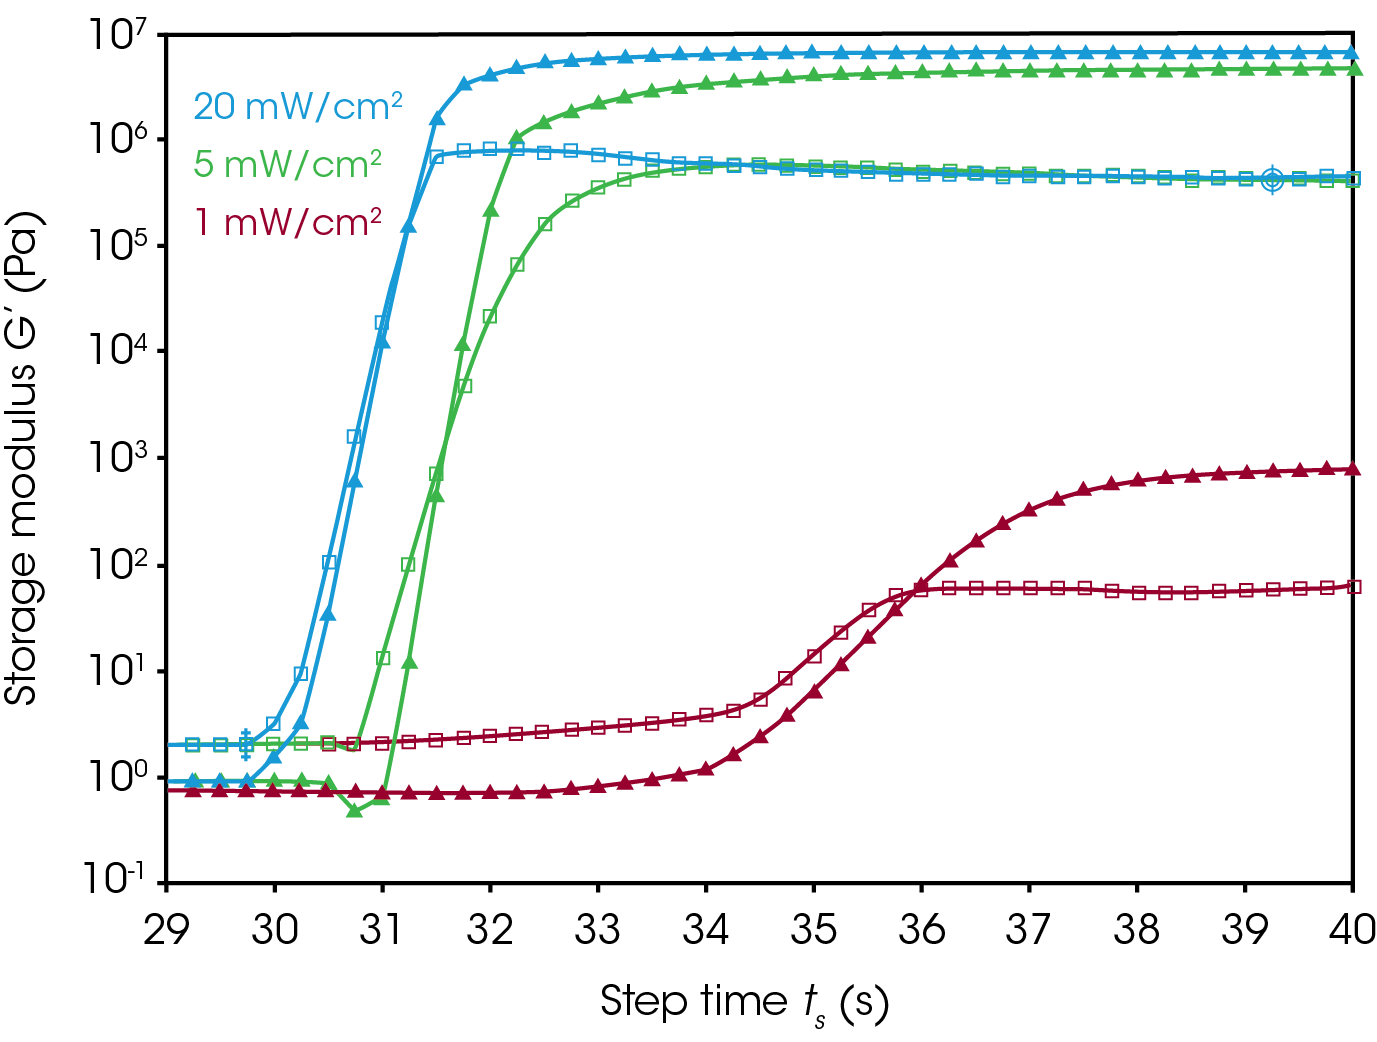
As an alternative to contrasting the properties of different resins, the rheometer UV accessory can be used to investigate the effect of various processing conditions on final properties. Figure 6 features data from three curing experiments on resin A, in one the sample was exposed to 20 mW/cm2 light for 5 seconds after a 30 second delay, the other samples were exposed to 5 mW/cm2 and 1 mW/cm2 intensity light respectively. All samples were loaded at a gap size of 100µm and were subjected to an oscillation frequency of 2 rad/s. It can be clearly seen from the moduli curves, that the sample exposed to higher intensity light exhibits higher storage modulus than the other samples. The sample exposed to the lowest intensity light shows a gradual progression of curing, with the sample left only partially cured. The fast sampling mode is able to successfully capture the curing events here within two seconds and longer with high resolution. Experiments of this nature allow for the optimization of process parameters without going directly to trial-and-error printing.
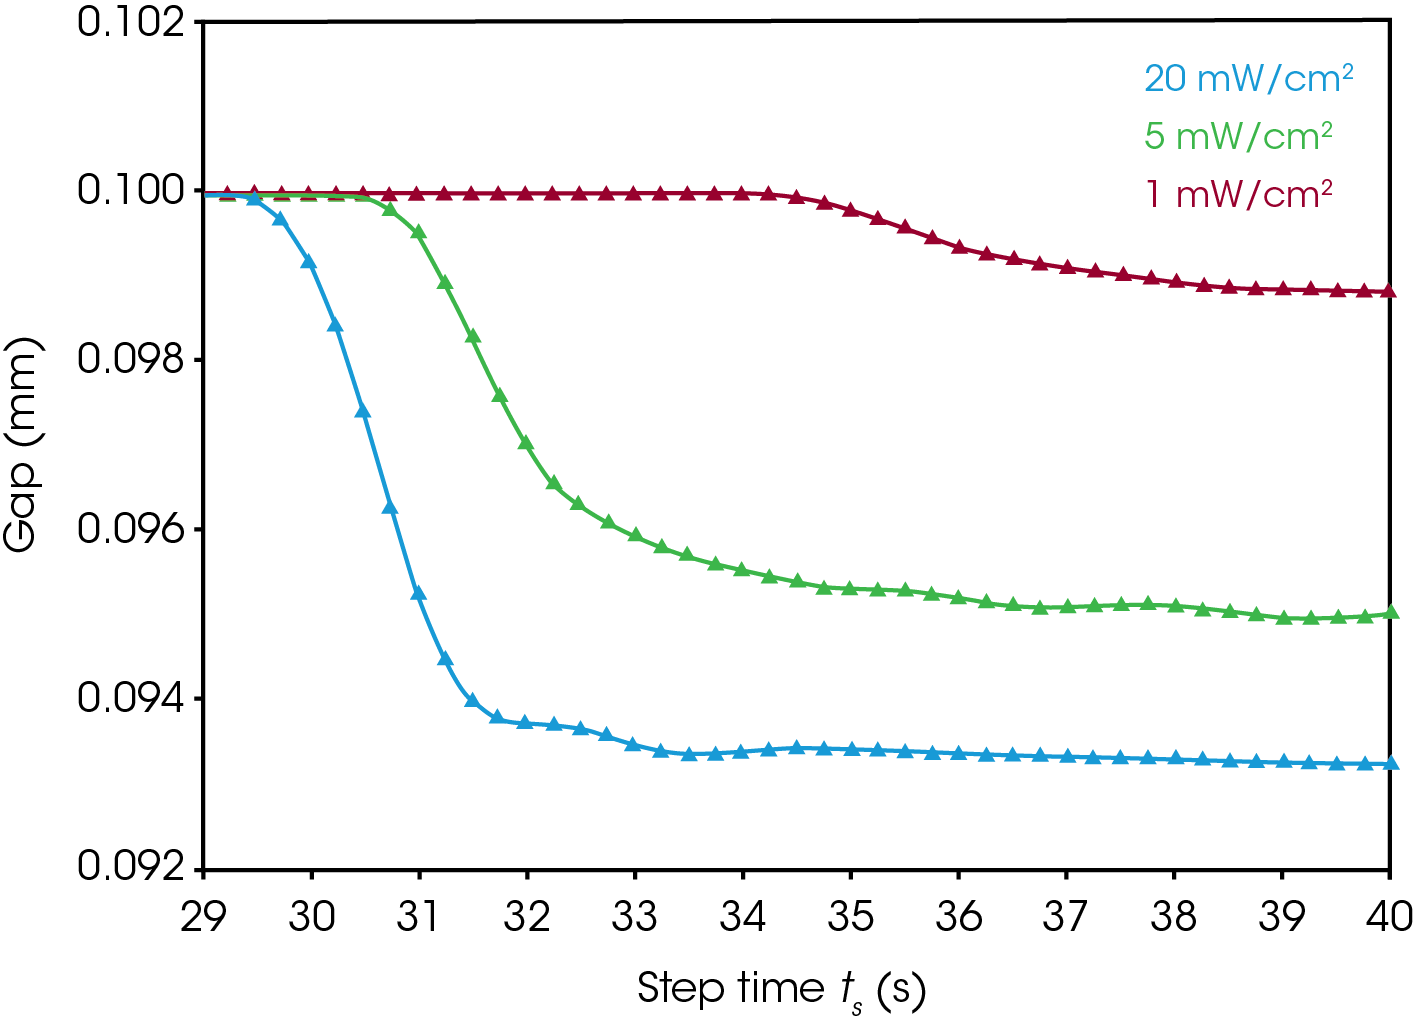
Figure 7 features the same experiments performed as in figure 6, but here gap is plotted as a function of time. What is observed is that the sample subjected to the greatest light intensity, had the largest change in gap size (shrinkage). Likewise, the sample subjected to the lowest light intensity featured the lowest amount of dimensional change. This illustrates a method of optimizing between the extent of cure, and the desired dimensional tolerances of a cured resin.
Conclusions
Various photo-curing UV resins were prepared and loaded into a TA Instruments Dynamic HR rheometer equipped with the UV light guide accessory and OmniCure 2000 unit. First, the viscosity as a function of shear rate of the resins was determined for the various resins. Next, resins were characterized throughout a curing cycle, mimicking the conditions typically experienced in a photo-curing printer. The viscoelastic properties, and gap were measured as a function of time, before, during, and after UV light exposure. This allows for a general comparison of processing conditions experienced and the end properties that may manifest in an actual photo-curing printer. Therefore, optimizing both the development and processing of UV resins, leading to reductions in time, and enhanced processing and performance.
References
- Quan, Haoyuan, et al. “Photo-curing 3D printing technique and its challenges.” Bioactive Materials 5.1 (2020): 110-115
- Redwood, Ben, Filemon Schöffer, and Brian Garret. The 3D printing handbook: technologies, design and applications. 3D Hubs, 2017.
- Xu, F., et al. “Optimal orientation with variable slicing in stereolithography.” Rapid Prototyping Journal (1997).
- Maines, Erin M., et al. “Sustainable advances in SLA/DLP 3D printing materials and processes.” Green Chemistry (2021).
- Voet, Vincent SD, et al. “Biobased acrylate photocurable resin formulation for stereolithography 3D printing.” ACS omega 3.2 (2018): 1403-1408.
- Rivera-Armenta, José Luis. “[Chapter 3] Polymeric Additive Manufacturing: The Necessity and Utility of Rheology.” Polymer Rheology, IntechOpen, London, 2018, pp. 43–58.
- Chen, Tianhong, “UV Curing Analysis Using A Rheometer”, TA applications note. https://www.tainstruments.com/pdf/literature/RH032.pdf
- Karalekas, Dimitris, and A. Aggelopoulos. “Study of shrinkage strains in a stereolithography cured acrylic photopolymer resin.” Journal of materials processing technology 136.1-3 (2003): 146-150.
- Chen, Tianhong, “Rheological Studies of UV – curable Materials”, TA applications note. https://www.tainstruments. com/pdf/literature/AAN021_V1b_Rheological_Studies_UV_ Curable_Materials.pdf
- Zguris, Zachary. “How mechanical properties of stereolithography 3D prints are affected by UV curing.” Formlabs White Paper (2016): 1-11.
Acknowledgement
This paper was written by Keith Coasey, Ph.D., Rheology Applications Engineer at TA Instruments.
Click here to download the printable version of this application note.

