Keywords: Battery, Electrode slurry, Rheo-Impedance, Conductive network
RH137
Introduction
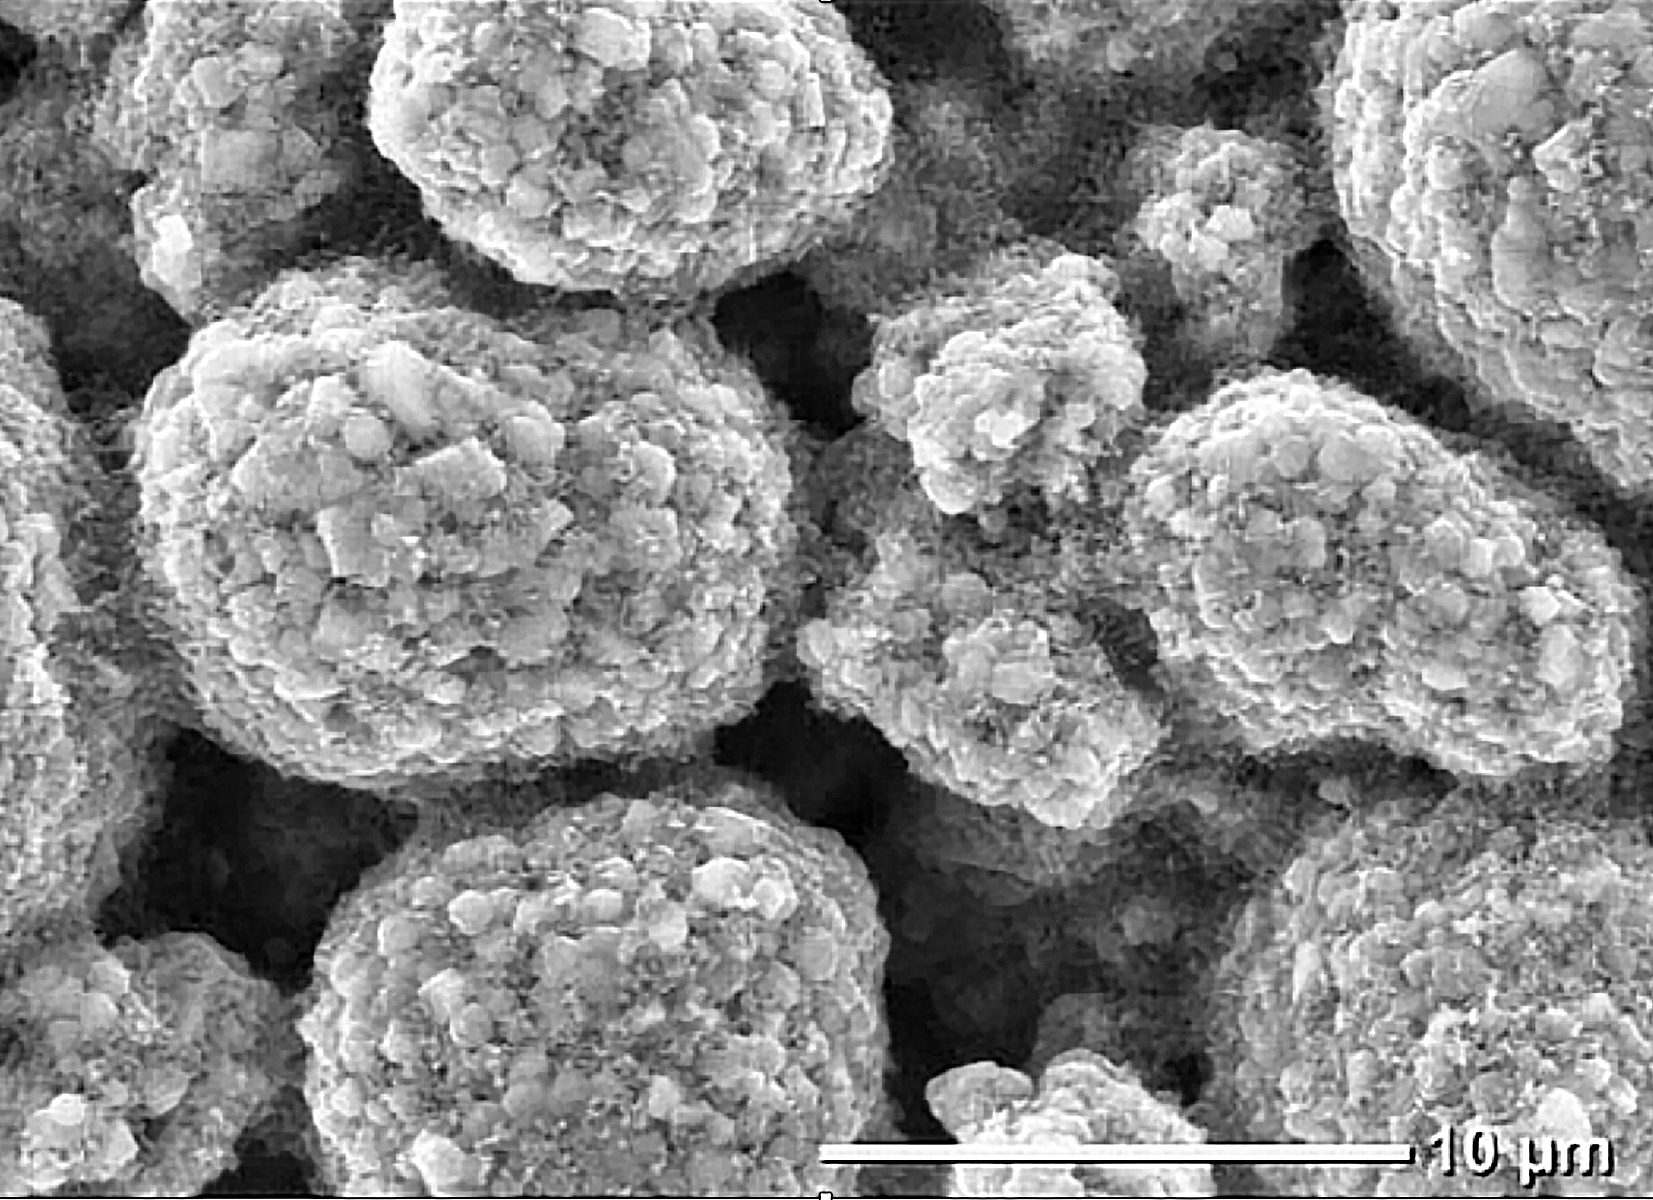
Lithium-ion battery (LIB) performance is highly dependent on the composition of the anode and cathode, yet these components present challenges in manufacturing. Successful electrodes consist of active material particles surrounded by conductive material to facilitate flow of electricity and binder to adhere to the current collector (Fig. 1). Electrode production requires dispersing solid components in solvent to create a slurry, which must exhibit appropriate flow behavior to enable uniform coating, while also delivering an optimal distribution of conductive material needed for a successful electrode.
Impedance Spectroscopy of battery slurries has been actively studied in recent years as a means to characterize the conductive network within the slurry [1-5], highlighting the need to perform these measurements under process-relevant shear deformations. In this article, we introduce Rheology-Impedance Spectroscopy for the Discovery™ Hybrid Rheometers. This new capability enables precise rheological measurements, coupled with insights into shear-induced changes in conductive material distribution.
Experimental
Samples
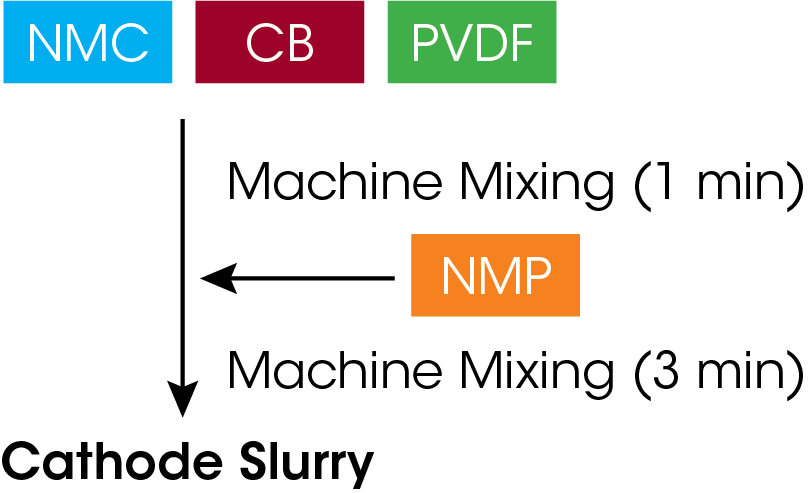
All materials were provided by DAINEN MATERIAL CO and prepared in formulations described in Table 1 using a planetary centrifugal mixer. Cathode slurries were prepared by powder mixing NMC, CB, and PVDF, followed by the addition of NMP (Figure 2), varying the CB levels.
Table 1. Composition of samples
| NMC | CB | PVDF | NMP | |
|---|---|---|---|---|
| PVDF/NMP solution | 0 g | 0.0 g | 0.15 g | 4 g |
| Carbon paste | 0 g | 0.2 g | 0.15 g | 4 g |
| Cathode slurry-0 | 10 g | 0.0 g | 0.15 g | 4 g |
| Cathode slurry-1 | 10 g | 0.1 g | 0.15 g | 4 g |
| Cathode slurry-2 | 10 g | 0.2 g | 0.15 g | 4 g |
NMC: Lithium nickel manganese cobalt oxides, active material
CB: Carbon black, conductive material
PVDF: polyvinylidene fluoride, binder
NMP: N-methyl pyrrolidone, solvent
Measurements
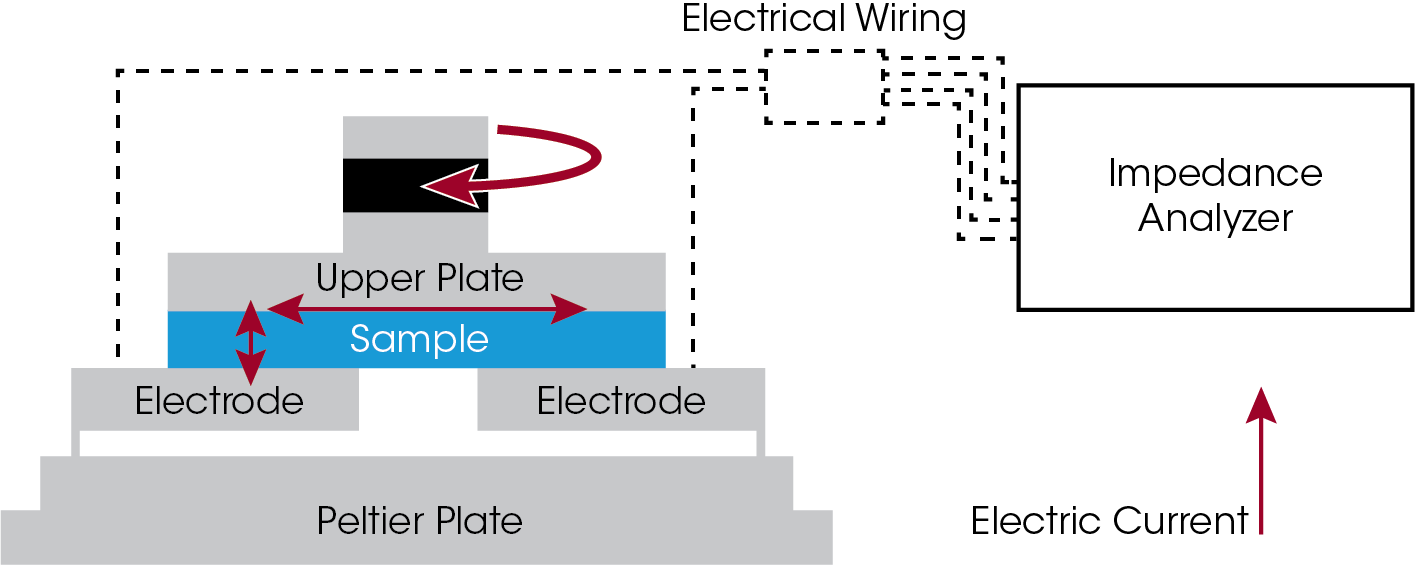
Rheo-Impedance measurements were performed using a TA Instruments Discovery HR-20 rheometer with the Rheo-Impedance accessory and HIOKI™ LCR meter (model IM3536). The Rheo-Impedance accessory (Figure 3) consists of a lower electrode plate with two electrically insulated half-moon shaped electrodes, mounted to the Peltier temperature control stage, and an electrically insulated upper 40 mm parallel plate. The impedance is measured by a current path from one lower electrode through the sample, across the upper plate and back through the sample to the other lower electrode. This design requires no electrical contact with the upper plate, enabling the full rheological measurement range. Nor does it require liquid electrolyte, enabling the full frequency range of the LCR meter, and eliminating experimental challenges with liquid electrolyte contacts.
Measurements were made using a gap of 500 μm, controlling temperature at 25 °C, and applying an AC voltage of 0.1 V over a frequency range of 4 Hz to 8 MHz. Impedance data was initially collected with the plate stationary, then under shear while measuring steady-state flow viscosity in the shear rate range of 0.01 – 1000 s-1.
Results and Discussion
Viscosity of the electrode slurries and insight to structure
Rheological measurements are key to understanding the flow behavior of battery slurries. Rheometers such as the Discovery HR provide measurements of viscosity under process-relevant conditions such as coating (high shear) and at rest (low shear), both of which are critical for slurry performance. Viscosity profiles are also indicative of the microstructure within the slurry and are often used to ensure optimal mixing.
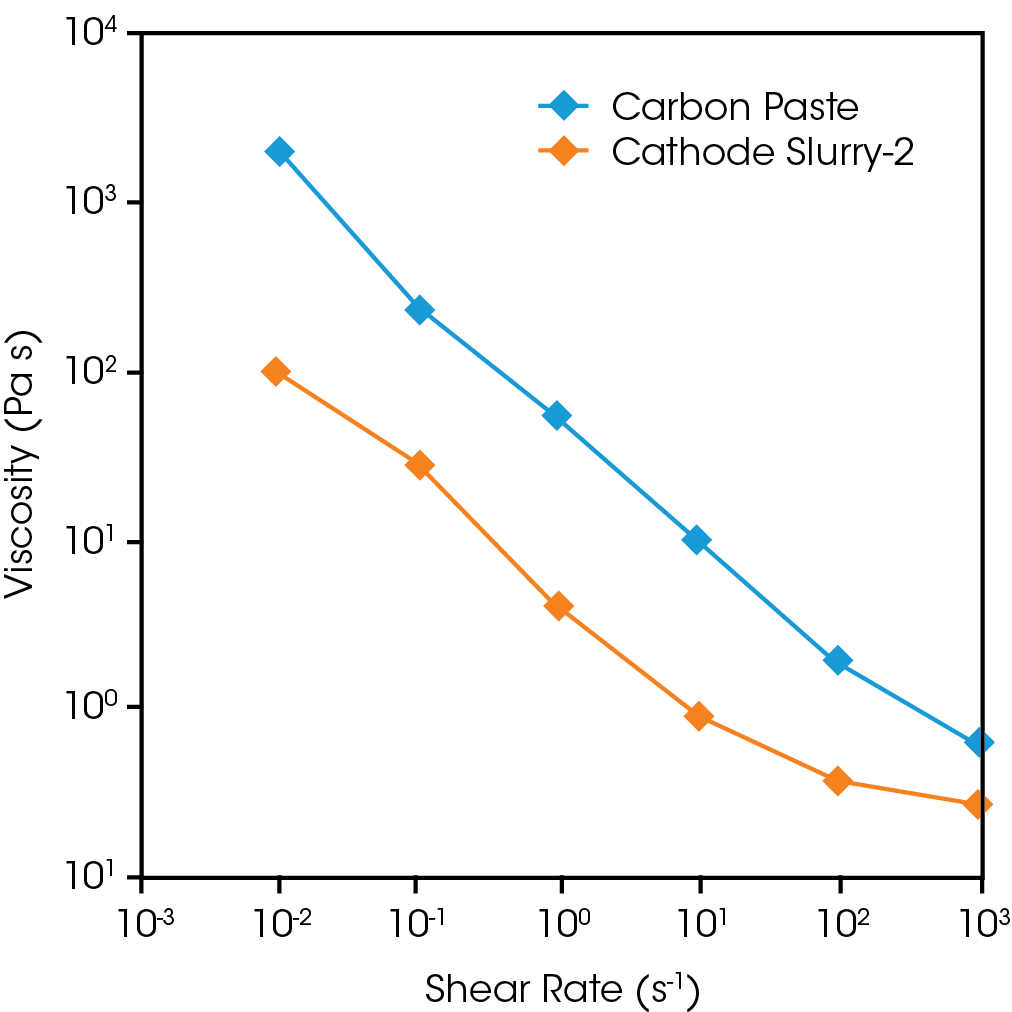
Figure 4 shows the shear rate dependence of the steady-state viscosity of the carbon paste, and cathode slurry. The carbon paste has the highest viscosity, although its solid content is low at 8%. This carbon paste is considered to be a network-like structure similar to a percolation of fine particles. In contrast, the cathode slurry has a significantly higher solid content (72%), but its viscosity is lower than that of carbon paste. Active material particles are much larger than nanometer-scale carbon black particles and are mixed in large quantities. It is assumed that mixing a large amount of active material particles cuts the carbon network into small pieces, and the dispersion of active material particles and small networks results in a relatively low viscosity of the cathode slurry. Each of the components in the slurry all contribute to the slurry networks and viscosity differently. Evaluating the shear dependent viscosity is essential to slurry formulation.
Impedance data of the electrode slurries
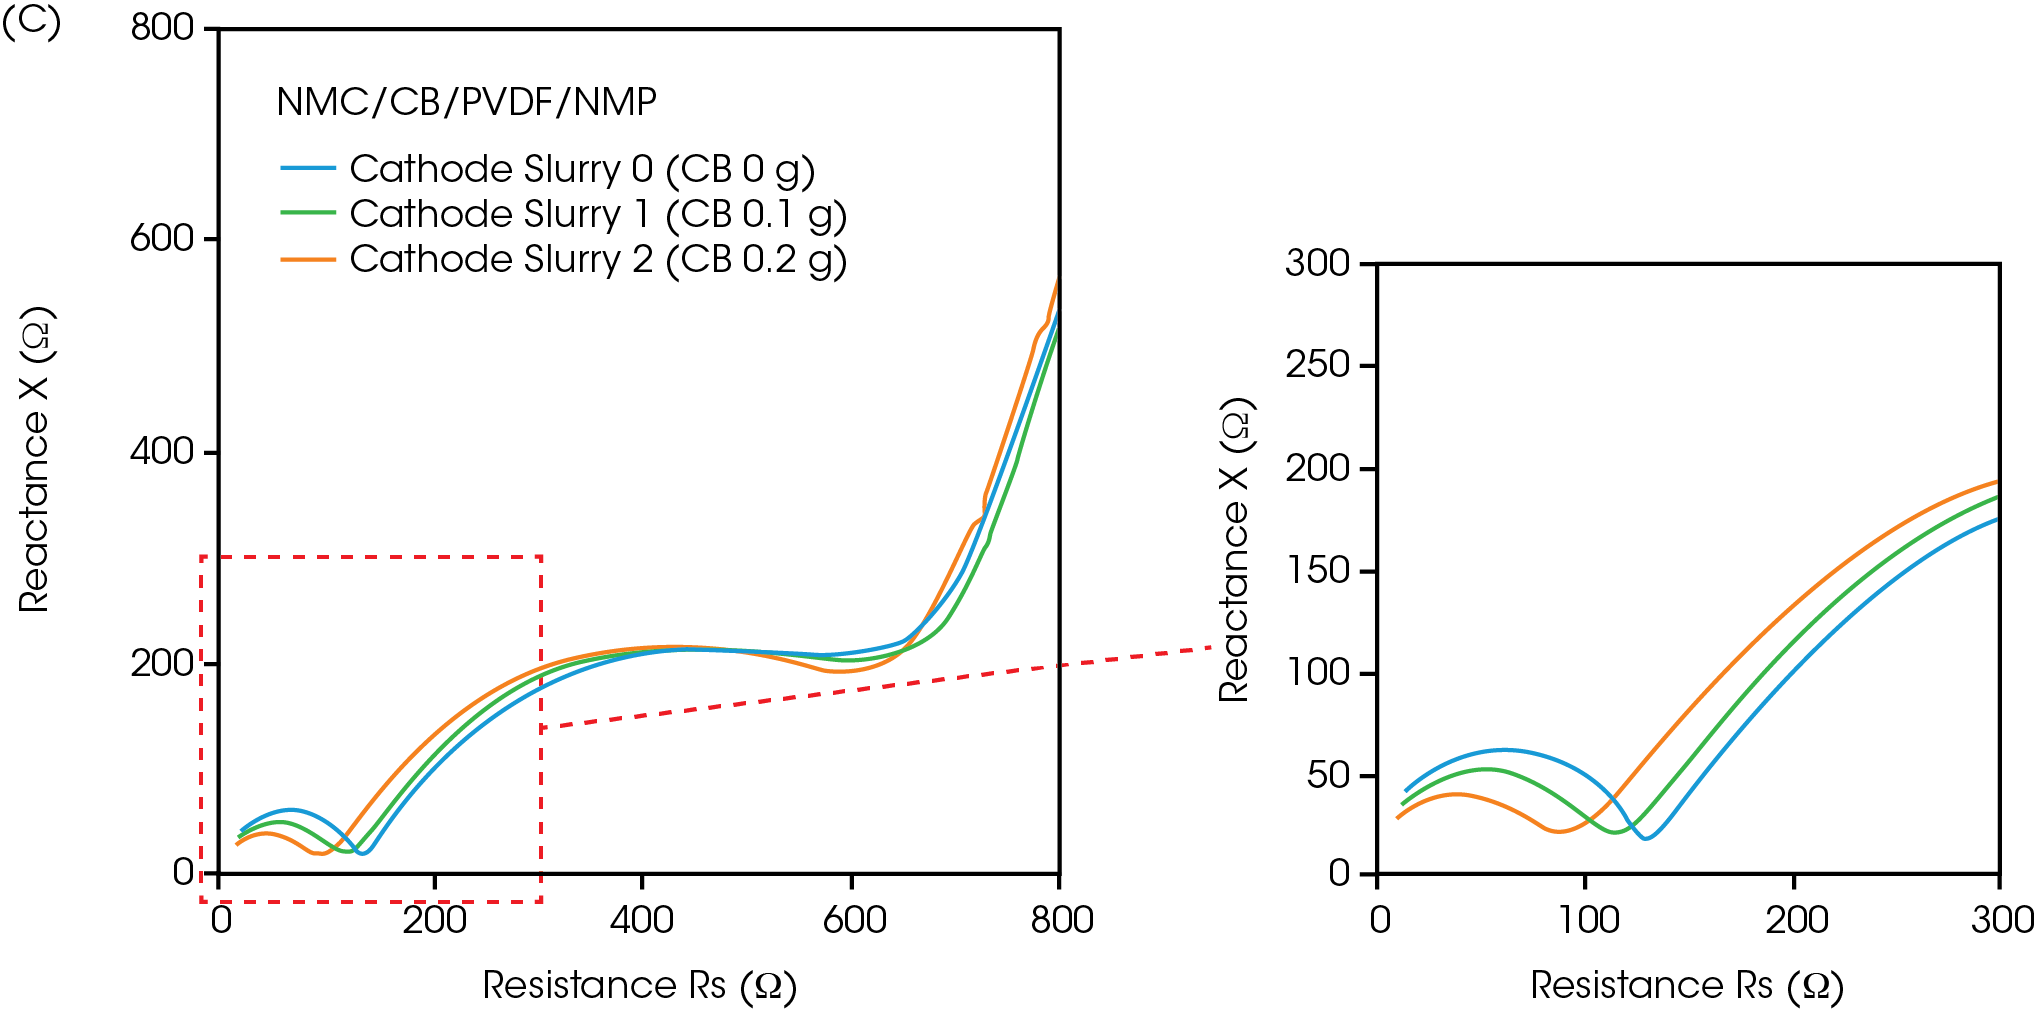
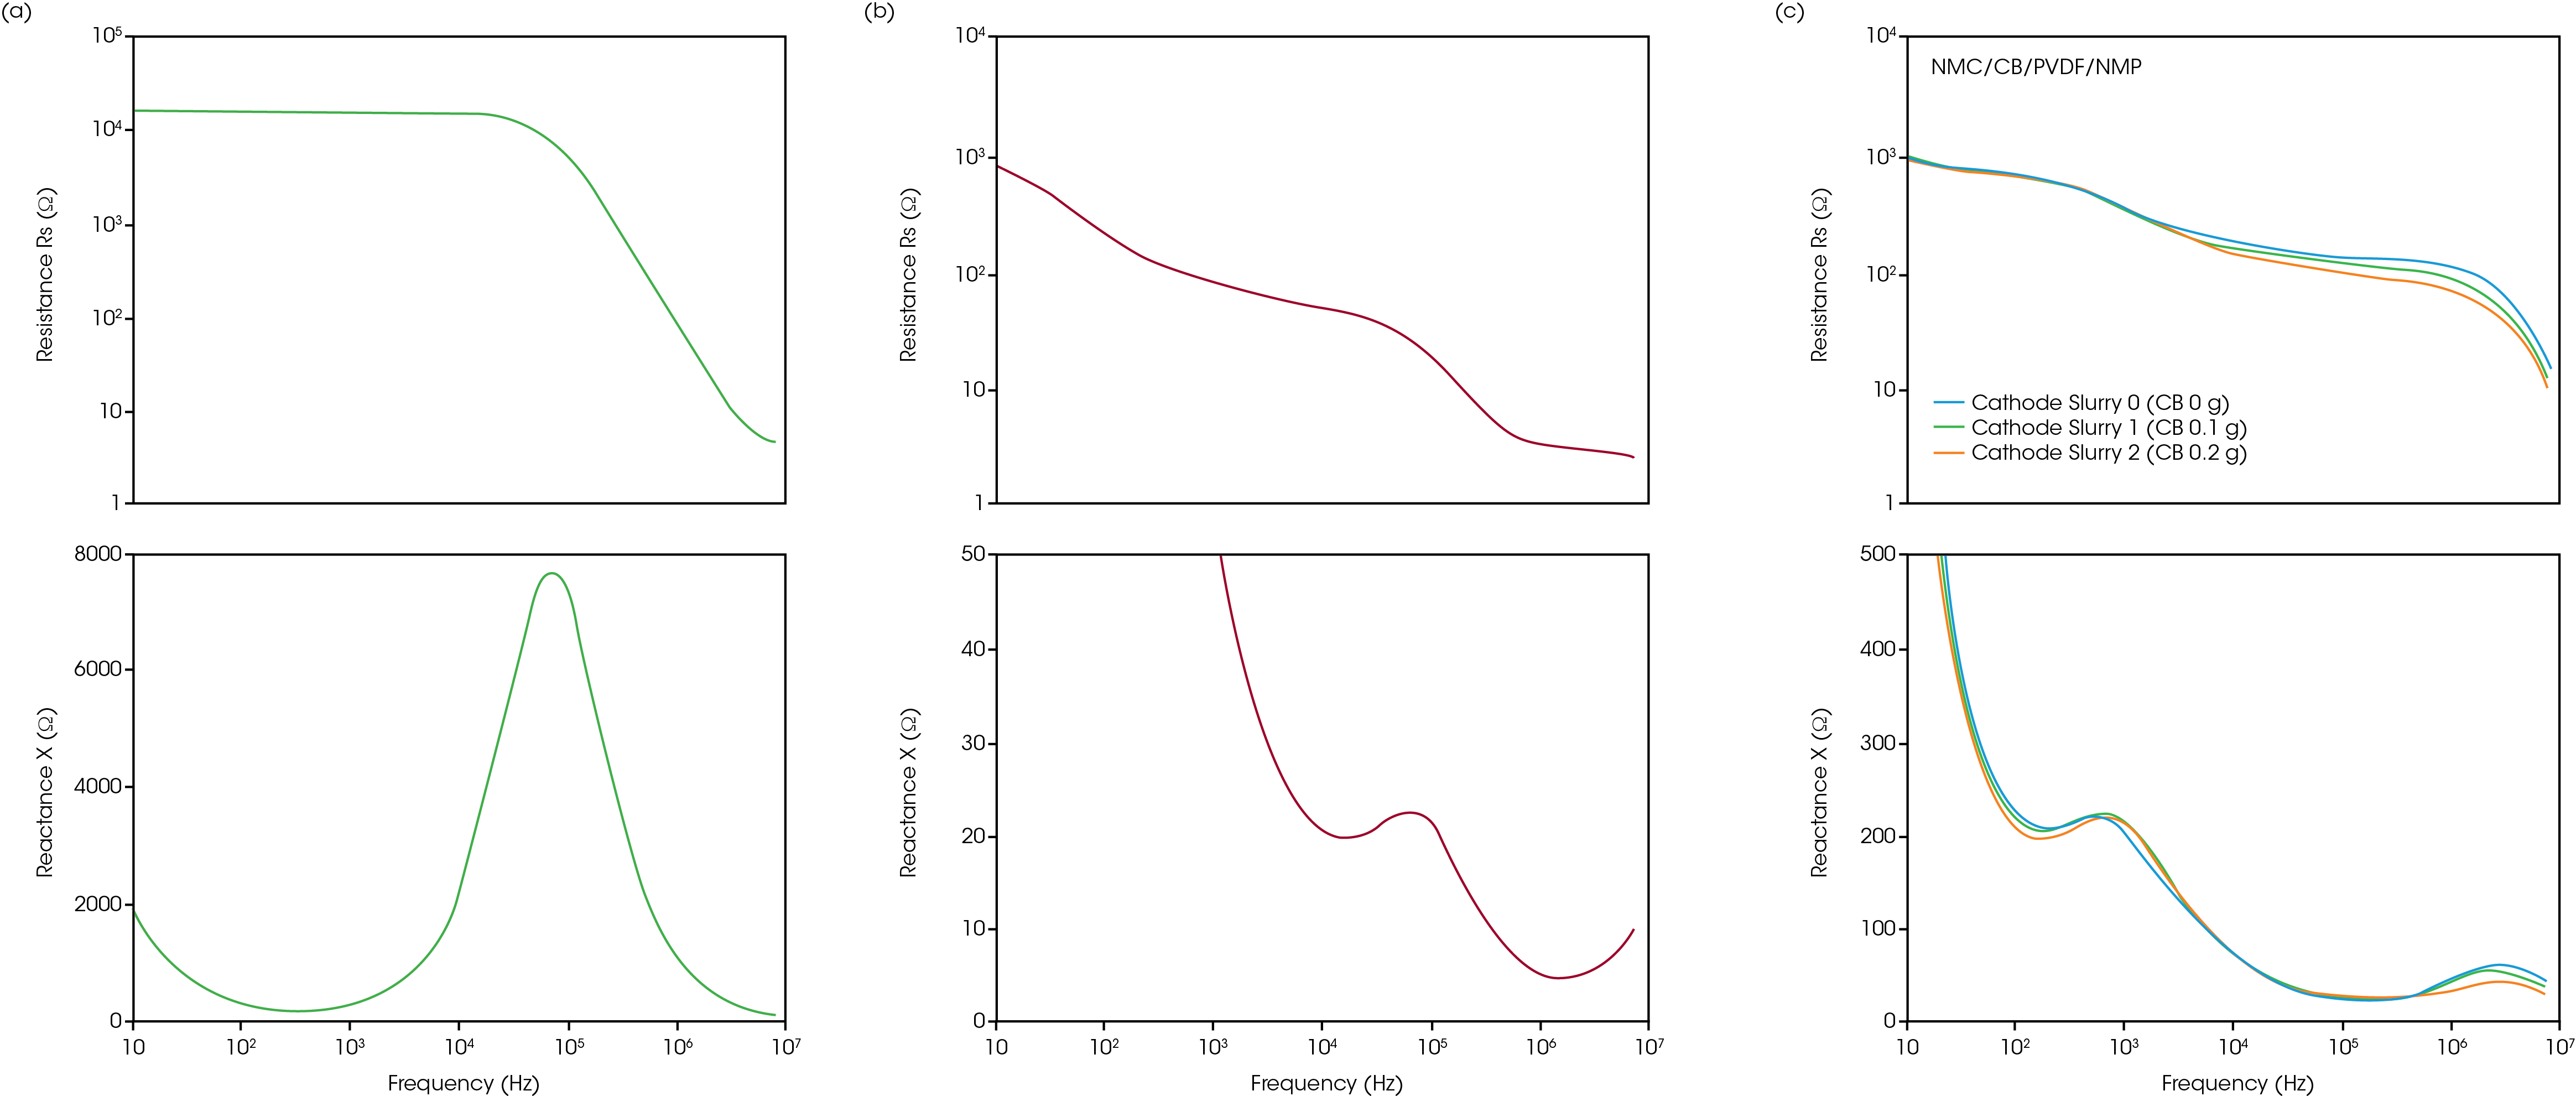
While rheological measurements reflect the physical network within the slurry, impedance spectroscopy characterizes the conductive network, critical for electrode performance. The Nyquist and Bode plots of the Rheo-Impedance results under static conditions are shown in Figures 5 and 6. The semicircles in the Nyquist plot suggest the presence of both capacitance and ohmic resistance components. but their interpretation has not yet been standardized for electrode slurries [2]. In the carbon paste, adding carbon black to the binder solution (Figures 5a and 6a), the edge of the semicircle appears near the origin of the Nyquist plot (high frequency side) (Figure 6b) [6], and an upward trend in reactance appears in the high frequency band above 1 MHz. This indicates that the influence of the more conductive CB appears at higher frequencies. The frequency at the maximum of reactance (-X) in the main semicircle in Figure 6b is 100 kHz, which agrees with the frequency of -X maximum in the semicircle of the binder solution. In the Nyquist plot of cathode slurries (Figure 6c), two semicircles appear. Although the attribution of each semicircle is a subject for future study, the effect of carbon black would be included in the semicircle on the left side at high frequency because the small semicircle close to the origin changes more significantly when the carbon black concentration is changed (Figure 5c). Next, impedance is measured under applied shear, expanding beyond the static slurry to characterize shear-induced changes in conductive structure.

Changes in impedance under flow
The conductive network is subject to restructuring under deformation, which can be studied using simultaneous measurements of impedance and viscosity. Figure 7 shows the Nyquist plot of the carbon paste and cathode slurry 2 under shear flow at shear rates of 0, 0.01, 1.0, 100 s-1. The friction-free design enables low shear stress simultaneous Rheo-Impedance measurement that occur at low shear rate. The Nyquist plots of the carbon paste change with shear flow, while the Nyquist plots of the cathode slurry hardly change with shear flow. In the case of carbon paste, the network-like aggregation structure formed between carbon black particles collapses under shear flow, resulting in a change in the electric conductive path and the Nyquist plot. The change is prominent in the high frequency region. As suggested by the viscosity behavior, the carbon black network is broken up by the active material particles during mixing. The small carbon black particles are well dispersed, and the shear flow in the Rheo-Impedance measurement does not collapse the structure further. Rheo-Impedance results would describe well the dispersity of conductive structures in battery electrode slurries.

Conclusions
The Rheo-Impedance measurement allows scientists to evaluate the carbon black network structure for slurry formulation development. As seen in these materials, microstructure changes significantly with the addition of NMC and under shear. Viscosity at process-relevant shear rates is essential for coating, reflecting the physical network. Adding simultaneous impedance measurements provides greater insights by directly measuring the conductive network which is critical to electrode performance in the battery cell. Performing impedance spectroscopy before, during and after shear replicates the coating process, characterizing any changes in the network impacting the finished electrode.
The Discovery Hybrid Rheometer Rheo-Impedance system expands insights into electrode slurry composition by enabling simultaneous impedance spectroscopy and rheological measurements. Its unique design offers key advantages impacting the measurement range and sensitivity:
- Friction-free rheological measurements in the full shear range, essential for low shear region
- Stable impedance measurements without the challenges or limitations of using liquid electrolyte contacts
- High frequency impedance measurements enable access to the carbon black conductive networks
References
- A. Helal, T. Divoux, and G. H. McKinley, “Simultaneous Rheoelectric Measurements of Strongly Conductive Complex Fluids” Phys. Rev. Applied, 6, 064004, 2016.
- Z. Wang, T. Zhao, J. Yao, Y. Kishikawa, and M. Takei, “Evaluation of the Electrochemical Characterizations of Lithium-Ion Battery (LIB) Slurry with 10-Parameter Electrical Equivalent Circuit (EEC),” J. Electrochem., 164 (2), A8-A17, 2017.
- M. Takeno, S. Katakura, K. Miyazakia, T. Abe and T. Fukutsuka, “Analysis of the intermediate states of an electrode slurry by electronic conductivity measurements”, Carbon Reports, Vol. 2, No. 2,91, 2023.
- Z. Wang, Z. Wang, X. Liu, X. Liu, T. Zhao and M. Takei, “Clarification of the dispersion mechanism of three typical chemical dispersants in lithium-ion battery (LIB) slurry”, Particuology, 80, 90, 2023.
- Q. Liu and J. J. Richards, “Rheo-electric measurements of carbon black suspensions containing polyvinylidene difluoride in N-methyl-2-pyrrolidone,” Journal of Rheology, vol. 67, no. 3, pp. 647-659, 2023.
- TA Instruments Application Note RH-132, “Structural Characterization of Carbon Black Paste for Li-ion Battery Electrodes Using Simultaneous Rheology and Electrochemical Impedance Spectroscopy”.
Acknowledgement
This note was written by Yuki Kawata, Ph.D., Hang Lau, Ph.D., Sarah Cotts, and Kevin Whitcomb, Ph.D.
For more information or to request a product quote, please visit www.tainstruments.com to locate your local sales office information.
Discovery is a trademark of Waters Technologies Corporation. HIOKI is a trademark of Hioki E.E. Corporation.
Click here to download the printable version of this application note.

