Keywords: thermal degradation, nylon 66, TGA, TGA-MS, TGA-FTIR, FTIR, GC/MS, TGA-GC/MS, mass spectrometry, evolved gas analysis, hyphenation.
TA434
Introduction
Nylon 66 is synthesized by polycondensation of two monomers hexamethylenediamine and adipic acid. It is a polymer that has high mechanical strength, good rigidity, and great chemical and abrasion resistance but tends to absorb moisture easily [1]. It is widely used in film and fiber applications [2]. Researchers have been studying the thermal degradation of nylon 66 for decades in different gas environments. It has been reported that cyclopentanone is the major decomposition product of nylon 66 but H2O, CO2, NH3, hydrocarbons, cyclic monomer, and products with nitrile and isocyanate end-groups were also observed [3-4].
Hyphenated techniques such as thermogravimetric analysis with mass spectrometry (TGA-MS), Fourier transform infrared spectrometry (TGA-FTIR), and gas chromatography-mass spectrometry (TGA-GC/MS) can be very useful to help understand the thermal degradation of nylon 66 because it allows a simultaneous study of the thermal decomposition process and the chemistry of the evolved gases. In this work, the thermal degradation process of nylon 66 was studied using TGA-MS, TGA-FTIR and TGA-GC/MS in inert gas environments. These techniques together can provide a lot of insights of the thermal degradation process and its off-gas products.
Experimental
Nylon 66 was purchased from Aldrich. The thermogravimetric (TGA) tests were carried out on a TA Instruments Discovery 5500 TGA. The TGA-MS studies were performed by connecting the TGA 5500 to a TA Instruments Discovery Mass Spectrometer (DMS). The TGA-FTIR-GC/MS studies were performed by connecting the TGA 5500 to a Thermo Scientific™ Nicolet™ iS50 FTIR Spectrometer and an Agilent 5977B GC/MSD. The instruments were connected to the respective spectrometers using a heated transfer line to prevent condensation of the off gases during the transfer. One test was performed on the FTIR at ambient environment to collect the ATR-FTIR spectrum of the sample. TGA tests were performed by heating the samples from ambient temperature to 1000 ˚C at 10 ˚C/min on these two systems. Approximately 2-3 mg of nylon 66 was used in each test.
- TGA-MS System
- Purge gas: helium
- Crucible: 100 µL platinum pan
- Experiments: a barchart scan from 1 to 300 m/z
- Electron Voltage: 70 eV
- TGA-FTIR-GC/MS System
- Purge gas: nitrogen
- Crucible: 100 µL platinum pan
- TGA-FTIR spectra were recorded during the TGA test as a function of time and stored in an array as the Gram Schmidt file at each data point
- TGA-FTIR series data collection: 16 scans with resolution 4 cm-1 ranging from 400-4000 cm-1
- GC-MS column: HP-5MS 5% phenyl methyl siloxane 30 m x 250 μm x 0.25 μm
- GC-MS method: the GC column oven temperature was ramped from 50 °C to 200 °C at 10 °C/min followed by an isothermal for 10 min. MS Scan was recorded from 50- 1000 m/z with an injection at 437 °C during a TGA temperature ramp.
Results & Discussion
TGA-MS
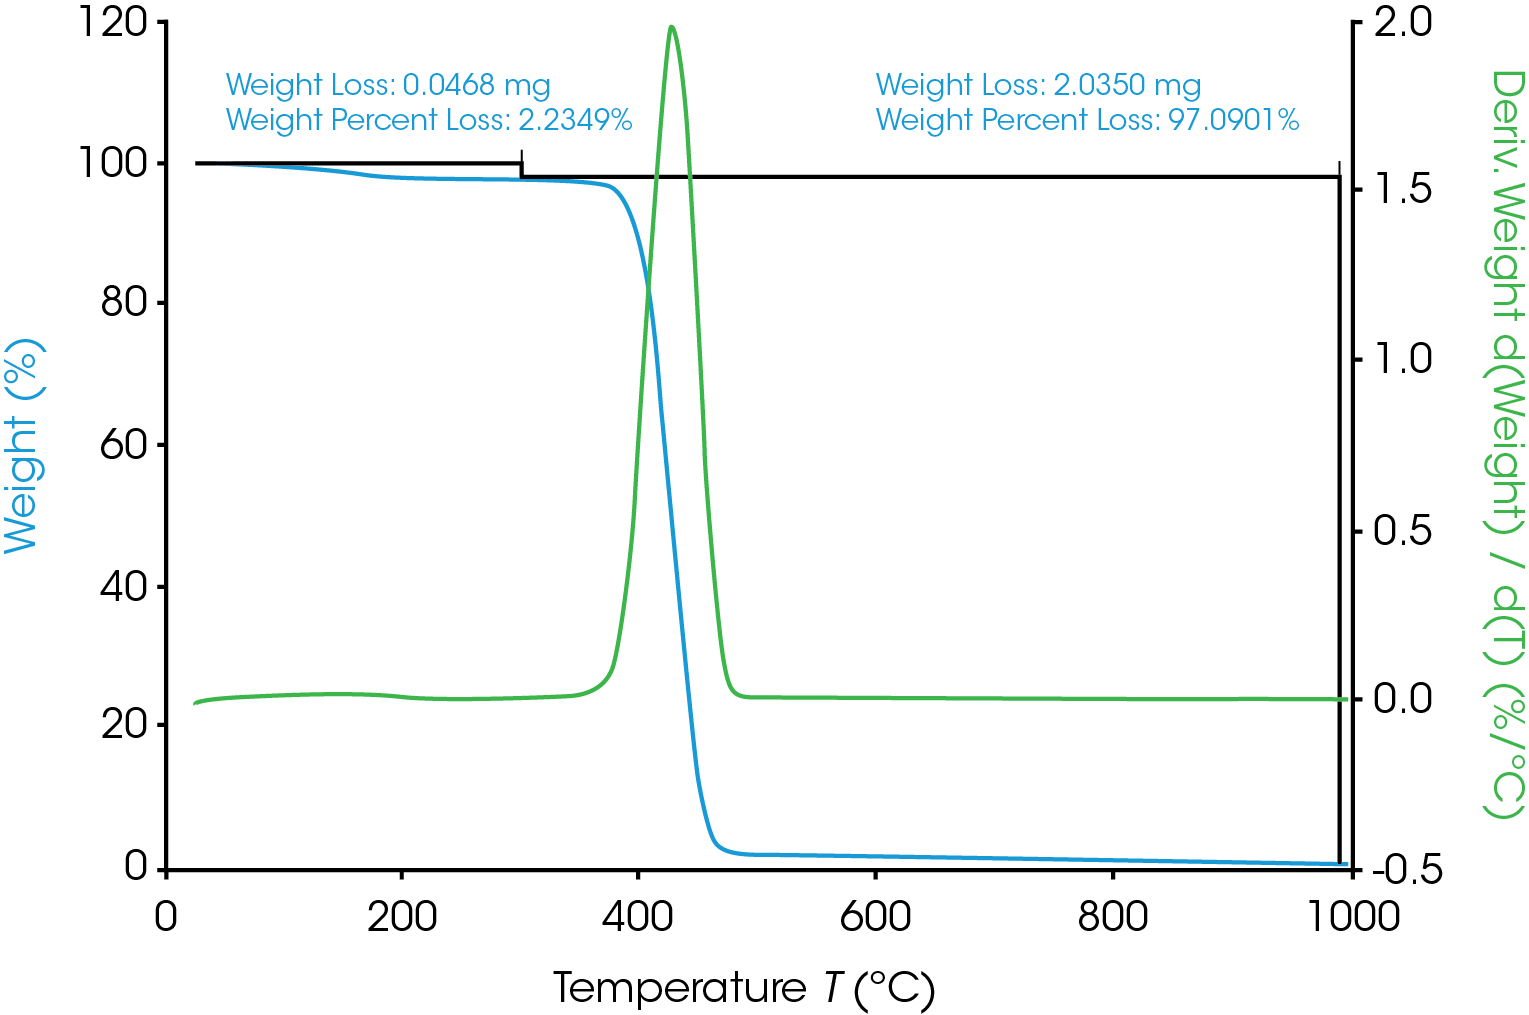
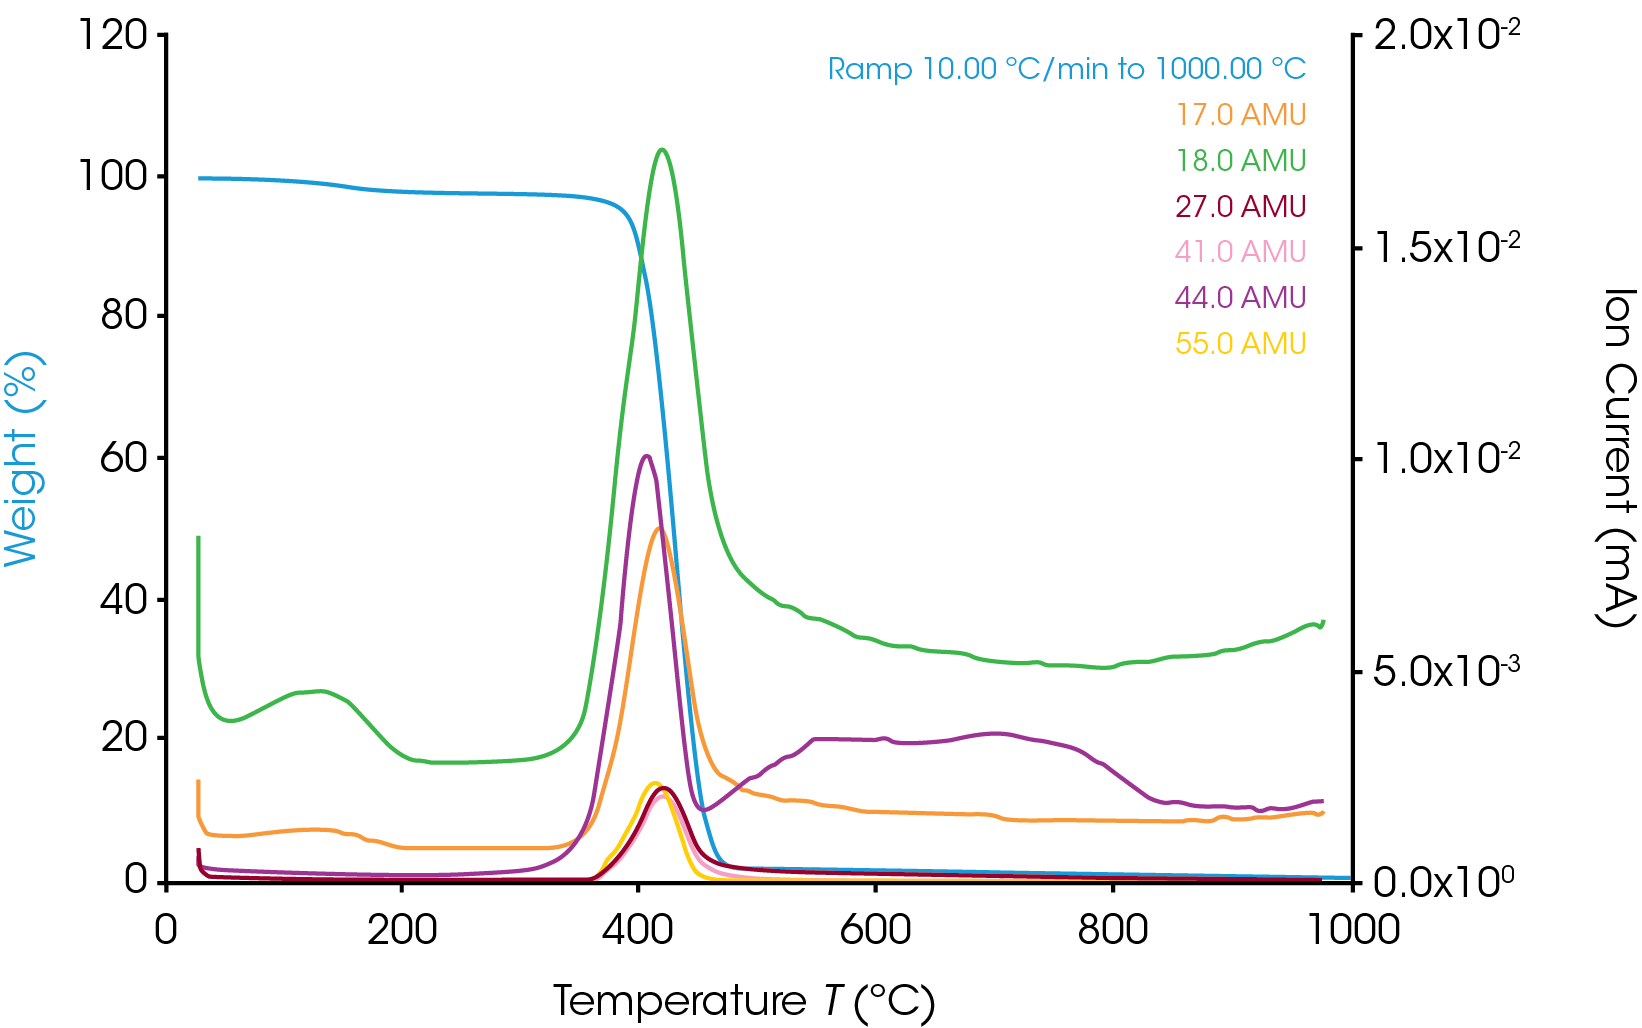
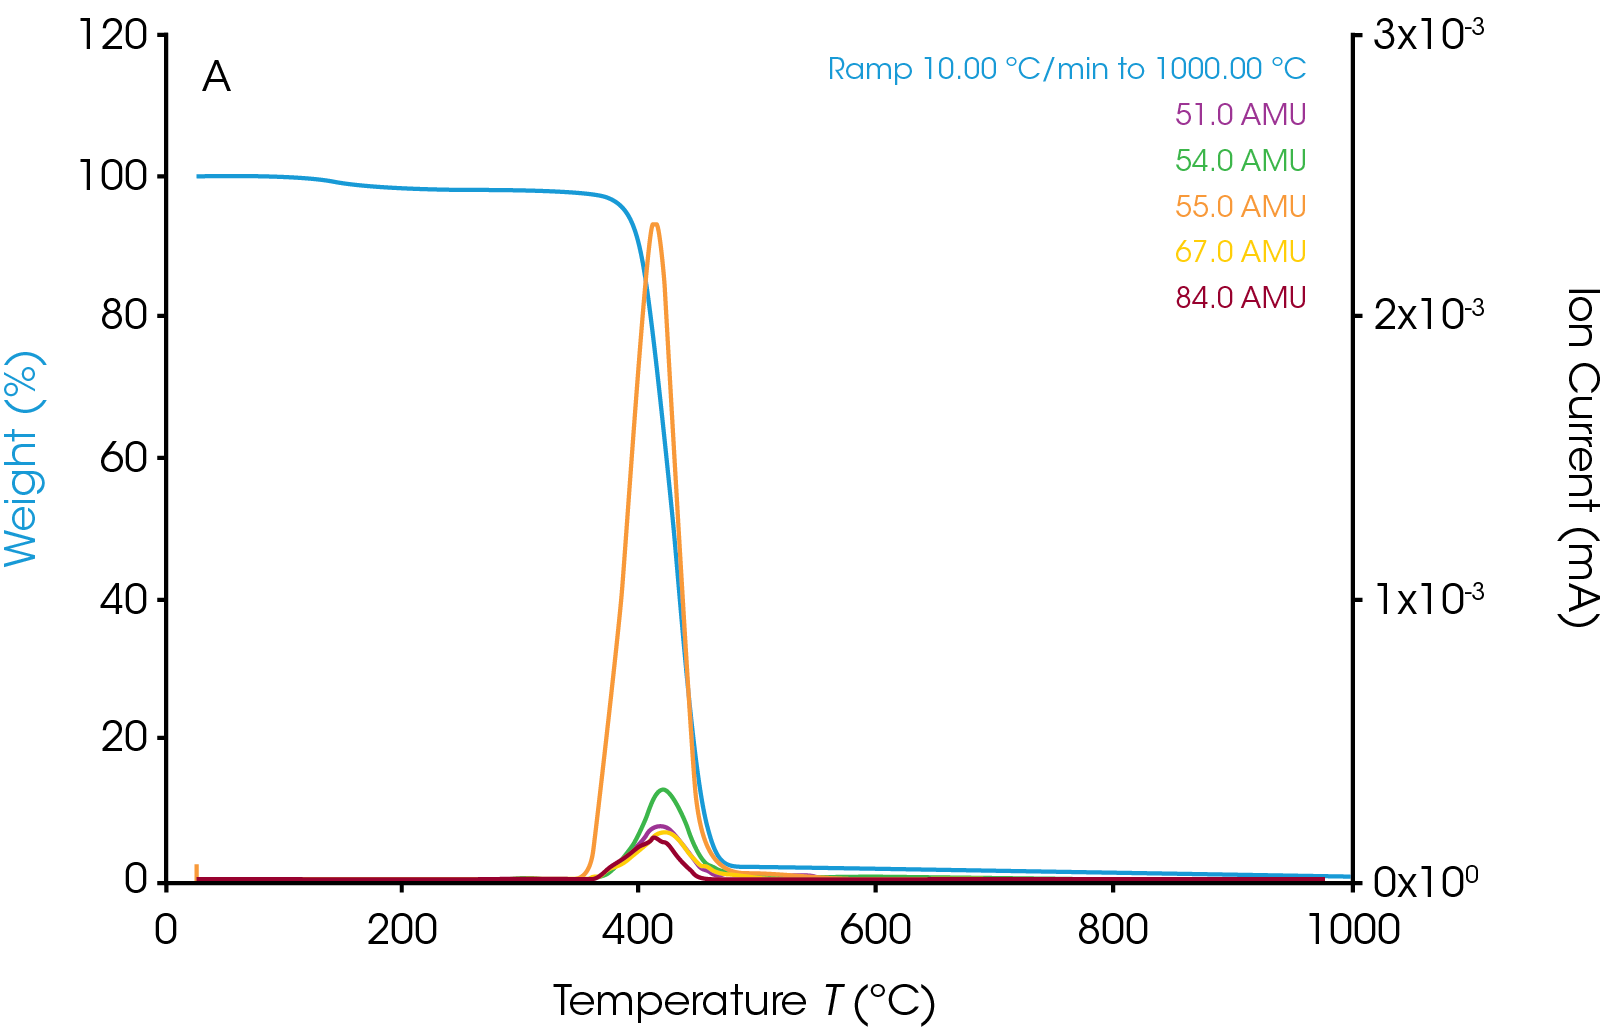
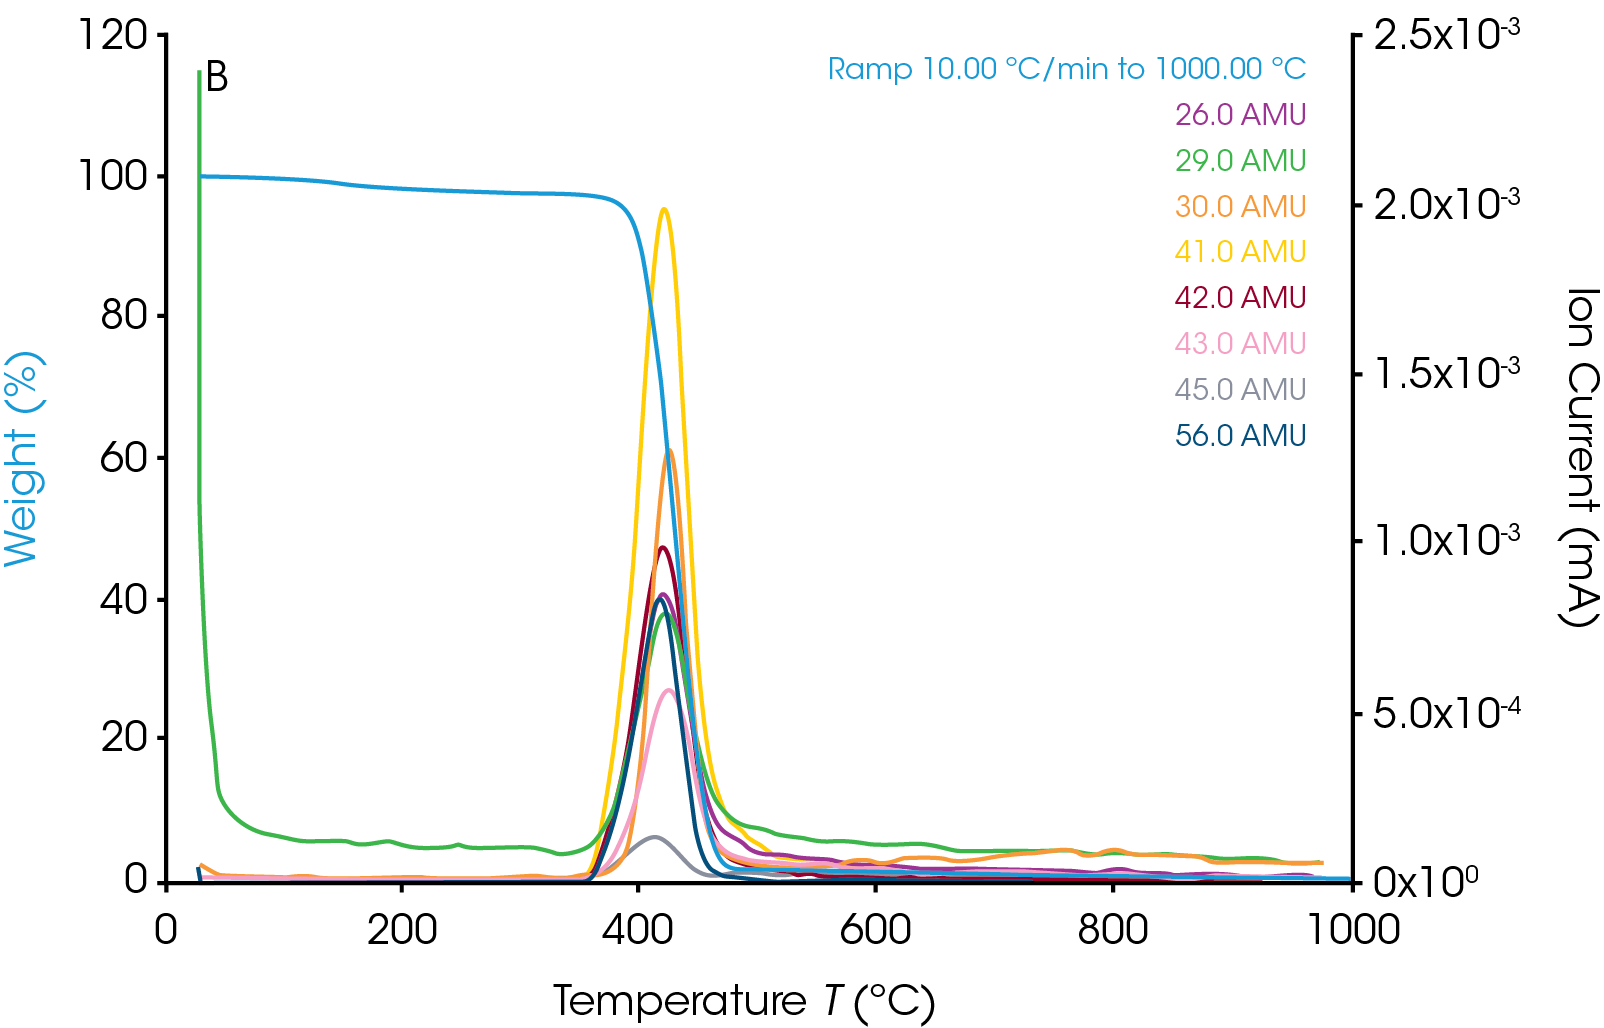
The TGA weight change curve is shown in Figure 1. The first weight loss step is the volatilization followed by a major decomposition step. The derivative of weight change curve in green shows a peak where the peak max is at 427.71 ˚C. The MS data is collected throughout the entire TGA experiment. Ion currents and TGA mass loss are plotted as a function of temperature (see Figure 2). It is important to remember that the products of a TGA test are normally decomposition products, and that is true in these experiments as well. Therefore, the aim is to understand the thermal degradation products of nylon 66. TGA-MS continuously monitors the decomposition off gases as a function of time and temperature. The degradation mechanism of the polymer molecules breaking at the C-N bond creates smaller polymer molecules with the same unit of bicarbonyl polymethylene fragments and the fragments will break down into carbon dioxide, carbon monoxide, water, and hydrocarbons [5]. The m/z of some of the major degradation products are plotted in Figure 3. In addition to NH3, H2O, and CO2, masses such as 27, 41, and 55 are also present. This implies that polymethylene fragments or 1,5-hexadiene may be one of the thermal decomposition off-gas products of nylon 66. It is important to note that same m/z may relate to different ion fragments or molecules. Some other representative ion fragments such as aliphatic hydrocarbons, amides, and cyclopentanone (m/z 84) are shown in Figure 3. The MS data from this work is in good agreement with the paper published by Herrera, et al [3] and the chemical structure of nylon 66 shown in Figure 4. The ion fragments are plotted across the whole temperature range of the thermal degradation of the sample. Therefore, it is easy to see at what temperature range these off-gas products come off.

TGA-FTIR-GC/MS
The degradation of nylon 66 in this part of the study was also carried out on a TGA5500. The off-gas products were analyzed using a FTIR for the IR spectra and a GC/MS for the MS analysis. TGA-FTIR continuously monitors the decomposition off gases as a function of time and temperature, while GC/MS can separate the multiple off-gas products that come off at a single point in time.
FTIR
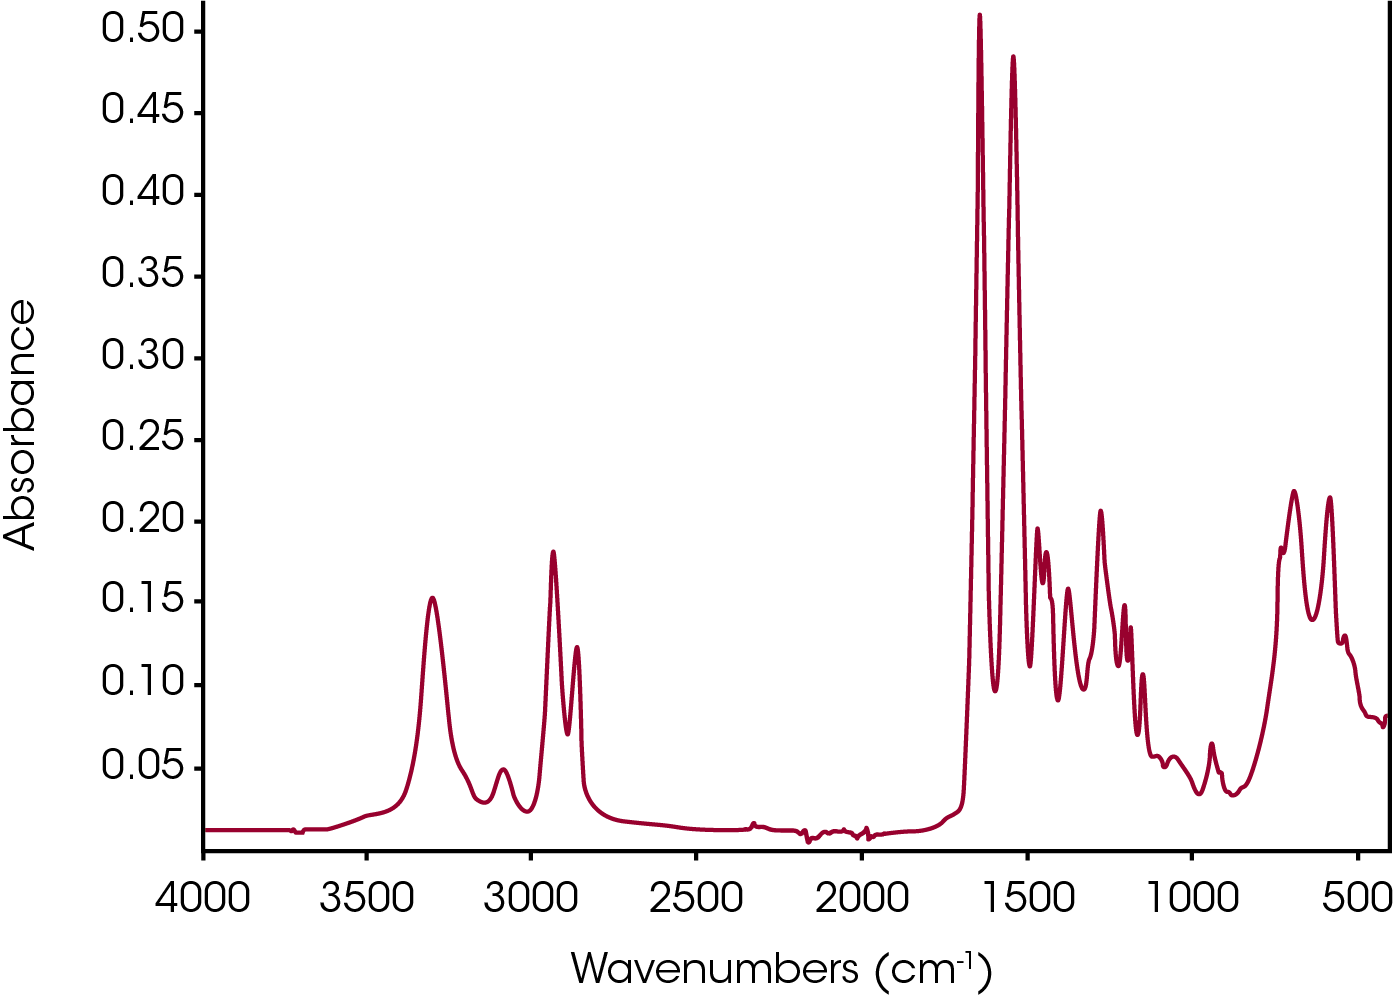
An ATR-FTIR scan of nylon 66 at room temperature was recorded as shown in Figure 5. The band at 3297 cm-1 corresponds to the NH groups which is a lot more pronounced than the same bands appearing in the spectra in Figure 7c from a TGA-FTIR scan. The small band at 3081 cm-1 is attributed to the CH stretching. Similarly, CH2 groups at 2929 and 2859 cm-1, C=O stretching at 1637 cm-1, NH bending at 1534 cm-1, CH bending at 1463, 1436, and 1369 cm-1, CN stretching at 1270 cm-1, CN stretching at 1199 and 1180 cm-1 are observed. The band at 684 cm-1 is assigned to amide IV/V mode and the band at 580 cm-1 is due to the C=O out of plane bending [6].
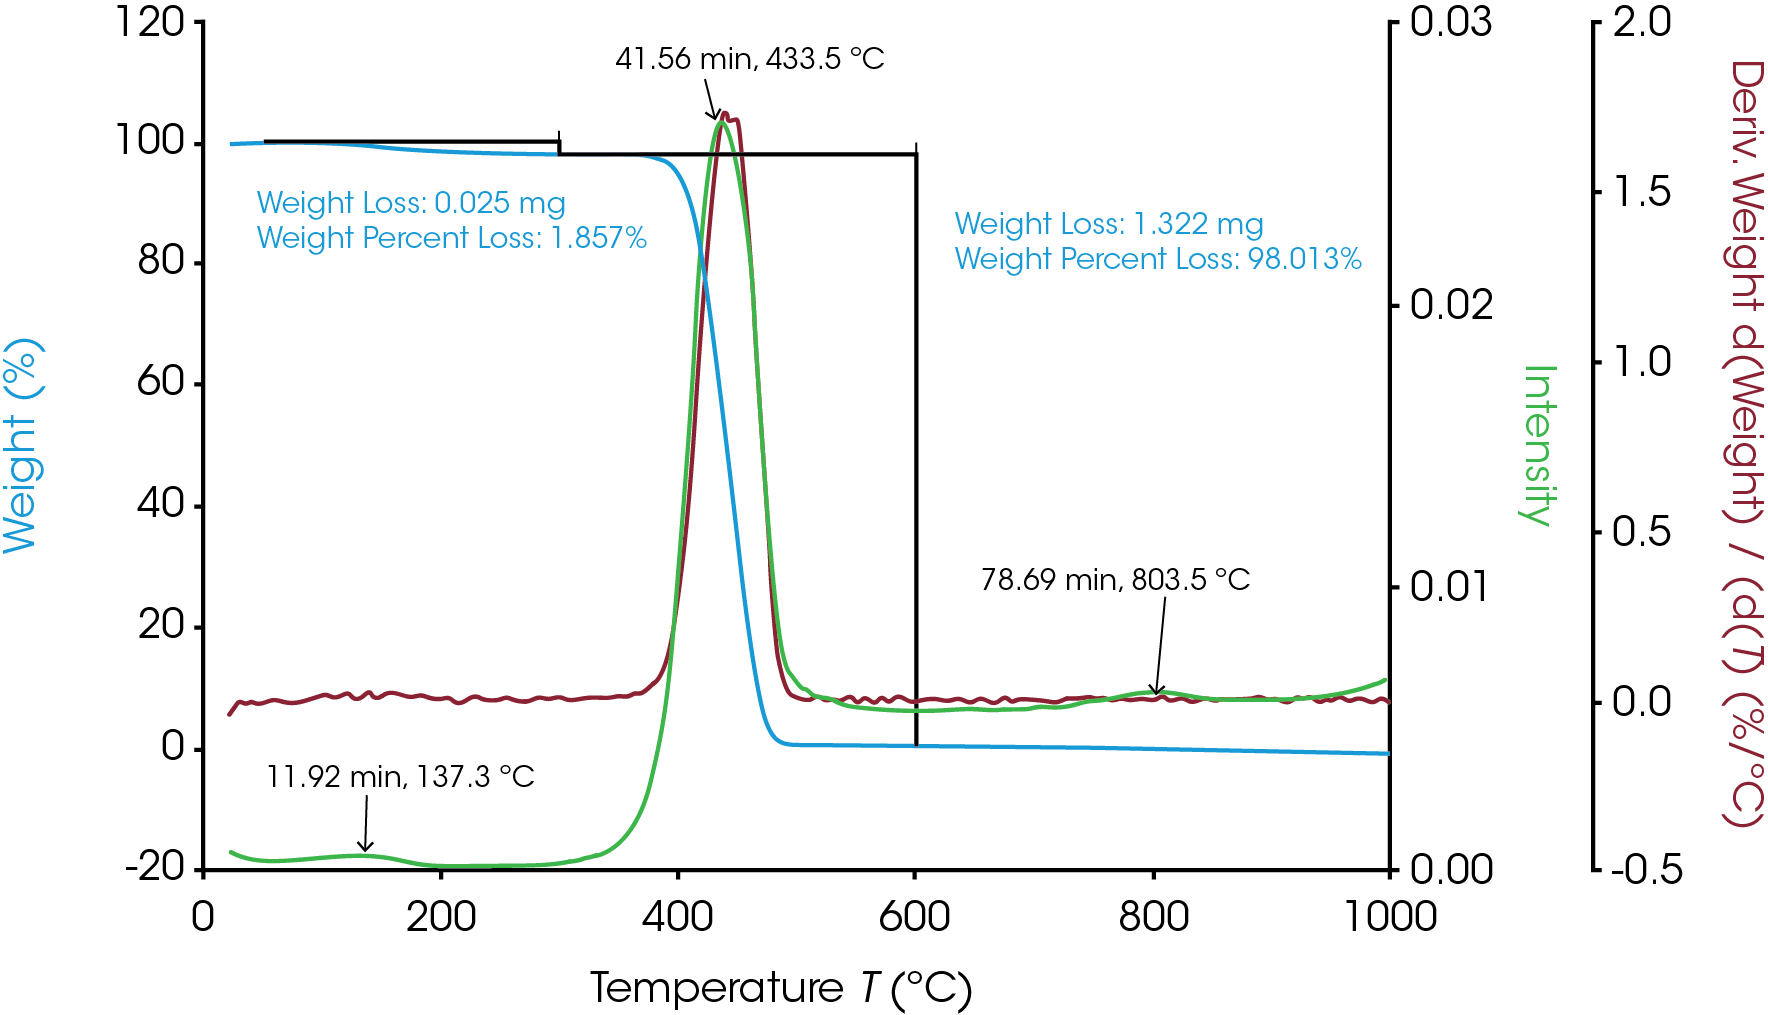
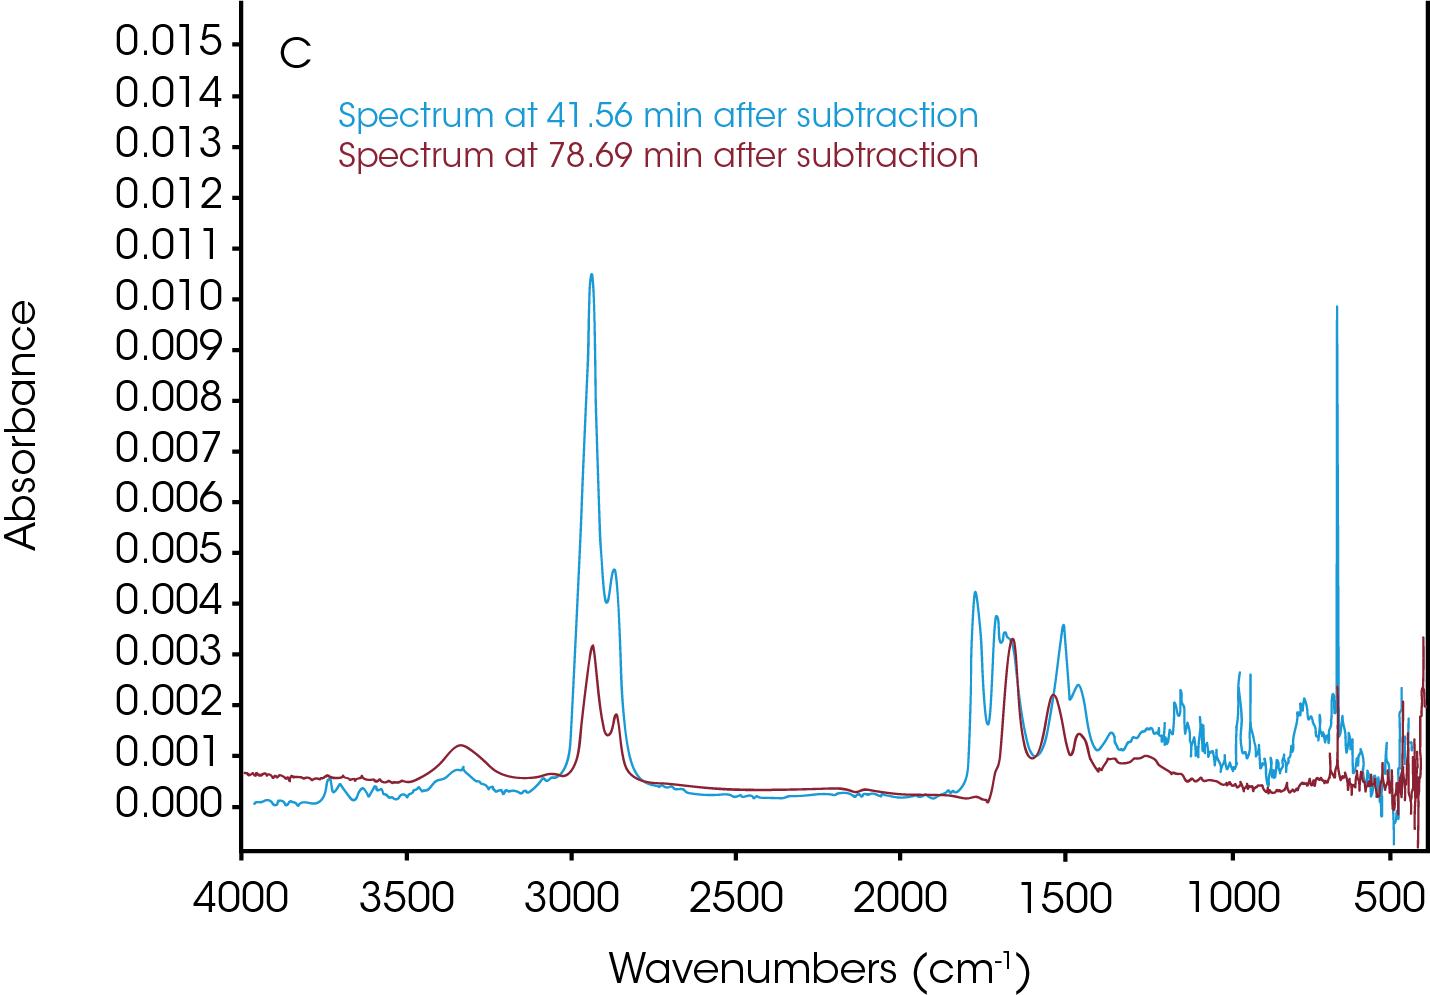
The TGA-FTIR spectra of nylon 66 were stored as a function of time in an array in a Gram Schmidt file. Since time and temperature can be easily correlated in a TGA experiment, the TGA curve was analyzed to determine at what time the volatilization and the degradation happened. The Gram Schmidt file is plotted in green in Figure 6 overlaying the TGA weight change and the derivative curves. As shown in Figure 6, three time points associated with the IR intensity peak were selected. Time 11.92 min corresponds to the volatilization at 137.7 °C; time 41.56 min is associated with the degradation at 433.8 °C; and time 78.69 min gives information about the off-gas products after the major decomposition.
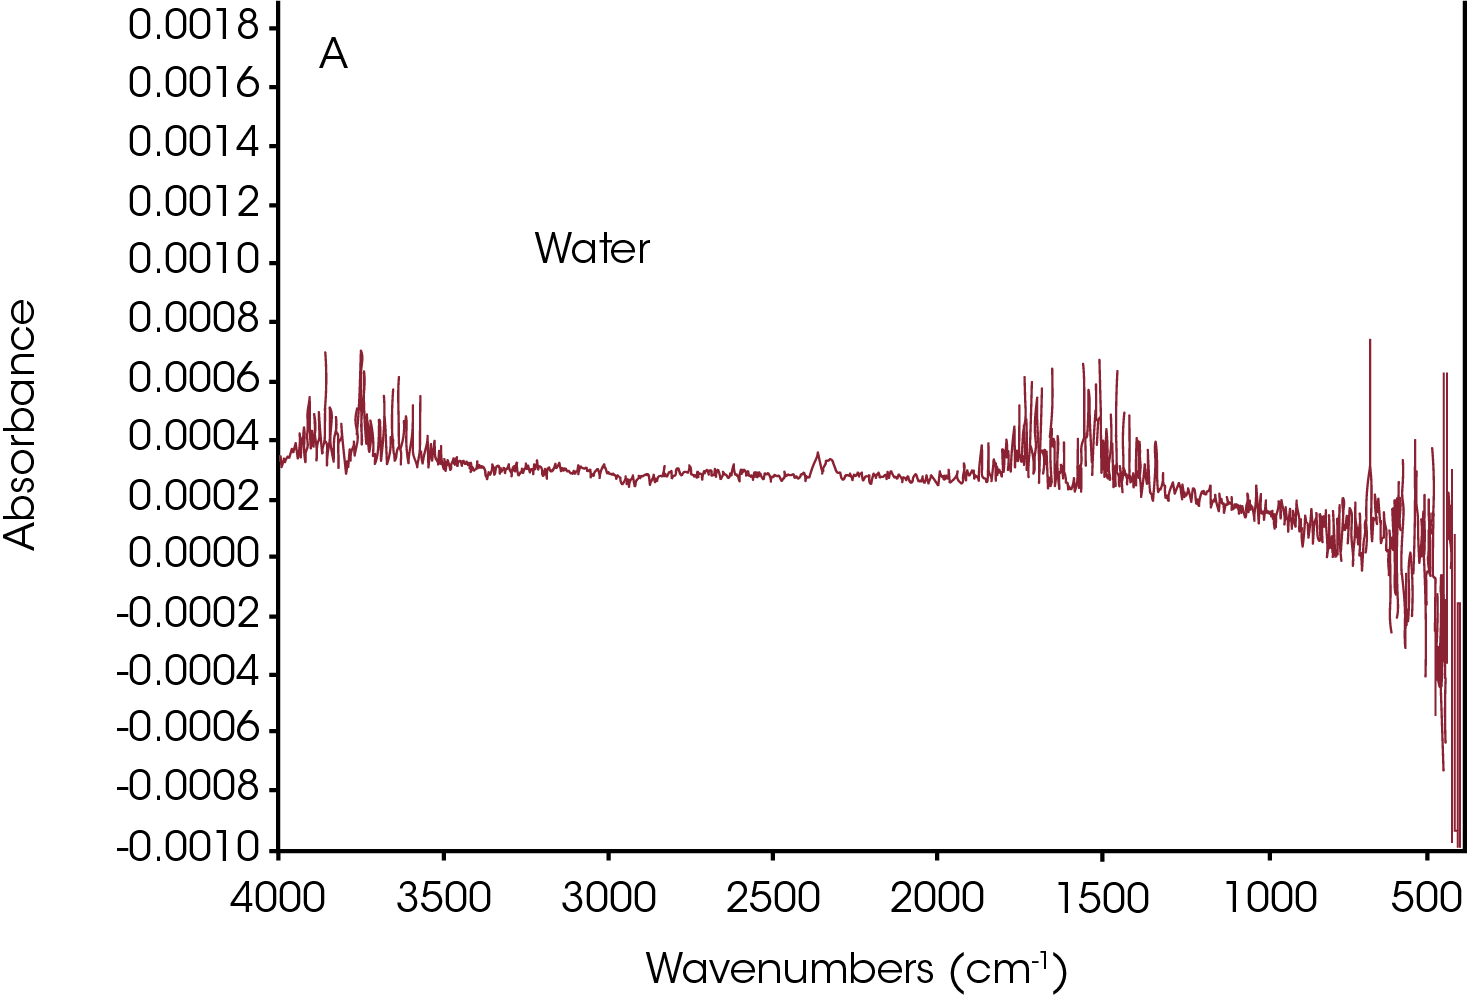
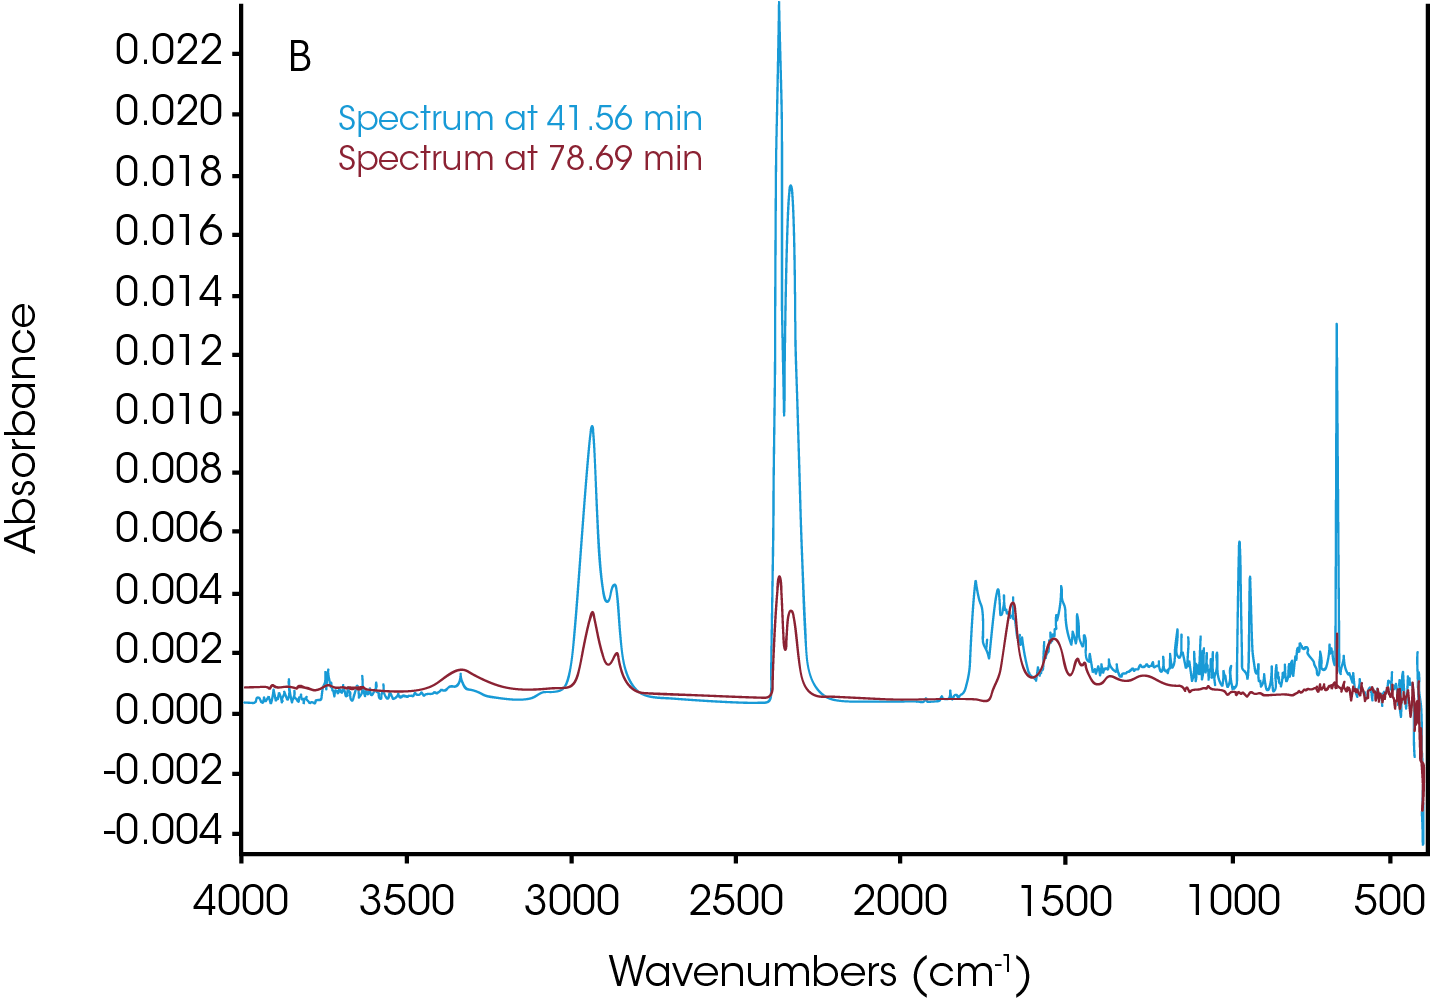
Three data points (t = 11.92, 41.56 and 78.69 min) were selected and the associated FTIR spectrum at each time t was analyzed. The FTIR spectrum in Figure 7a from t = 11.92 min shows water in the volatilization step. Figure 7b shows the FTIR spectra at t = 41.56 min and t = 78.69 min. Water, CO2, and ammonia are very apparent. Reference spectra from Omnic vapor phase and NIST search libraries of those gases were subtracted from the spectra for ease of the spectral interpretation. The subtracted spectra were plotted in Figure 7c. Noticeably bands above 1760 cm-1 indicates the constrained carbonyls and cyclopentanone can be the major decomposition products. This agrees with the data from the TGA-MS experiment. Some other off-gas products such as 2-methylcyclopentanone, 2-piperidinone, and caprolactam could also come out based on the spectra in Figure 7c. There is an absorbance around 1500 cm-1 which is possibly contributed from a secondary amide structure. The possible chemical components are 1,6-hexanediamine and N,N′-dimethyloxamide.
The ATR-FTIR spectrum perfectly matches the chemical structure of nylon 66. Clearly, during the thermal degradation, off-gas products like CO2 and NH3 come off but are not detected by the ATR-FTIR at room temperature. FTIR is a very sensitive technique to study materials’ chemical compositions. With the combination of TGA and FTIR, thermal degradation products can be easily evaluated.
The TGA-FTIR results compliment the TGA-MS results. Both techniques provide useful information about the structures of the off-gas products from the nylon 66 thermal degradation process. FTIR can be very helpful to identify the presence of certain chemical bonds and some functional groups in polymers. It is widely used for polymer characterization. Mass spectrometry can also give insightful information to study materials’ structure. It is sensitive where little sample is needed and is great when need to look for specific masses. TGA-MS technique can be used to identify specific masses of small molecules from thermal degradation. Combining both TGA-FTIR and TGA-MS, the clarification of the nylon 66 decomposition process and the evolved gas analysis becomes easier.
TGA-GC/MS
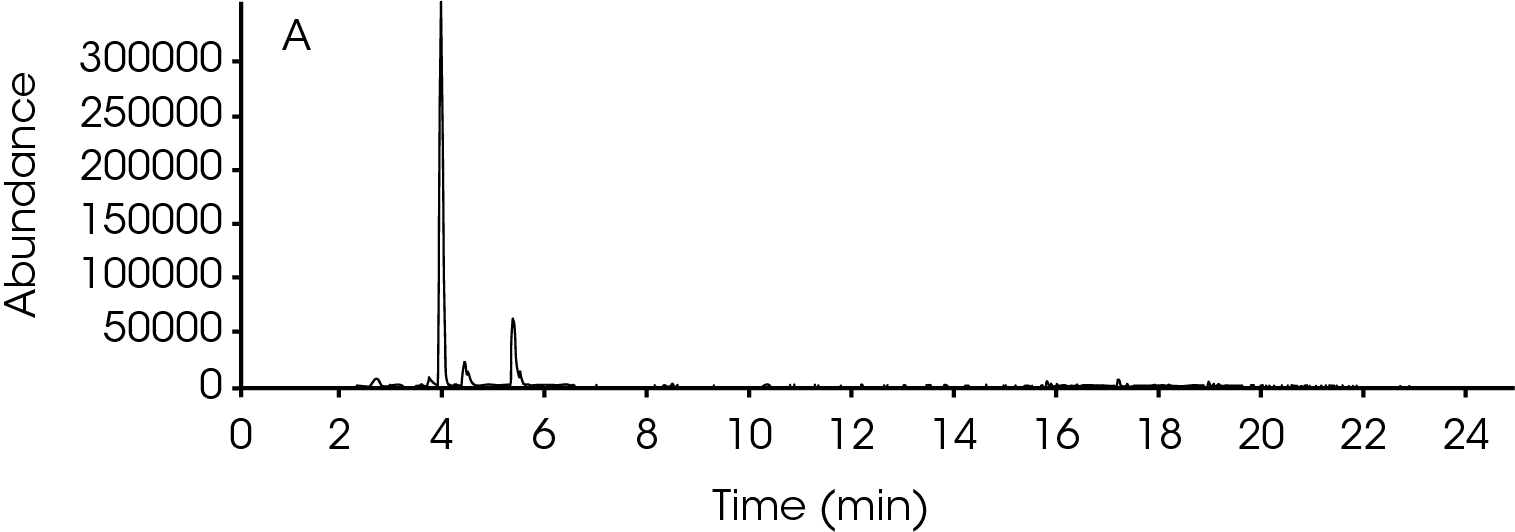
TGA-MS and TGA-FTIR can continuously monitor the decomposition off-gas products and decomposition processes, but they have some limitation such as identifying fragments in the decomposition off-gas products that are evolved at the same time. From the TGA-MS and TGA-FTIR data, clearly there were multiple off-gas products evolved during the thermal decomposition of nylon 66. One advantage of using GC/MS is its ability to separate complicated mixtures which is great for evolved gas analysis using TGA. A GC/MS scan was carried out on the GC/MS unit. A TGA test was programed to run to 437 °C where an injection of the off gasses was done for the GC/MS analysis.
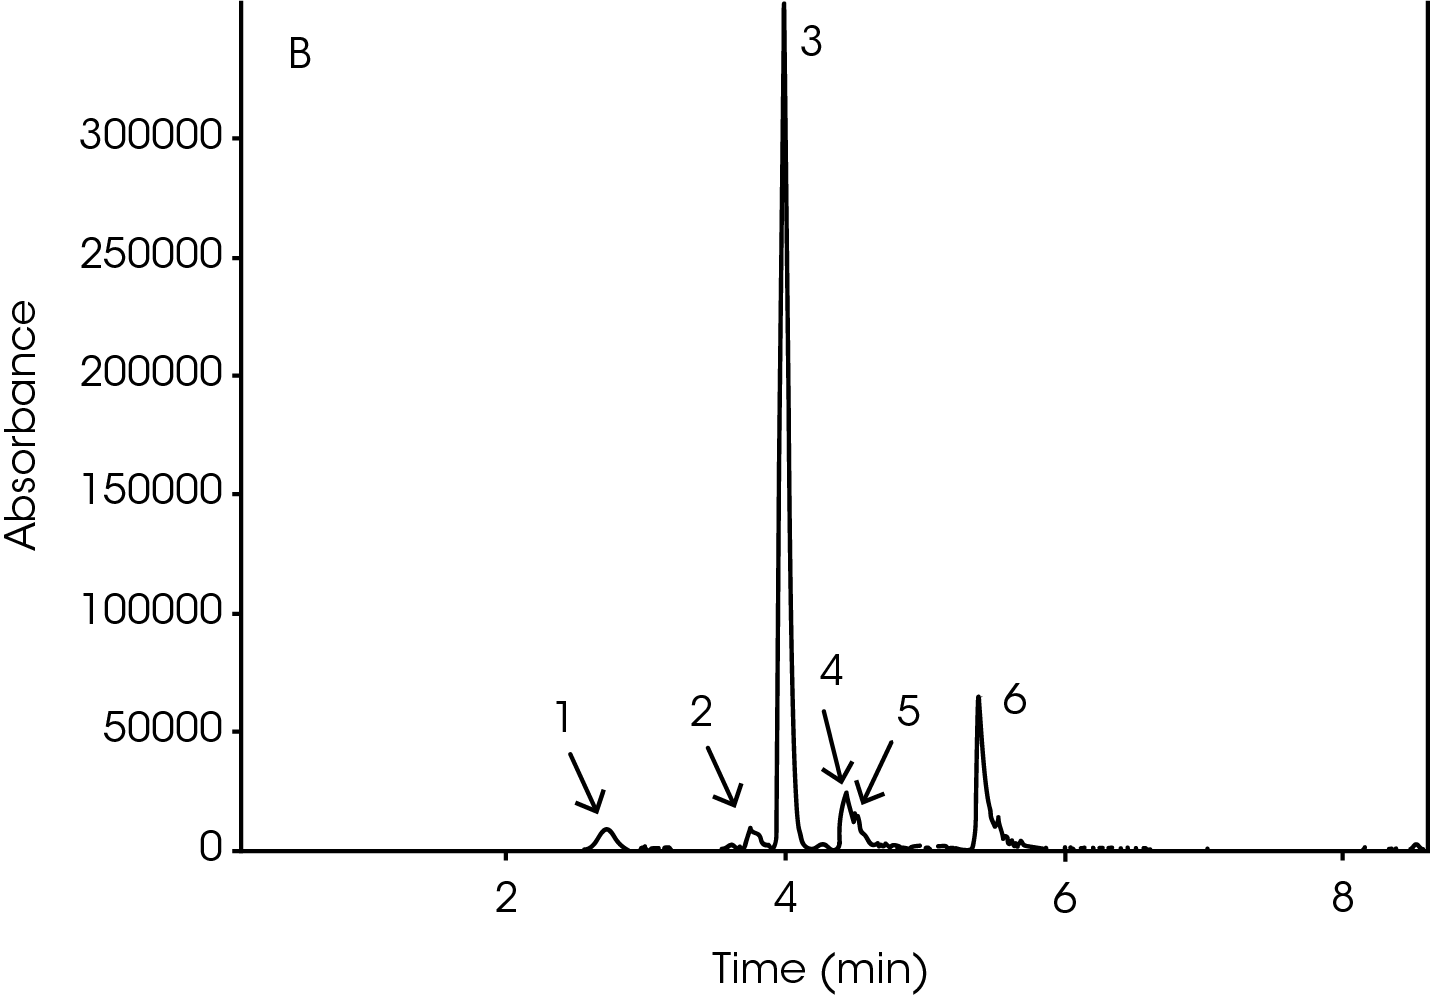
The GC/MS chromatogram is presented in Figure 8 with six peaks indicating six possible molecules. At the peak max of each labeled peak, there is an associated mass spectrum and is plotted in Figure 9. The associated MS spectrum gives a specific structure of a single molecule. This provides more accurate library search results compared to TGA-MS. Each MS spectrum in Figure 9 is provided with a best matched chemical structure from the library. The structures obtained from the GC/MS experiment agree very well with the TGA-MS and TGA-FTIR results with an additional chemical separation at the given temperature. It has been reported that cyclopentanone, hexamethyleneimine, and hexylamine are in the off gasses [4, 7], which is detected by all three techniques used in this study. It is not surprised to see that smaller fragments are the major pyrolysis products as the polymer is decomposed completely. The benefit of TGA-GC/MS is that it can separate mixed chemicals at a given time or temperature and can be used as a step to further confirm the results from TGA-MS and TGA-FTIR experiments.


Conclusions
In this work, TGA-MS, TGA-FTIR, TGA-GC/MS were used to investigate the thermal degradation process of nylon 66 and its decomposition products. These hyphenated techniques can be very helpful for the understanding of thermal degradation process of materials. TGA-MS and TGA-FTIR have the advantages of continuously monitoring the off-gas production and decomposition process. Nylon 66 gives off volatiles such as water, CO2, NH3 and some polymer fragments. TGA-MS provides a quick survey on volatiles and decomposition process to identify small molecules and specific ion fragments. TGA-FTIR is the best technique to identify specific functional groups. TGA-GC/MS enables the separation of a mixture of molecules that often evolve at the same time during decompositions. Combining different techniques together helps understand the thermal degradation of materials better and discover the chemical structures of the off-gas products.
References
1. Charles, Julie & G R, Ramkumaar & Gunasekaran, Sethu.(2009). FTIR and Thermal Studies on Nylon-66 and 30%Glass Fibre Reinforced Nylon-66. E-Journal of Chemistry. 6.23- 33. 10.1155/2009/909017.
2. N. Vasanthan. Journal of Chemical Education 2012 89 (3), 387- 390
3. Herrera, M., Matuschek, G. & Kettrup, A. Thermal Degradation Studies of Some Aliphatic Polyamides Using Hyphenated Techniques (TG-MS, TG-FTIR). Journal of Thermal Analysis and Calorimetry 59, 385–394 (2000).
4. Holland, B.J. and Hay, J.N. (2000), Thermal degradation of nylon polymers. Polym. Int., 49: 943-948.
5. Braun, E., Levin, B. C. Nylons: A Review of the Literature on Products of Combustion and Toxicity. Fire and Materials 11,71- 88 (1987).
6. Feng Jia, et al., physical and mechanical properties of hydrogenated dimer acid-based Nylon 636/Nylon 66 copolymers, Chinese Chemical Letters, Volume 24, Issue 7, 2013, Pages 654-658.
7. Peebles, L.H., Jr. and Huffman, M.W. (1971), Thermal degradation of nylon 66. J. Polym. Sci. A‐1 Polym. Chem., 9: 1807-1822.
Acknowledgement
This paper was written by Yue Schuman, Ph.D. and Hang Lau, Ph.D., Applications Support Engineers at TA Instruments.
Click here to download the printable version of this application note.

