Keywords: Polyprolylene, nucleation, crystallization, processing, extrusion, colorant, Avrami, non-isothermal crystallization, DSC
TA393
Abstract
Polypropylene is a very common polymer used for a variety of applications due to its versatility and relatively low cost. Crystallization temperature and associated heat of crystallization are important characteristics and are sometimes used to differentiate various resins in addition to melting temperature and heat of fusion. Crystallization characteristics of polypropylene can be modified by compounds called ‘nucleating’ agents (or simply nucleators) which are added to improve cycle time, mechanical properties, and in the case of clarifiers, optical properties. Other compounds can affect the crystallization of polypropylene including fillers, impact modifiers, and some colorants. Some compounds will adversely affect the performance of nucleators and some colorants and impact modifiers will preferentially nucleate β–spherulites in polypropylene under certain cooling conditions. This paper utilizes a single run DSC experiment and analysis of the crystallization data using the Avrami equation to obtain a cursory but useful comparison of crystallization characteristics of different colored polypropylene marker caps purchased from an office supply store.
Introduction
DSC is a powerful tool for obtaining information from materials based on the response to change in temperature including phase changes and various kinetic events. The extensive collection of DSC data of polymers in the literature allows one to sometimes obtain compositional information and is often utilized in conjunction with other analytical techniques for identifying polymers. DSC is often used to characterize and compare polymers both as a means of determining initial processing parameters and as a diagnostic tool for identifying certain processing problems. One common problem in polymer processing is variations in cycle time between plastics that are known to have the same composition and formulation. Often the addition of color concentrates, fillers, additives and other plastics can affect cycle times and end use properties. When variations in processing behavior are observed, often an initial investigation is a thorough compositional analysis which may or may not yield an explanation and is costly and time consuming. A simple DSC experiment can often demonstrate significant potential processing differences between what are believed to be ‘similar’ materials. In addition to a comparison of thermal events, another way to obtain more information from the DSC experiment is to analyze the crystallization (cooling) data using the Avrami equation macro kinetic model. This experiment is done at a constant cooling rate so it is ‘non-isothermal’, but the generated data can be converted to a time scale easily. This yields a useful comparison of crystallization half-time, rate constant and geometric exponent in addition to the crystallization temperature, TC. This is an elegant way to compare two or more samples to determine if there is a need for more extensive kinetic study. From a practical standpoint, it is often an effective means to verify analytically that differences between ‘good’ and ‘bad’ samples exist. Essentially this is a single-point dynamic or non-isothermal crystallization experiment and some basic definitions must be made.
The Isothermal Crystallization Experiment
Isothermal crystallization studies of plastics and other materials by DSC have been extensively utilized and documented in the literature and many use the Avrami equation to fit the crystallization data. In the isothermal crystallization experiment, the polymer is held above its equilibrium melt temperature1 and rapidly cooled to a temperature below its melting temperature. The time at which the sample reaches the chosen isothermal crystallization temperature is taken to be t0. As the sample crystallizes the exotherm is plotted as a function of time and the time at some extent of crystallization or conversion is recorded. If the apex of the exotherm peak is chosen, the time difference between t0 and the time at the apex is referred to as the crystallization half-time (X(t) = 0.5) or t1/2 – assuming the exotherm is reasonably symmetric. The duration of this crystallization time is related to the degree of undercooling of the temperature chosen in the experiment, and if several temperatures are utilized, the Avrami parameters can be used in the Arrhenius equation to calculate the crystallization activation energy.
In the isothermal crystallization DSC experiment, the fraction crystallized as a function of time can be expressed by Equation 1.

where:
X(t) is fraction crystallized at time (t).
ΔHC = Overall enthalpy of crystallization – area under the crystallization curve of the DSC experiment.
ΔHt – enthalpy crystallized at an arbitrary extent of conversion
dHC = enthalpy of crystallization during infinitesimal time range (dt).
t0 = defined as the time at initial crystallization.
t = times during crystallization process
t∞ = time when crystallization process is complete
The function of crystallized fraction X(t) can be fitted using Equation 2, the Avrami Equation:

where:
X(t) = fraction crystallized as a function of time
ka = Avrami Rate Constant
na = Avrami Exponent
t = time (seconds or minutes)
Simple rearrangement of Equation 2 yields the linear form of the Avrami equation:

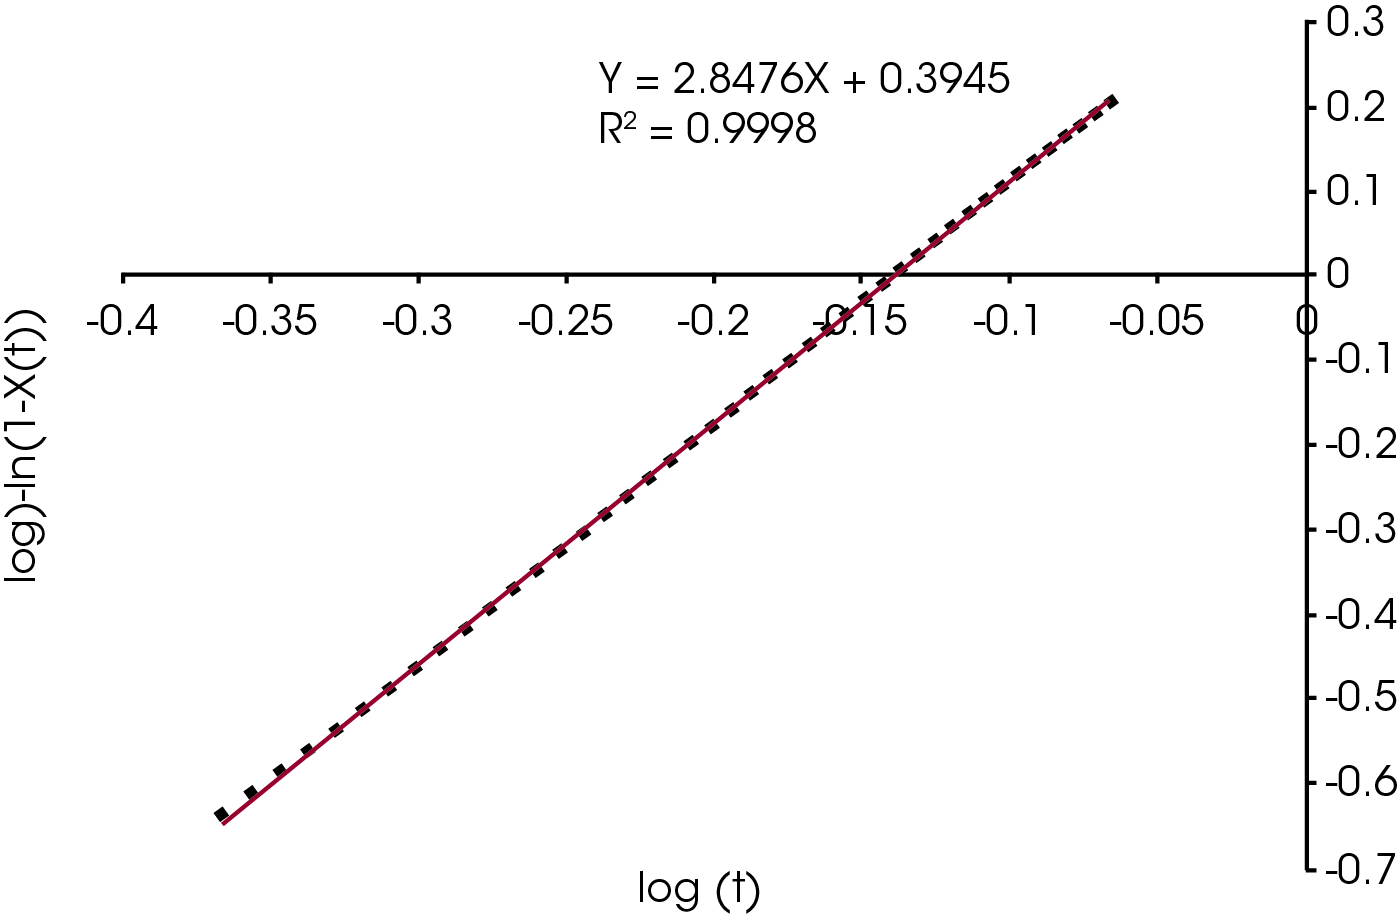
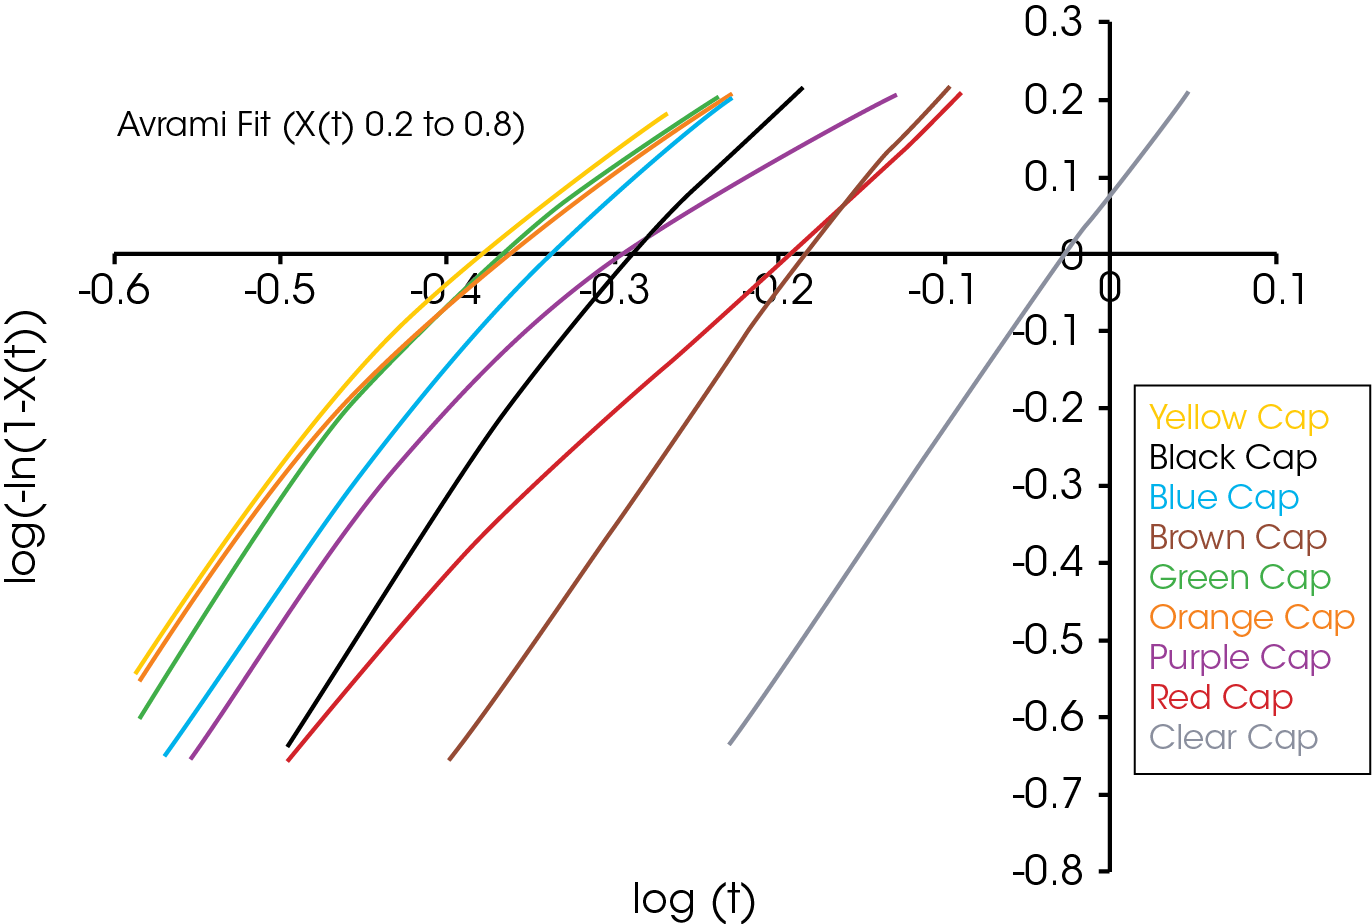
A plot of the log (-ln(1-X(t)) versus log t is linear and yields the Avrami parameters ka (antilog of intercept) and na (slope). The Avrami exponent correlates with the nucleation growth geometry and is summarized in Table 1.
Table 1 – Simplified Avrami Exponent Interpretation
| Avrami Exponent | Growth Geometry |
|---|---|
| 1≤n≤2 | 1-dimensional, rod-like |
| 2≤n≤3 | 2-dimensional, disc-like |
| 3≤n≤4 | 3-dimensional, spherulitic |
The Single Point Non-Isothermal Crystallization Experiment
The Avrami equation is also used in non-isothermal crystallization studies. Contrasted with the isothermal method, non-isothermal crystallization data is obtained by heating or cooling the sample at a cooling rate instead of isothermally. The data can also be used to determine crystallization kinetics including activation energies (ΔE) if several cooling rates are uses.
In this simple form of the experiment we utilize a single DSC heating rate and compare Avrami parameters kA and nA, the Avrami rate constant and nucleation exponent.
An analogous expression for Equation 1 is shown in Equation 4 for fraction crystallized as a function of temperature.

where:
X(T) is fraction crystallized at temperature T.
ΔHC = Overall heat of crystallization – area under the crystallization curve of the DSC experiment.
dHC/dT = enthalpy of crystallization during infinitesimal temperature range dT. This is obtained from a table of integral values generated by the DSC instrument software from the data obtained during the DSC experiment. This can also be generated manually from heat flow rate information from the DSC experiment.
T0 = defined as the temperature at initial crystallization.
T = temperatures during crystallization process
T∞ = Temperature when crystallization process is complete
Equation 4 can be related to Equation 1 by using Equation 5 to convert the temperature dependent data to time dependent data and fit using the Avrami equation.

where:
t = time in minutes or seconds
T0 = temperature at crystallization onset
T = Temperature(s) during crystallization process
φ= cooling rate (°C / min)
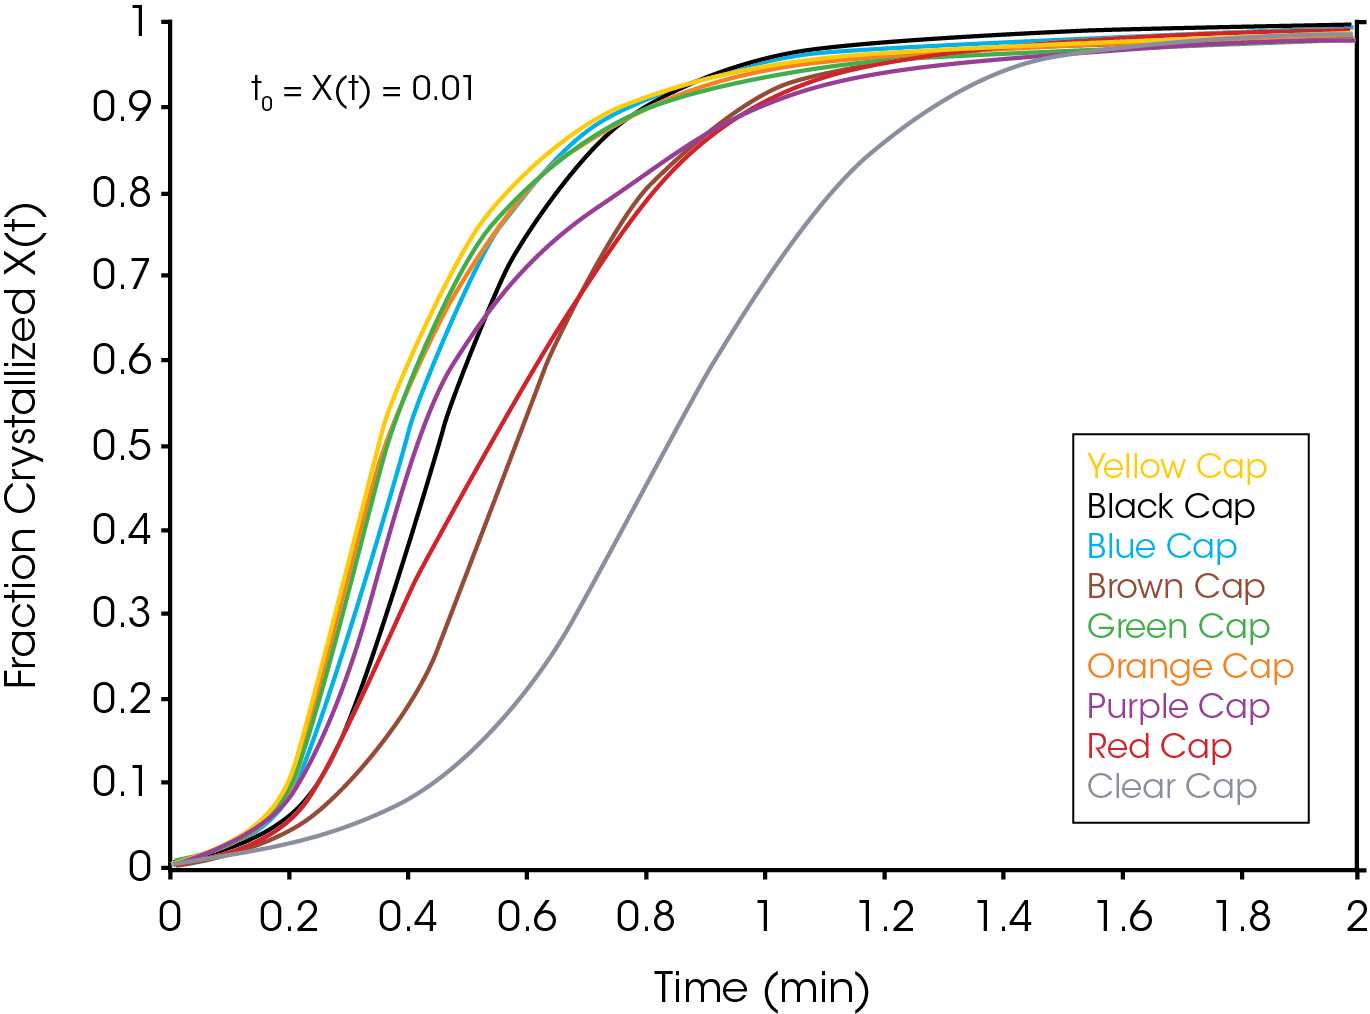
For this experiment t0 is obtained by defining it at some point of conversion – arbitrarily 1%. Simply stated, t0 is taken to be the time corresponding to X(t) = 0.01 (Equation 1). Once t0 is established, the linear form of the Avrami equation (Equation 3) is utilized to plot log(-ln(1-X(t)) versus log t. Equation 3 is a linear equation of the form of y-mx +b, but often the crystallization data is linear in a narrow range and often different crystallization regimes are apparent. A good starting point is between the limits of X(t) = 0.2 and X(t) = 0.8. This will often yield a straight line of slope n and intercept log k. From the Avrami parameters one can calculate t1/2 using Equation 6.

The Effect of Color Concentrates on Polypropylene Nucleation
A common problem that plastics suppliers face is that their products sometimes appear to process inconsistently. This experiment illustrates that potential differences in processing behavior can be detected using a simple DSC cooling experiment – typically part of a routine heat – cool – re-heat experiment. Resin suppliers often are not involved with compounding color concentrates or pigments into the final products – this is typically done by the customer or other compounding service. Pigments, dyes, and fillers are known to affect the crystallization properties of polypropylene, and many additives used in the dispersal of pigments can affect the performance of processing aids added to polypropylene. One example is the effect of metal salts of fatty acids on a common nucleator, sodium benzoate.
Experimental
Samples
Samples used were marker pen caps in various colors purchased from a local office supplier. They are polypropylene but we do not have access to the formulation. We are making the presumption that the base resin is likely the same formulation. Sample colors include black, red, yellow, brown, orange, green, blue, and purple. We also include a cap made from polypropylene containing no pigments as a reference.
Instrument and Experimental Parameters
- Instrument: TA Instruments Q2000 DSC
- Sample Mass: 5 mg nominal
- Purge Gas: N2 at 50 mL / minute
- Temperature and Heat Flow Calibration: Indium and sapphire standards
- Method – Samples were heated to 235 °C to remove all thermal history and subsequently cooled at 10 °C /minute to 0 °C.
Results & Discussion
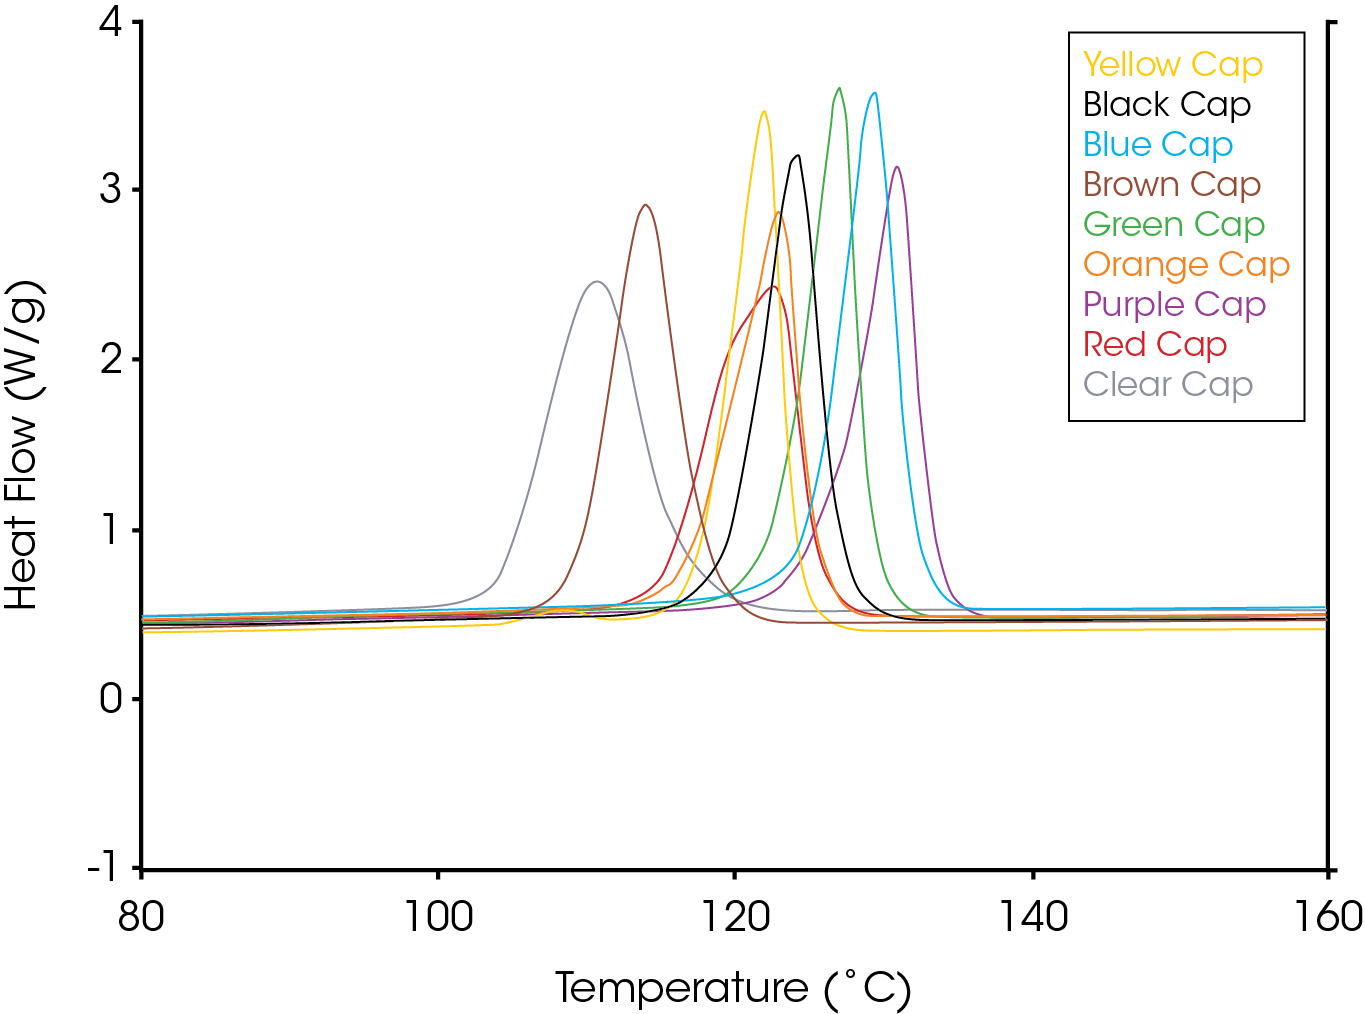
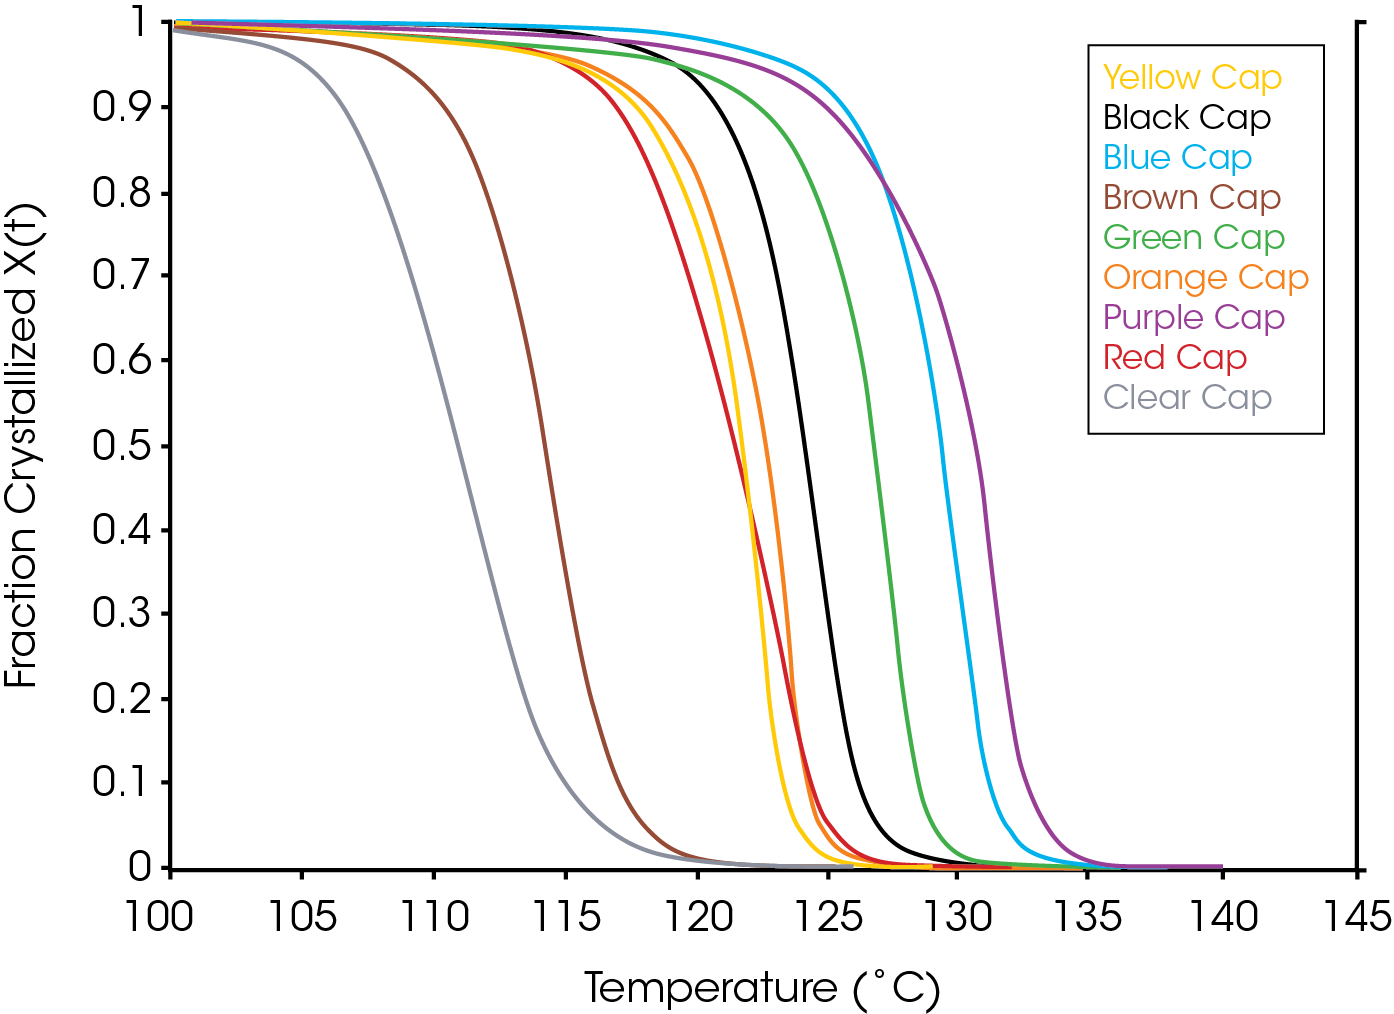
Figure 2 shows an overlay of non-isothermal crystallization exotherms. It is obvious that the different colored caps yield a substantially different array of exotherms of differing shapes, symmetries, and crystallization temperatures. Figure 3 shows the fraction crystallized as a function of temperature – generated from Equation 4. Figure 4 shows the fraction crystallized after converting to time domain (Equation 6) and applying Equation 1. One obvious observation is that the sample with the highest crystallization temperature is not necessarily the fastest to crystallize.
The single point Avrami analysis is summarized in Table 2 and Figure 5. Each color part has very different crystallization characteristics compared with each other and the reference (no colorant) polypropylene sample. The Avrami exponent ‘n’ is related to the nucleation geometry. It does not hold the same meaning as in the isothermal experiment, but can be used to compare similar samples. The different values for ‘n’ observed in the samples indicate that the materials crystallize differently and would likely have different physical properties. In the non-isothermal experiment, we have empirically observed that commercial nucleators tend to yield values close to 2 in polypropylene while values close to 3 are observed in samples that do not contain a chemical nucleator. Each of the samples has a rate constant ‘k’ that is substantially higher than the sample with no colorant. One interesting observation is that the yellow sample crystallizes fastest, but has a significantly lower crystallization temperature (TC) than the purple sample which has the highest TC. The black and brown samples have the most similar value of ‘n’ to the sample with no colorant, although both crystallize significantly faster. The brown sample also has a similar TC to the non-colorant sample.
Table 2 – Summary of Single Point Avrami Analysis
| Sample | TC °C | n | k | t1/2 (min) | τ (Reciprocal half-time-min-1 |
|---|---|---|---|---|---|
| Red | 122.7 | 2.053 | 2.507 | 0.535 | 1.87 |
| Brown | 113.9 | 2.956 | 3.071 | 0.604 | 1.66 |
| Black | 124.2 | 2.786 | 3.088 | 0.458 | 2.18 |
| Purple | 130.8 | 1.896 | 3.282 | 0.440 | 2.27 |
| Blue | 129.4 | 2.472 | 6.515 | 0.404 | 2.48 |
| Orange | 122.8 | 2.103 | 5.421 | 0.376 | 2.66 |
| Green | 127.0 | 2.271 | 6.299 | 0.378 | 2.65 |
| Yellow | 121.9 | 2.287 | 6.992 | 0.364 | 2.75 |
| No Colorant | 110.7 | 3.094 | 1.200 | 0.837 | 1.19 |
References
- Razavi-Nouri, Mohammad, Iranian Polymer Journal, 18 (2), 2009, 167-178
- Maria Laura Di Lorenzo, Sossio Cimmino, and Clara Silvestre, Macromolecules 2000, 33, 3828-3832
- Minqiao Ren,1 Jianbin Song,1 Qingxiang Zhao,2 Yuesheng Li,1 Qingyong Chen,1; Polym Int 53:1658–1665 (2004)
- Hongfang Zhang1 and Zhishen Mo1Pakin Thanomkiata, Duangdao Aht-ongb, Pitt Supaphol, Polymer Testing 24 (2005) 873–885
- P. Supaphol, J. Appl. Polym. Sci. 78 (2000) 338
- Q.X. Zhang, Z.H. Zhang, H.F. Zhang, Z.S. Mo, J. Polym. Sci. Polym. Phys. 40 (2002) 1784.
- P. Supaphol, P. Thanomkiat, R.A. Phillips, Polym. Test 23 (2004) 881.
- http://www.chemistrymag.org/cji/2003/05a081pe.htm Oct. 1, 2003 Vol.5 No.10 P.81 Gao Jungang, Li Shurun, Li Zhiting
- Jiann-Wen Huang, Ching-Chih Chang, Chiun-Chia Kang, Mou-Yung Yeh; Thermochimica Acta 468 (2008) 66–74
Conclusions
- A simple heat / cool experiment can yield significant information when comparing similar polymers by applying a simple, common mathematical treatment to the crystallization data. The quality of the data is dependent upon the quality of the baseline. TA Instruments TZero® technology offers superior baseline performance.
- The samples analyzed in the experiment above yield varying Avrami parameters and will likely process differently. It is likely that adjustments to the processing conditions have to be made based on the results – assuming the resin formulations are the same and the differences observed are caused by the colorants or the additives in the color concentrates.
- For polypropylene parts the effect of additives, pigments, fillers, etc. on the crystallization performance can be compared with a single point Avrami analysis as well as useful diagnostics of processing problems and potentially optimizing process conditions.
- The single point non-isothermal experiment offers a convenient way of comparing materials that may exhibit different processing characteristics using a common heating rate. The data will not have the same meaning as an isothermal crystallization experiment, but is useful in comparing different samples of the same resin that exhibit different processing traits.
Click here to download the printable version of this application note.

