Keywords: Differential Scanning Calorimetry, Antibody Drug Conjugate, drug load, linker
MC164
Abstract
Protein stability, particularly antibody stability, can be determined by differential scanning calorimetry (DSC) without restrictions on buffers, excipients, or detergents. This characterization method works equally well for novel biotherapeutics, some of which are bispecific antibodies, biosimilars, and modified antibodies including antibody drug conjugates (ADCs). For this example, an ADC was prepared using two different conjugation methods with varying drug loads. The DSC thermogram was able to detect and quantify the differences in the drug loads with respect to thermal parameters including Tm, Tonset, and enthalpy (ΔH).
Introduction
Antibody Drug Conjugates (ADCs)
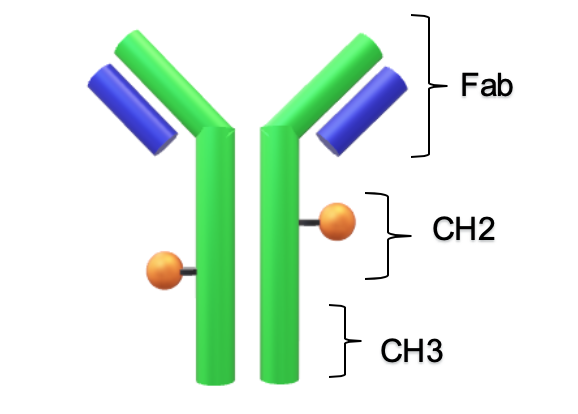
Anti-cancer monoclonal antibodies are “extremely discriminating for their targets but sometimes therapeutically ineffective on their own” [1]. This challenge led to the development of biotherapeutics that check both boxes: Antibody Drug Conjugates (ADCs, cartoon Figure 1). ADCs combine the specificity of an antibody with the cytotoxicity of a potent small molecule. For these site-directed killers, it is crucial to keep the load, the cytotoxic small molecule, on the antibody until the destination has been reached. Just as important is monitoring the payload after preparation to better predict toxicity and dosage. It has already been established that antibodies have a strong structure-function relationship and quantification of how the drug may change this structure will be a predictor of the function [2-3].
Differential Scanning Calorimetry (DSC)
DSC is one of multiple biophysical characterization techniques used in understanding antibody structure. Others have established that “the biophysical properties of candidate molecules have implications for development of therapeutics relating to purification, formulation, pharmacokinetics, immunogenicity and dosing regimens” [4]. DSC is a biophysical characterization technique used to study the stability of compounds including lipids, proteins, and oligonucleotides, in their native state. This type of measurement is of interest for antibodies because stability directly impacts their structure and ultimately their function [2-3]. This stability is often reported as Tm value, where for two-state systems this is the state when ½ of the molecules are unfolded. At this point, ΔG = 0 (free energy = 0) which is why a temperature is typically reported for stability instead of a free energy value because of this relationship. The Gibbs-Helmholtz equation can be used if a ΔG at alternative temperatures are preferred. Often the Tm value that is reported is a Tmax value and for symmetrical unfolding events these will agree with each other. Ultimately the thermal stability is of interest because poor stability can affect the solubility and lead to aggregation, a common concern for biotherapeutics [5-8].
Where many other techniques start and stop at Tmax the DSC also gives the change in the partial heat capacity (ΔCp), enthalpy (ΔH) and full-width at half-max (FWHM) all in one scan. The ΔHcal reported is the model-free enthalpy required to disrupt the hydrophobic and hydrophilic interactions that stabilize the protein structure. There are also external stabilizing forces that greatly contribute to the stability of a protein in the buffer, its excipients and salt concentrations which stabilize or destabilize the protein. One example is the buffer’s influence on the H-bonding network that surrounds the protein [9-10]. The ΔHcal is dependent on the concentration of the sample as well and this value provides insight into the correctly folded quantities. Many protein concentration techniques measure the misfolded and unfolded protein. The ΔHcal value provides insight into the corrected folded quantities in the solution. The DSC thermogram uncovers these differences with a lower amplitude and ΔHcal. For a thorough discussion on protein assays in the DSC refer to the application note “Characterizing Protein Stability by DSC” [11] or other general reviews including an issue of Archives of Biochemistry and Biophysics dedicated to “Protein Folding and Stability” [12].
Experimental
Samples of ADCs with different drug loads: low medium, and high, were prepared at 0.5 mg/mL in 10 mM phosphate buffer, pH 7.4. In addition to varying the drug-to-antibody ratio (DAR), two types of linker-payloads were investigated, conjugate type I and conjugate type II. The native antibody, which was different for each conjugate type, was also assayed.
A Nano DSC from TA Instruments operated with DSCRun™ software was used and set to equilibrate at the initial temperature prior to the start of the scan. Each sample was run in duplicate and scanned at 1 °C/min from 25 to 95 °C. The first scans were run over a wider range, 4 to 95 °C to capture any low temperature events (none were present) and then the range was decreased to save time. The background used to correct the data files was the supplied buffer, 10 mM phosphate buffer at pH 7.4. This buffer was also loaded into the reference cells for each sample run.
Data were processed using NanoAnalyze™. A buffer background was subtracted from each individual scan leaving the partial molar heat capacity, which was normalized using the moles of the protein in the active cell volume, 300 μL. A third or fourth order polynomial was applied as the baseline to the normalized data for area/enthalpy, ΔHcal, determination. The baseline applied had one to two nodes prior to the rise in the slope, and first peak, the CH2 peak. One to two node points were applied following the highest temperature event, CH3 unfolding. Baseline corrected data was fitted with Gaussian models which yielded the fitting parameters of the enthalpy (ΔH), amplitude, full-width at half-max (FWHM), and Tmax.
Results
Conjugate Type I
Tmax for the largest unfolding event, the Fab domain, decreased from Native to High, indicating that the Native form is more stable than the modified forms (Figure 2). Prior to the experiment the instrument was calibrated and validated with dipalmitoylphosphatidylcholine (DPPC) having a Tmax shift of less than 0.1 °C from the expected literature value. Standard deviation of less than 0.1 °C is only of statistical significance. A standard deviation less than the acquisition accuracy are listed as ± 0.1 °C in Table 1. From the Gaussian fit the FWHM of the peak decreases from Native to High. The change is also observed in a lower Tonset and higher Tmax for the Fab. The most evident change is the additional growing peak at lower temperatures in the modified forms that is absent in the Native. Instead, the Native antibody has a shoulder that overlaps with the larger Fab unfolding event. The accumulated peak’s enthalpy decreased from Native to High.
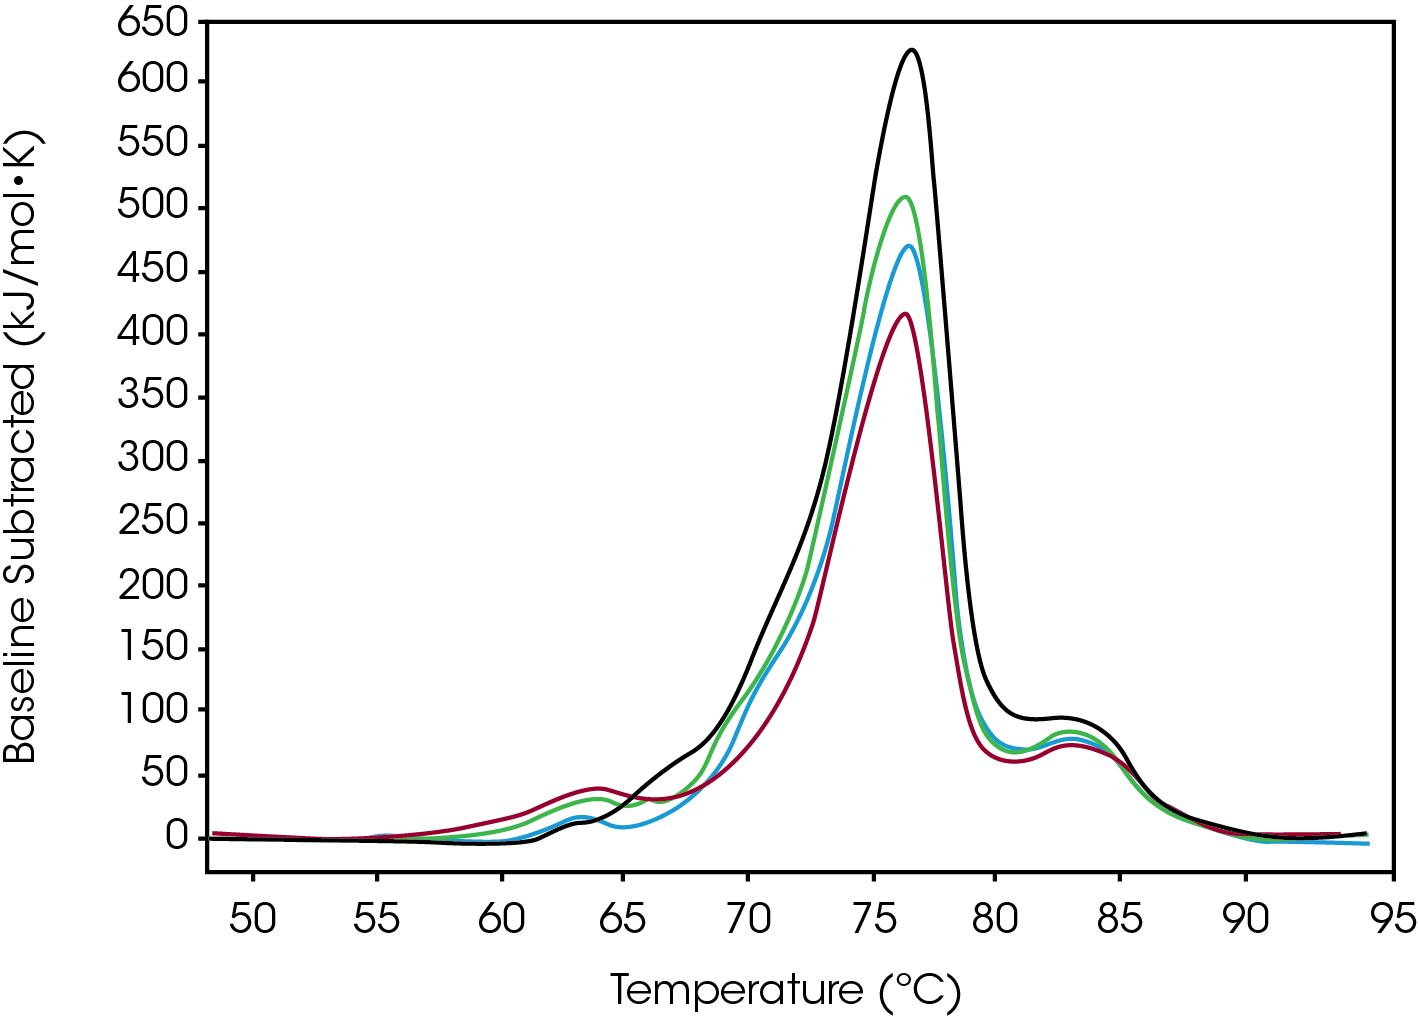
Table 1. Average values and standard deviation from two sets of Conjugate Type I data fitted with a baseline in NanoAnalyze™. A standard deviation of less than 0.1 ºC is shown as 0.1 ºC.
| ºC | kcal/mol | |||
|---|---|---|---|---|
| Type-1 | FWHM | Tmax | Tmax – Tonset | ΔHcal Total |
| Native | 5.1 | 76.7 ± 0.1 | 7.7 | 1060 ± 40 |
| Low | 4.8 | 76.5 ± 0.1 | 7.3 | 800 ± 40 |
| Moderate | 4.9 | 76.4 ± 0.1 | 6.5 | 791 ± 7 |
| High | 4.5 | 76.2 ± 0.1 | 5.7 | 690 ± 20 |
Conjugate Type II
Tmax of the largest peak, Fab, had small changes. The most significant difference between the modification was the decrease in ΔH and the absence of the initial peak with a Tmax of 71.8 °C observed in both native and low (Figure 3). Differences were observed in the width of peak as it increased from Native to High, however, the FWHM values do not show this because the amplitude also decreased – this change is better quantified by the difference between Fab Tmax and Fab Tonset (Tmax-Tonset ) (Table 2). Also, there is an additional unfolding event in the modified forms that is absent in the Native. The abundance, based on the enthalpy and amplitude, of these lower stability species increases from Low to High loads and enthalpy decreased from Native to High.
Both Conjugate types were fitted with the Gaussian model in order to deconvolute and quantify the differences in enthalpy and Tmax.
Values that changed with increasing drug load are listed in the table below (Table 3).
Conjugate Type I showed a growing new peak as the number of drugs increased from Native to High and Conjugate Type II showed an opposite trend.
In Table 4 below the enthalpy is reported after fitting the values to the Gaussian model. The model also provides Tmax, FWHM, and amplitude as well as the enthalpy. The magnitude of the peak decreased as the DAR increased but the Tmax of this initial peak didn’t change.
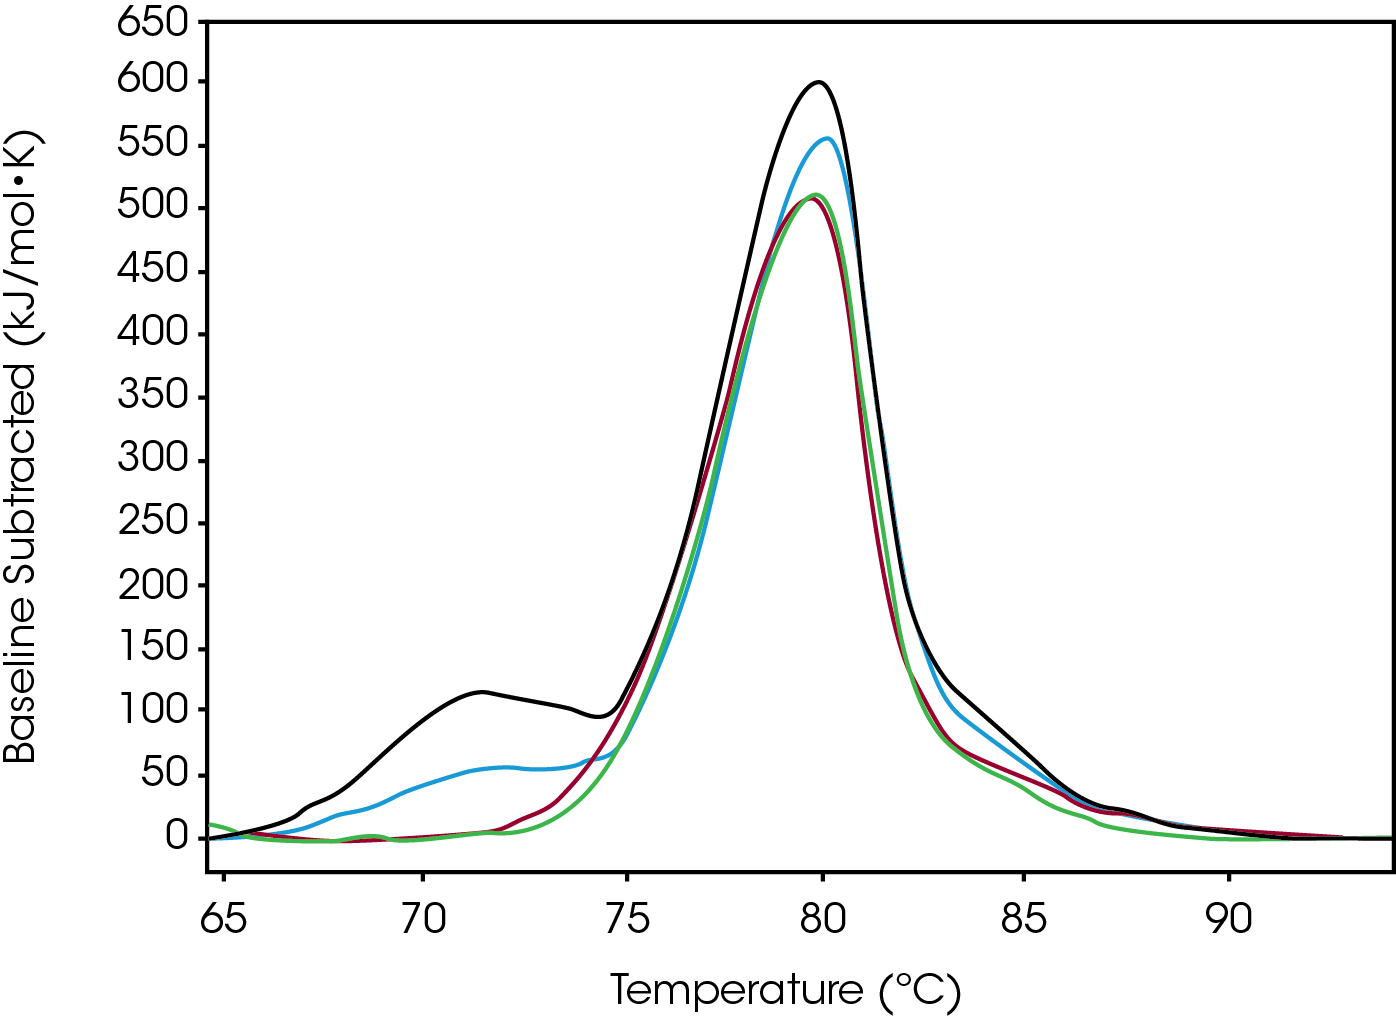
Table 2. Average values and standard deviation from two sets of Type-2 conjugated data fitted with a baseline in NanoAnalyze™. A standard deviation of less than 0.1 ºC is shown as 0.1 ºC.
| ºC | kcal/mol | |||
|---|---|---|---|---|
| Type-1 | FWHM | Tmax | Tmax – Tonset | ΔHcal Total |
| Native | 4.8 | 79.8 ± 0.1 | 4.4 | 950 ± 30 |
| Low | 4.8 | 80.1 ± 0.1 | 4.6 | 830 ± 20 |
| Moderate | 4.6 | 79.8 ± 0.1 | 4.9 | 690 ± 30 |
| High | 4.8 | 79.6 ± 0.1 | 5.3 | 650 ± 20 |
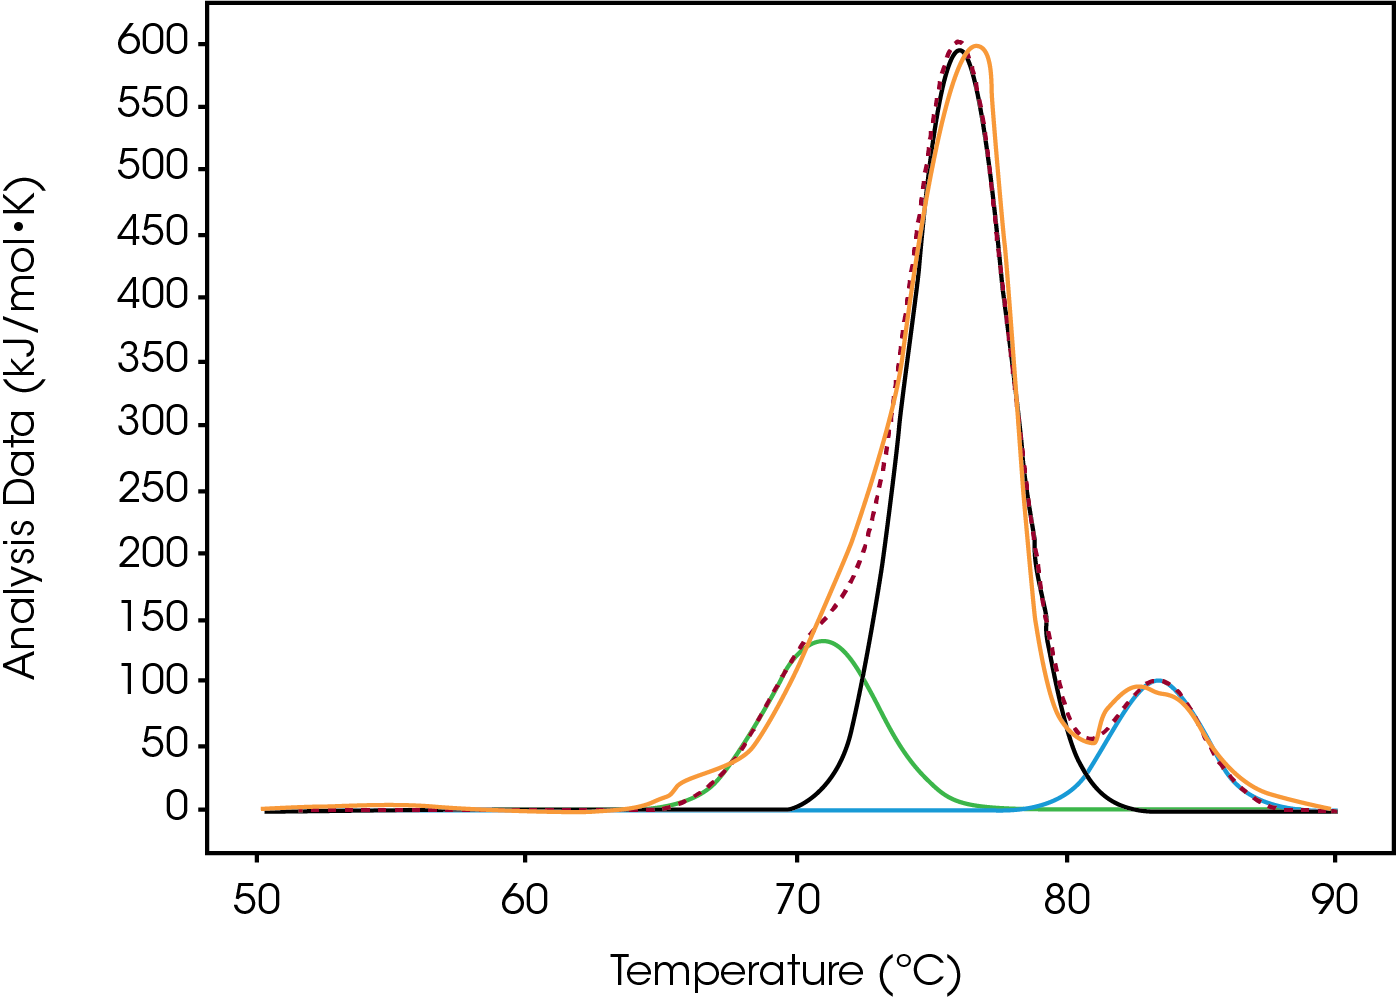
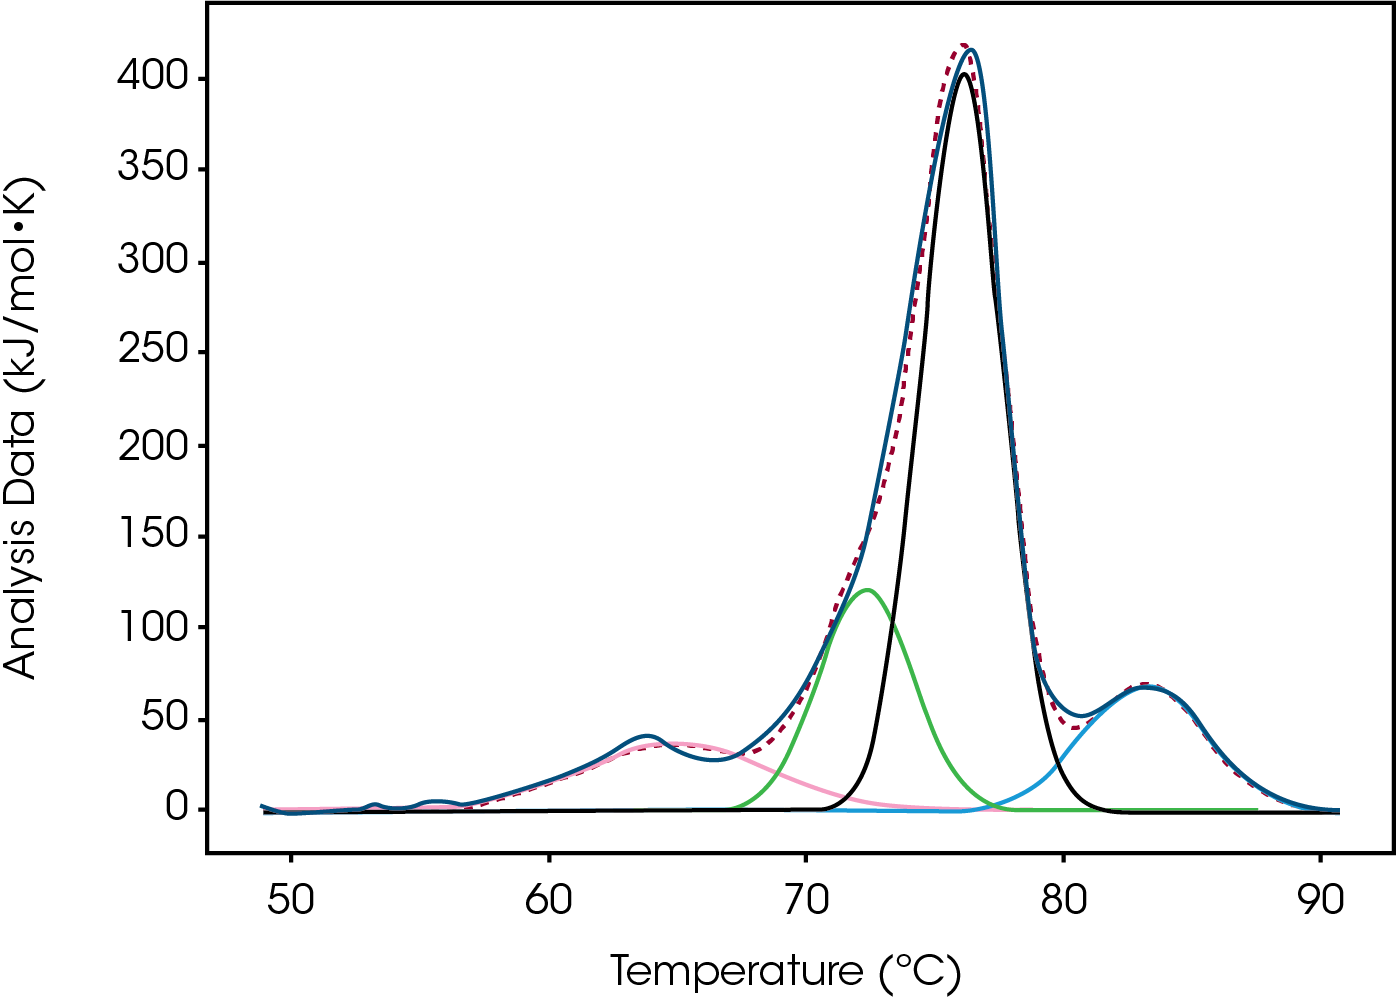
Table 3. Average fitted values for percent enthalpy of total and Peak 1 Tmax for Conjugate Type I from data fitting.
| ºC | % ΔH of total ΔH | |||
|---|---|---|---|---|
| Type-1 | Peak 1 Tmax | Peak 1 | Peak 2 +3 | Peak 4 |
| Native | N/A | N/A | 88 | 12 |
| Low | 63.2 ± 0.3 | 2 | 90 | 8 |
| Moderate | 64.5 ± 0.3 | 4 | 89 | 7 |
| High | 64.2 ± 0.2 | 9 | 77 | 15 |
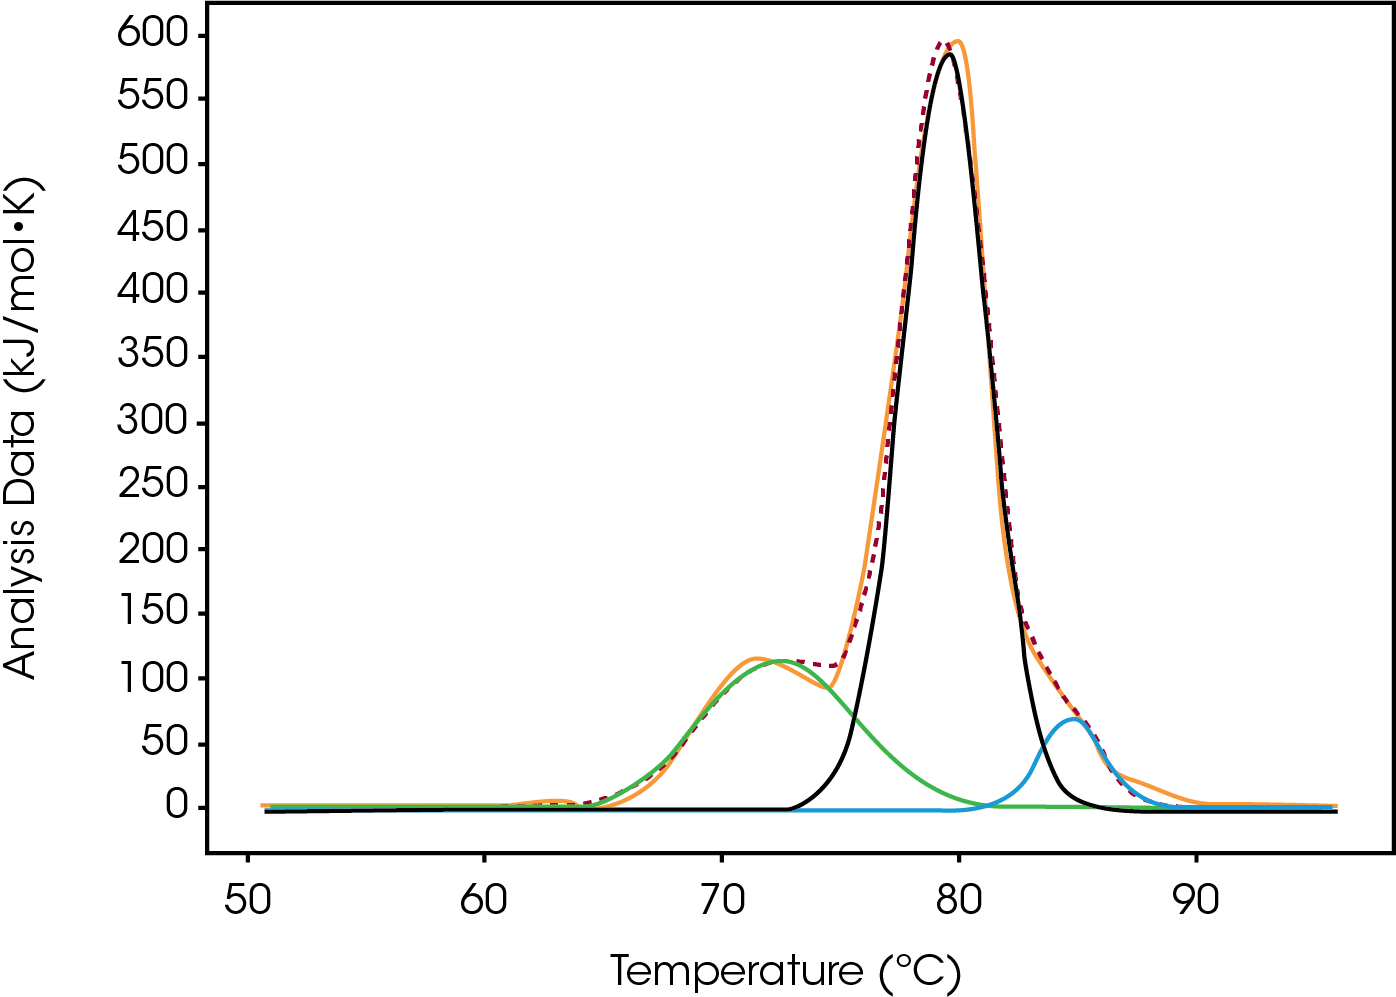
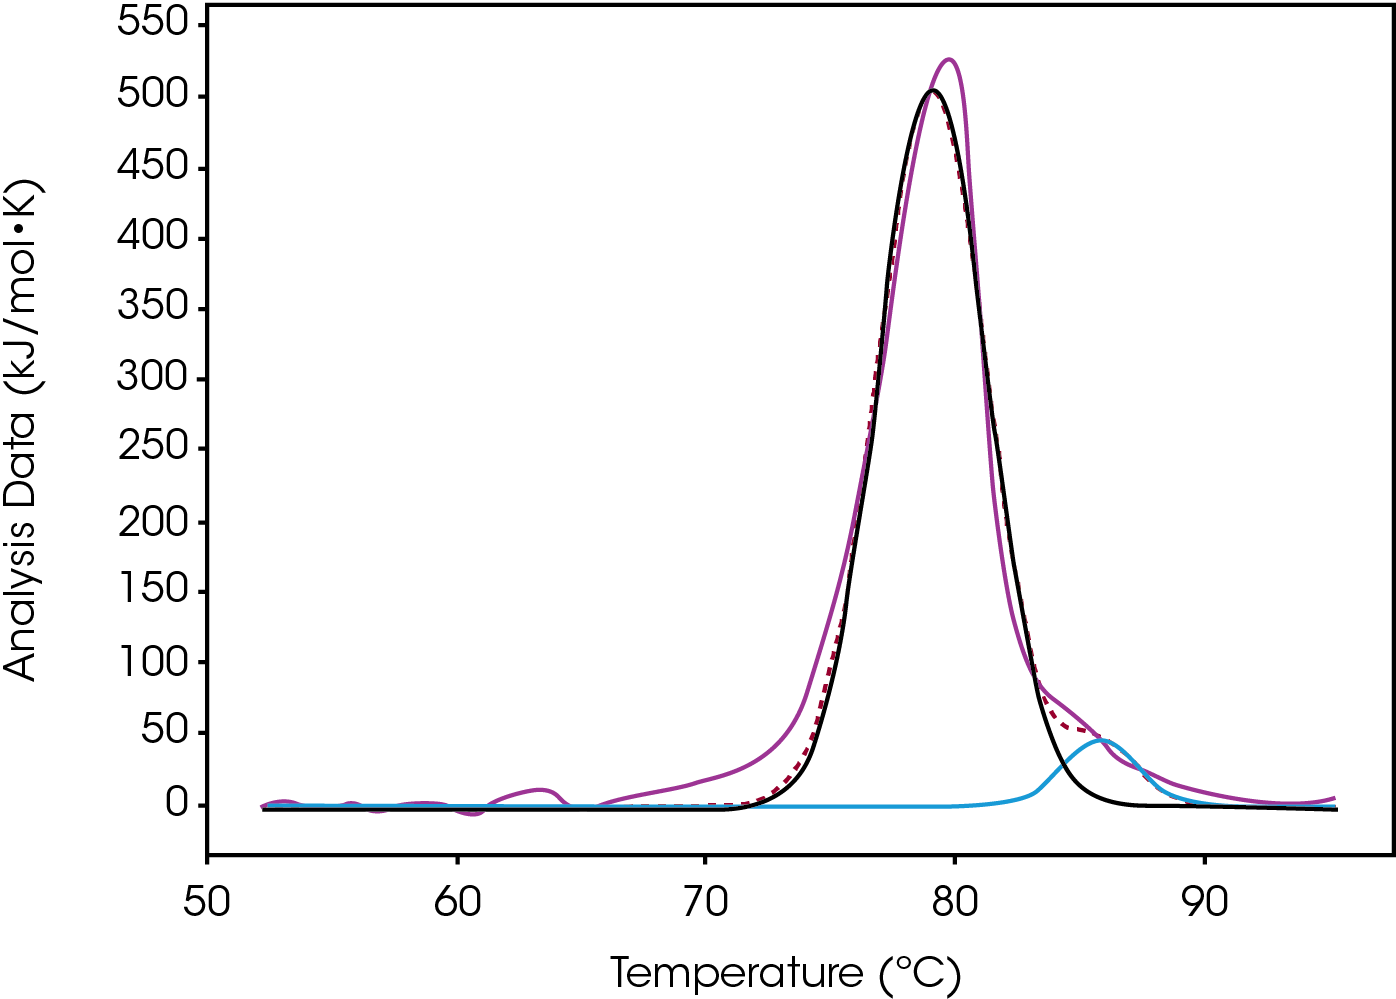
Table 4. Average fitted values for percent enthalpy of total for Conjugate Type II from data fitting.
| % ΔH of total ΔH | |||
|---|---|---|---|
| Type-1 | Peak 1 | Peak 2 | Peak 3 |
| Native | 21 | 76 | 4 |
| Low | 15 | 82 | 3 |
| Moderate | N/A | 98 | 2 |
| High | N/A | 97 | 3 |
Discussion
The first peak of an antibody thermogram is typically the CH2 domain. The largest peak is the Fab and the third is the CH3 domain [13-14]. The unfolding of the smaller domains, CH2 and CH3, are commonly observed as shoulders like the CH2 domain in Conjugate Type I and the CH3 domain in Conjugate Type II. Deconvolution of these events is desirable but as in cases like High drug load of Conjugate II, the shoulder is difficult to separate from the Fab peak. Rather than finding the mathematical solution with the best fit, simplicity, less fitting parameters, is preferred to describe the thermogram.
In Tables 3 and 4, ΔH is expressed as a percentage because it more clearly shows the differences with the payload difference. Tables 1 and 2 show a decrease in the total ΔH and could either be due to unfolding or could be related to a decrease in enthalpy as the stabilizing forces change when additional hydrophobic payloads are added. This second hypothesis is likely as hydrophobic groups can disrupt water shells that help to stabilize proteins, a percentage of the protein is degraded. Conjugate Type I shows a decrease in the overall enthalpy by 25% from Native to the Low and Moderate loads and an additional 10% decrease with the High load. Part of this decrease can also be attributed to the small hydrophobic drugs disrupting the stabilizing forces.
Conjugate Type I
For the low temperature event, likely a modified CH2 population, ΔH increases from not detectable for Native to 9% of the total enthalpy at high drug load. The magnitude of heat values trend with the quantity therefore it is reasonable to assume that the population of this less stable species increased by 9%. The presence of the peak differentiates Native from low and moderate from high loads. The temperature of the transition differentiates low from moderate. This new peak could be a new, less stable, CH2 domain population as the overall enthalpy for Peaks 2 and 3 decreases as this peak grows and peaks 2 and 3 are the CH2 and Fab contributions to this enthalpy, respectively.
Conjugate Type II
For Conjugate Type II, lack of change in the Fab domain could indicate a greater level of homogeneity in the Native sample or it could come from the stability of the low temperature species increasing and overlapping with the stability of the middle species. The enthalpy comes from the direct breaking of hydrogen bonds or electrostatic interactions. Either these bonds are not formed in the modified forms or a smaller percent of the correctly folded molecule remains after modification.
Most of the heat originates from peak 2 as ΔH increased incrementally with the extent of modification. This change occurred concurrently with an increase in the width which could indicate that the extent of Conjugate Type II modification stabilizes the CH2 domain and now its unfolding event overlaps with the Fab unfolding. Overall the addition of drugs creates a single wider unfolding event making differentiating between moderate and high difficult with only a small enthalpy decrease and a lower Tonset. The differences between Native and Low are observed as ΔH of Peak 1 (CH2) decreases with the addition of the drug and Peak 2 (Fab) increases as a population of more stable CH2 species grows. The difference between Low and Moderate is distinct because the low temperature CH2 peak is no longer present. Another key indicator for this preparation is the Tonset for the major peak incrementally decreasing as the drug load increases (Table 2).
Conclusion
Key unfolding parameters such as ΔH, Tonset, and Tmax were quantitative indicators of the amount of drug loaded. Conjugate Type I showed the marked difference from native to low and then again from moderate to high drug loads with the appearance and subsequent growth of a low temperature peak. Conversely, Conjugate Type II showed a reduction in both enthalpy and amplitude of the lower temperature peak as the drugload increased with the largest change in the thermogram between low and moderate loads. Both Conjugate types had a decrease in total enthalpy and in order to normalize for concentration effects the percent enthalpy was presented to show the trend for growth or retraction as well as the overall consistency for the enthalpy of the Fab peak. Ultimately calorimetry provided a direct qualitative and quantitative assessment of biopharmaceuticals including differentiation between Conjugate types and drug-to-antibody ratios.
References
- Ducry, L. and Stump, B. Antibody-Drug Conjugates: Linking Cytotoxic Payloads to Monoclonal Antibodies. Bioconjugate Chem. 2010, 21, 5-13.
- Alzari, P.M., Lascombe, M.B. and Poljak, R.J. Annu. Rev. Immunol., 1988, 6,555-580.
- Wang, W., Singh, S., Zeng, D., King, K., Nema, S. Antibody Structure, Instability, and Formulation. Journal of Pharmaceutical Sciences, 2007, 96(1), 1-26.
- Wu, S-J., Luo, J., O’Neil. K., Kang, J., Lacy, E., Canziani, G., Baker, A., 1, Maggie Huang, M., Tang, Q., Raju T., Jacobs, S., Teplyakov, A., Gilliland, G., Feng, Y., Structure-based engineering of a monoclonal antibody for improved solubility. Protein Engineering, Design & Selection, 2010, 23(8), 643–651.
- Christ, D., Famm, K. and Winter, G. Repertoires of Aggregation-Resistant Human Antibody Domains. Protein Eng. Des. Sel., 2007, 20, 413–416.
- Ewert, S., Huber, T., Honegger, A. and Pluckthun, A. Biophysical Properties of Human Antibody Variable Domains. J. Mol. Biol., 2003, 325,531–553.
- Hmila, I., Abdallah, R.B., Saerens, D., Benlasfar, Z., Conrath, K., Ayeb, M.E., Muyldermans, S. and Bouhaouala-Zahar, B. VHH, bivalent domains and chimeric Heavy chain-only antibodies with high neutralizing efficacy for scorpion toxin AahI’ Mol. Immunol., 2008, 45,3847–3856.
- Jespers, L., Schon, O., Famm, K. and Winter, G. Aggregation-resistant Domain Antibodies Selected on Phage by Heat Denaturation. Nature Biotechnol., 2004, 22,1161–1165.
- Cooper, A. Heat capacity of hydrogen-bonded networks: an alternative view of protein folding thermodynamics, Biophys. Chem. 2000, 85, 25-39.
- Cooper, A., M. A. Nutley, M.A., Wadood, A. Differential scanning microcalorimetry in Harding, S.E. and Chowdhry, B. (Eds.), Protein-Ligand Interactions: hydrodynamics and calorimetry. Oxford University Press, Oxford New York, 2000, 287-318.
- Choma, C. Characterizing Protein Stability by DSC. M130 Application note. Available at www.tainstruments.com
- Johnson, C. Differential Scanning Calorimetry as a Tool for Protein Folding and Stability. Archives of Biochemistry and Biophysics, 2013, 531, 100-109.
- Garber, E. and Demarest, S.J. A Broad Range of Fab Stabilities within a Host of Therapeutic IgGs. Biochem. Biophys. Res. Commun., 2007, 355, 751–757.
- Ionsecu, R., Vlasak, J.; Price, C., Kirchmeier, M. Contribution of Variable Domains to the Stability of Humanized IgG1 Monoclonal Antibodies. Journal of Pharmaceutical Sciences, 2008, 97(4), 1414-1426
Acknowledgement
This note was written by Colette Quinn (TA Instruments). We would like to thank Weibin Chen and Henry Shion (Waters) for their contributions in discussion and Pfizer for supplying all antibody-drug conjugate and antibody samples.
Click here to download the printable version of this application note.

