Keywords: graphite, battery, TGA, anode
TA470
Abstract
Graphite, whether natural or synthetic, is the most common material used for lithium-ion battery anodes. The type, purity, shape, and size of graphite particles will strongly influence battery performance and cycle life. Thermogravimetric analysis (TGA) can be used to measure decomposition of graphite and characterize it with regards to particle size, uniformity, and purity. Analysis of industrial graphite samples shows that decomposition temperatures are dependent on particle size. This work shows that in addition to understanding thermal properties of graphite, TGA can be used for quality control and to complement other techniques such as particle size analysis.
Introduction
Anodes in current lithium-ion batteries (LIB) are typically made by depositing graphite on a copper current collector. Both synthetic and natural graphite may be used, with synthetic being more expensive but providing higher purity and more predictable cycling behavior when compared to natural graphite. [1]. A graphite slurry is deposited onto copper foil and then dried, leaving behind a coating of graphite particles, binder, and other additives. The graphite particles will have a specific size distribution that can influence coating quality. The nature of this coating can impact performance characteristics of LIBs, such as capacity and cycle life [1] [2] [3]. Currently, particle sizes between 8 to 30 µm appear ideal as this leads to increased packing density, which in turn effects the volumetric capacity [1].
Thermogravimetric analysis (TGA) can be used to investigate the impact of particle size on degradation [4]. It has also been used to discriminate between various forms of graphite (graphite, graphene, and graphene oxide) and thus characterize the purity and uniformity of samples [5]. TGA is a thermal analysis technique that measures weight changes in a sample subjected to a heating program in a furnace. It is a straightforward and reliable analytical tool that is used in both quality control and research settings. One of the mechanisms of weight change is sample decomposition. Due to the kinetic nature of decomposition, the temperature at which weight changes occur is sensitive to numerous parameters including temperature ramp rate, sample mass, sample morphology, and particle size.
In this note, TGA will be performed on natural and synthetic graphite of various particle sizes. The analysis will provide information that would find value in quality control settings, such as batch consistency and impurities.
Application Benefits
- TGA decomposition temperatures are very sensitive to particle size thereby providing a complement and, in some cases, an enhancement to standard particle size distribution measurements.
- Structure in the TGA decomposition profile may indicate the presence of different types of graphite and/or impurities that may not be detected in standard particle size distribution measurements.
- TGA residue measurements provide an easy screening parameter for the presence of thermally inert inorganic impurities.
Experimental
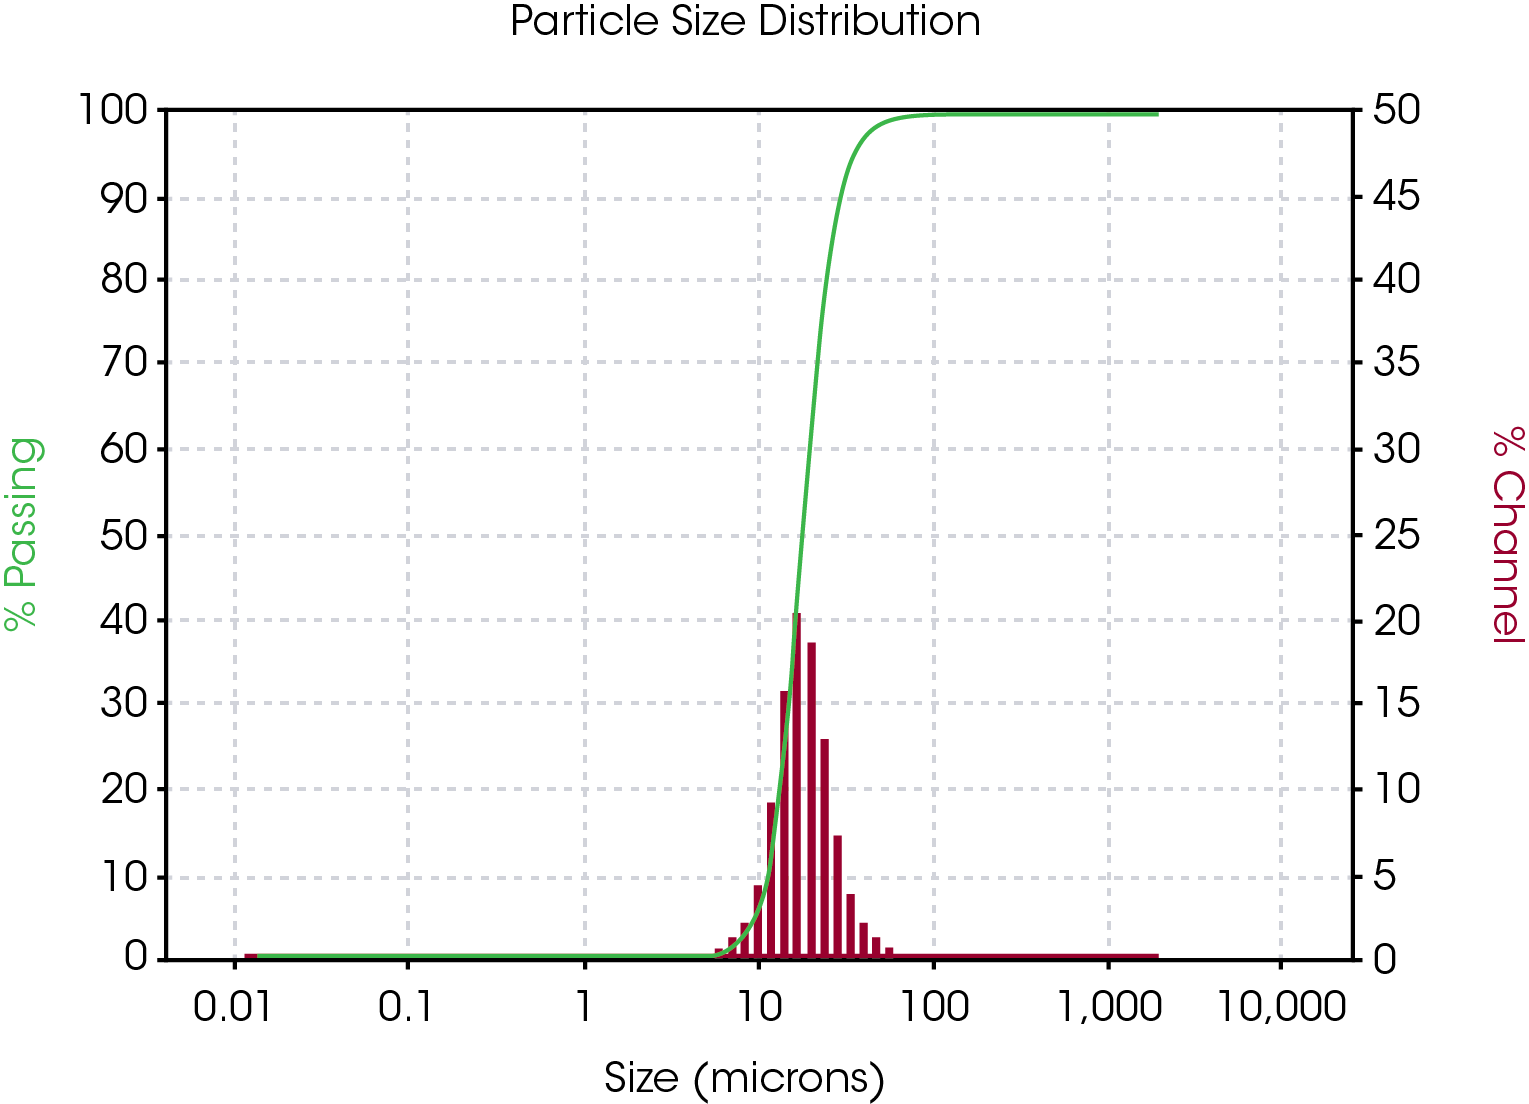
Powdered graphite samples were obtained from NEI Corporation. Three samples of natural graphite, manufactured by a uniform process, were obtained, and are referred to as ‘NEI 01’, ‘NEI 02’, and ‘NEI 03’. One synthetic sample, referred to as “NEI Synthetic’, was also provided. NEI performed particle size analysis on each sample using a laser diffraction particle size analyzer from Microtrac MRB. Average particle sizes ranged from approximately 7.5 to 25 µm and a typical particle size distribution (PSD) result is shown in Figure 1. The green curve represents the total percentage of the powder that would pass through a hypothetical sieve of mesh size indicated. The red histogram indicates what percentage of particles span a size that is the width of the histogram bar.
TA Instruments Discovery 5500 was used to perform TGA experiments. TGA runs were performed in triplicate at 10 °C/min from room temperature to 1000 °C in an air purge and 100 µl platinum pans. Sample masses were approximately 20 mg and tightly controlled within 0.4%.
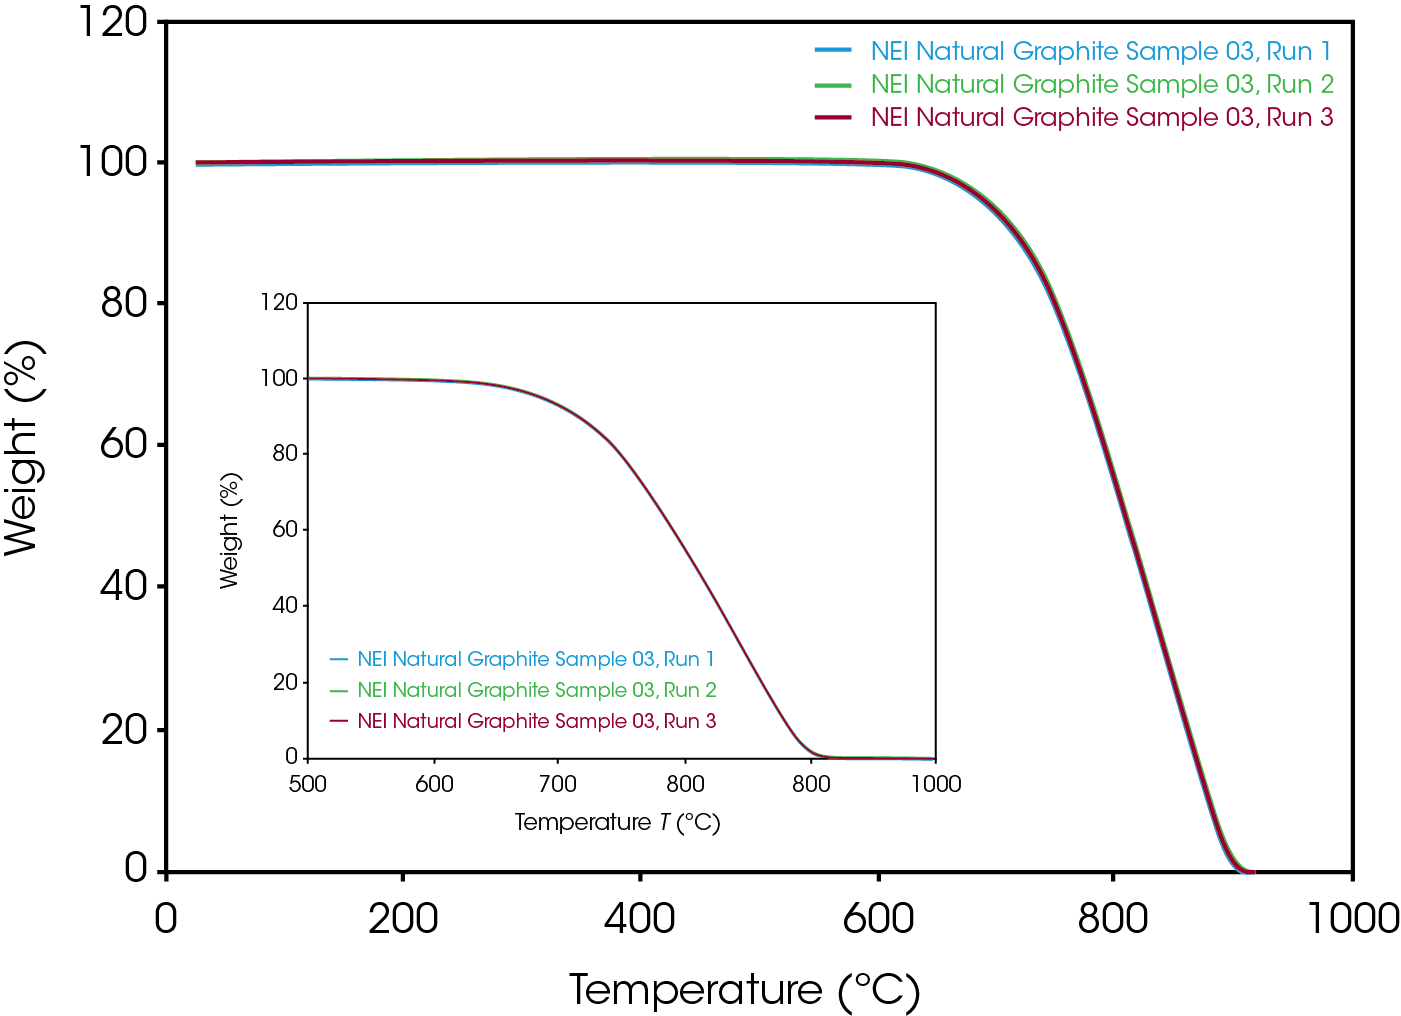
The tight sample mass control ensures that the cause of TGA curve shift is not due to any sample mass variation. It also greatly enhances the run-to-run reproducibility for each individual sample, as shown in Figure 2. The single weight loss event captured in Figure 2 is due to the combustion of carbon in the air purge. All samples decomposed to zero percent weight in a single weight step with no residue, indicating uniformity and purity of the samples, respectively. Published work has shown how graphite, graphene, and graphene oxide decompose in different temperature regimes and with different numbers of weight loss events (for graphite oxide) and how this is important from a quality control perspective [5]. Similarly, the absolute stability of the weight signal shown in Figure 2 up to the onset of decomposition, and the absence of structure in the derivative signal (not shown), both support the conclusion of a uniform sample composition. Detection of any residue can be used as a measure of sample purity, a quality control parameter also of high importance to battery manufacturers.
Results and Discussion
Natural Graphite
An overlay of the PSD curves for the three NEI natural graphite samples is shown in Figure 3. There is significant overlap of the distributions, and the coarseness of the data makes it difficult to produce a clean separation of these three samples.
However, the measured D50 value, which is the median diameter or average particles size, in microns, is also contained in the particle size data report. Values of D50 for the samples are shown in Table 1, with Sample 02 being the smallest and Sample 03 being the largest.
Table 1. D50, median diameter, of NEI graphite samples
| Sample | D50 (µm) |
|---|---|
| NEI 01 | 15.95 |
| NEI 02 | 14.11 |
| NEI 03 | 17.97 |
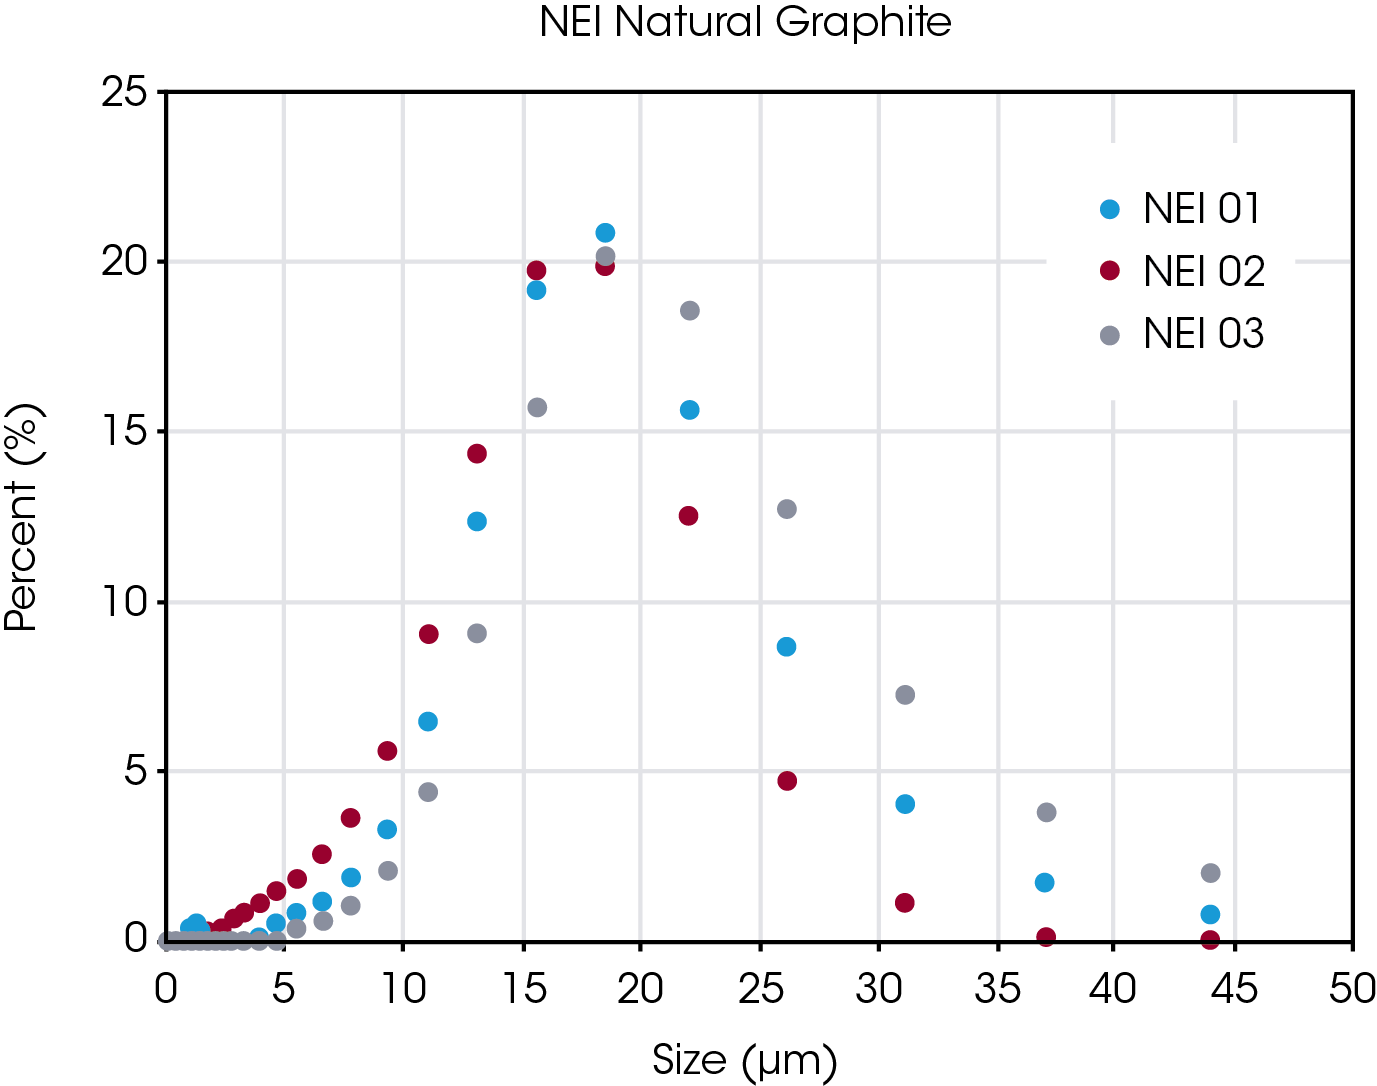
Figure 4 is a plot of the TGA results for the three NEI samples, with all samples decomposing to zero weight percent in a single step. In contrast to the measured particle size data, the measured TGA data shows a very clear separation between each sample. The TGA ordering of the samples agrees with the ordering from the PSD, with the smallest D50 sample decomposing at the lowest temperature and the larger D50 samples requiring higher temperatures to decompose. The TGA data thus supports the D50 values from the PSD. Complementary data such as this gives confidence that there are minor particle size differences between these three graphite samples.
There are several ways to quantify the observed separation. A typical way in TGA is to plot the derivative of the weight loss curves versus temperature and measure the temperature of the peak maximum. A different way to assess the data is to measure the temperature at which a particular weight loss is attained. The data was analyzed in this way for two percentages: where the sample had lost 15% weight (T15), and where it had lost 50% weight (T50). The T15 analysis has been used by other researchers as a quantifiable data point on a TGA curve [4]. Figure 5 illustrates each of these measures for a decomposition curve.
Tabulated results and statistics for all three analysis methods are presented in Table 2 for the data in Figure 4. It is seen from this data that both the T15 and the T50 analyses provide better statistical results than the derivative. The TGA data clearly show the impact of particle size on decomposition parameters, in agreement with results from other researchers [4] [5]. It also shows that very fine differences can be delineated between samples, with both the T15 and T50 sample measures separated by more than two standard deviations.
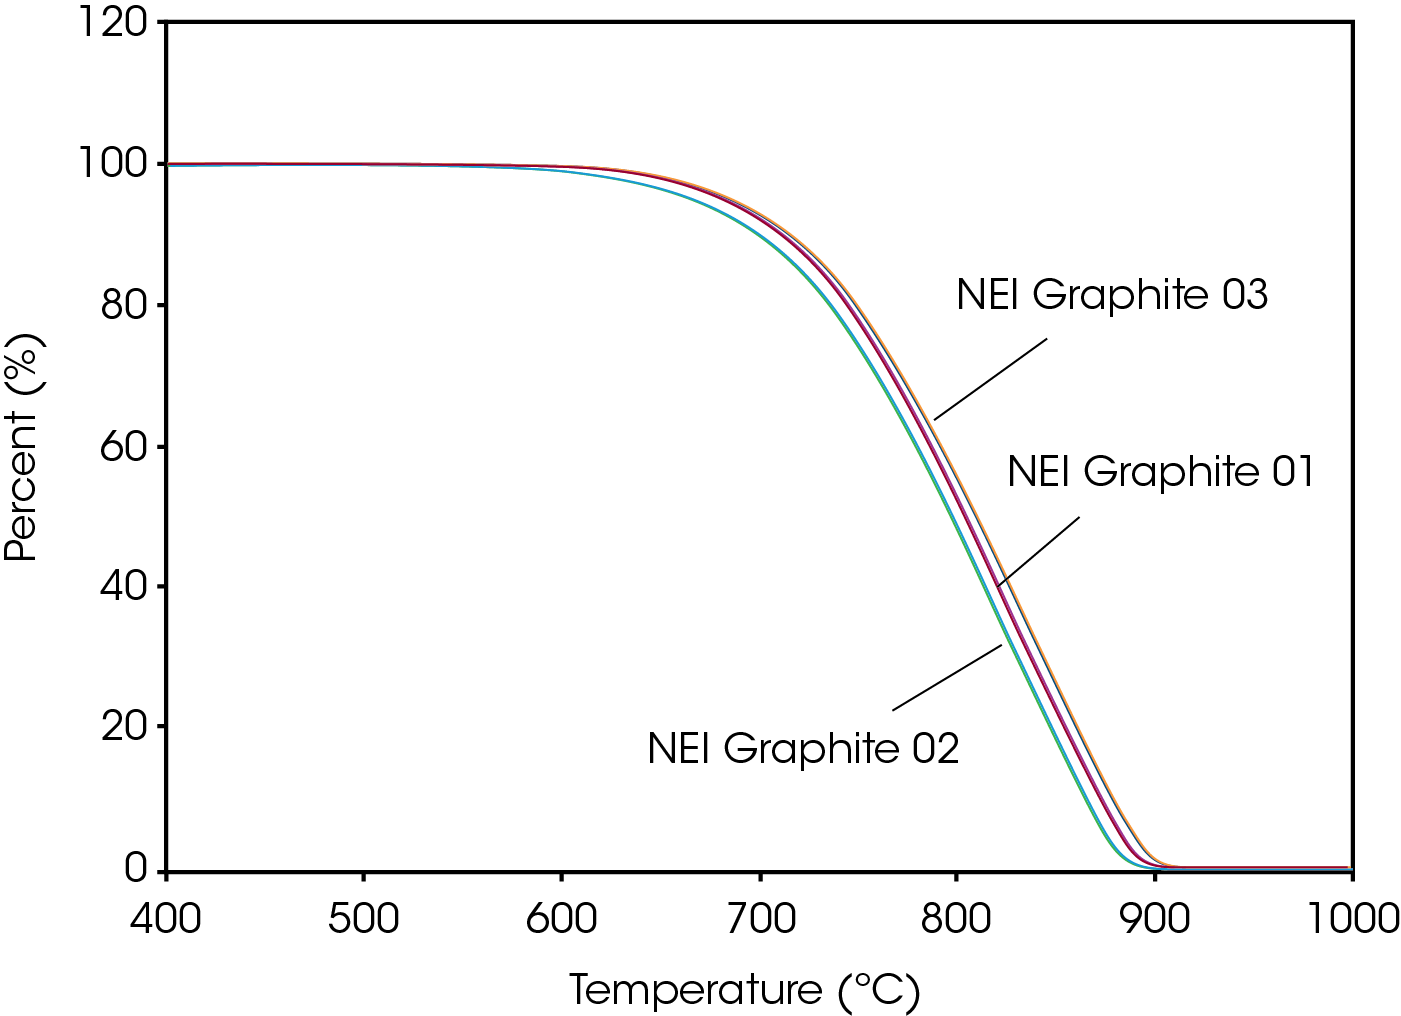
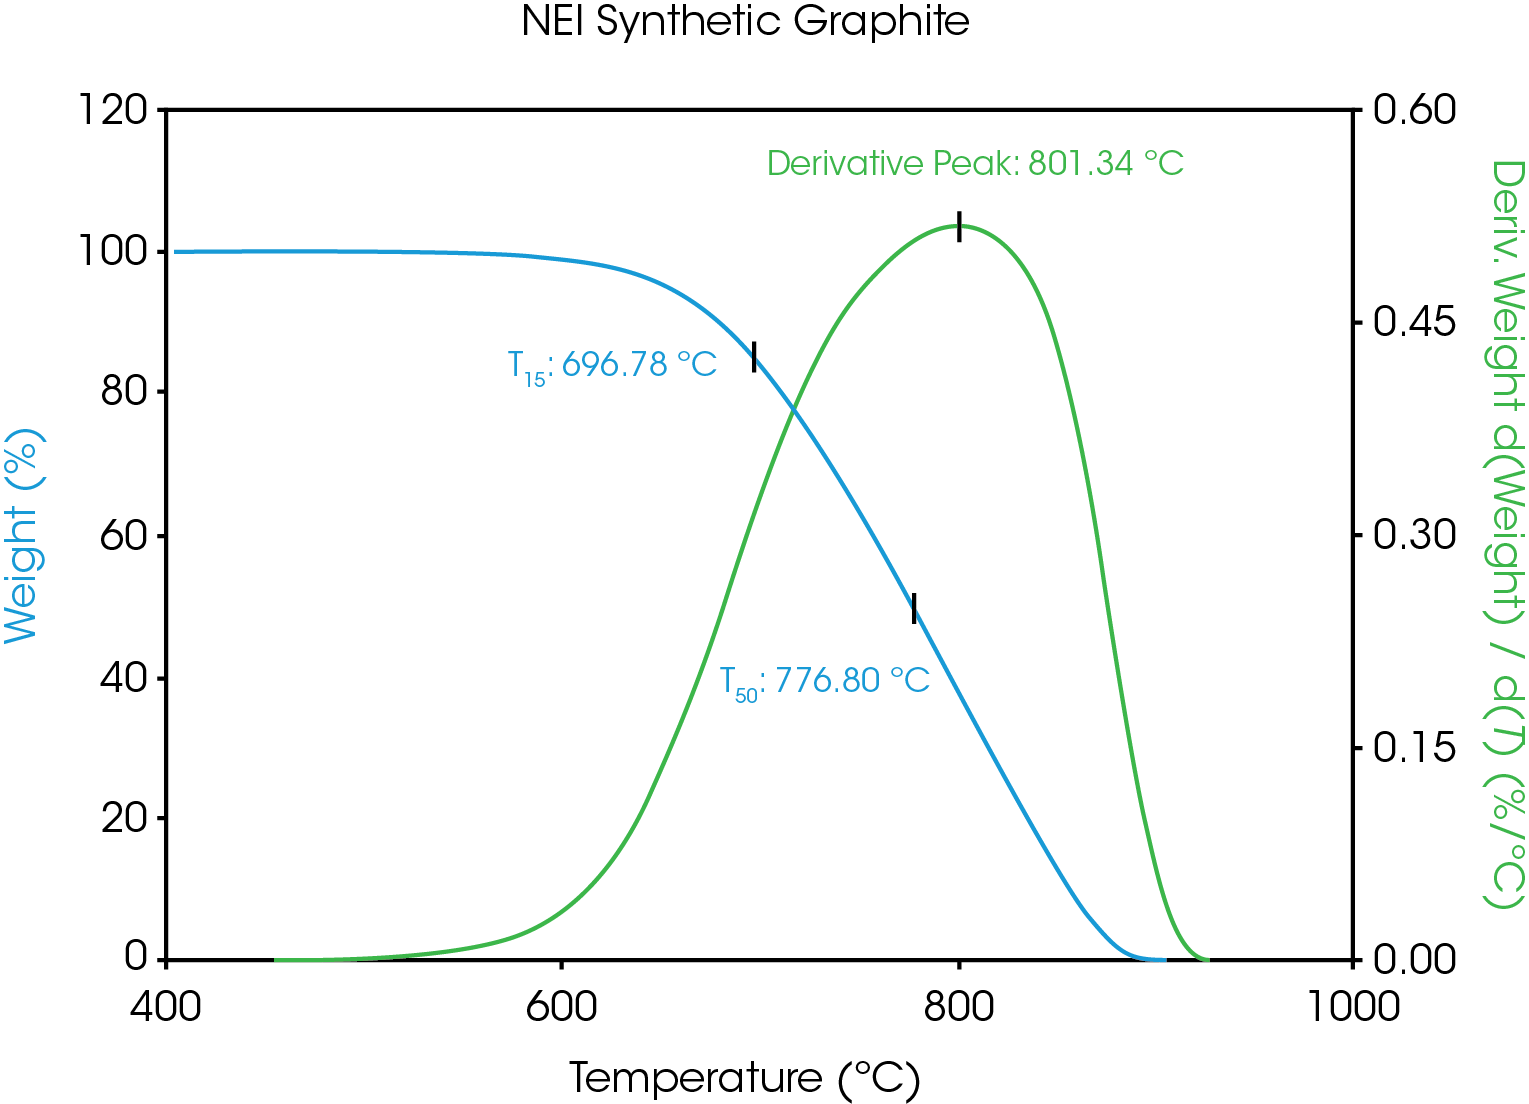
Table 2. Summary statistical results for analysis of the NEI Natural graphite TGA curves by the derivative peak temperature, the 15% weight loss point and the 50% weight loss point.
| Sample | Deriv Peak Avg (°C) | Stnd Dev (°C) | T15Avg (°C) | Stnd Dev (°C) | T50 Avg (°C) | Stnd Dev (°C) |
|---|---|---|---|---|---|---|
| NEI 03 | 829.66 | 0.53 | 734.30 | 0.27 | 809.06 | 0.24 |
| NEI 01 | 826.05 | 2.69 | 729.87 | 0.30 | 803.90 | 0.79 |
| NEI 02 | 822.54 | 0.69 | 720.92 | 0.22 | 797.13 | 0.22 |
Synthetic Graphite
The PSD data from the NEI synthetic sample as compared to NEI 03 natural graphite is shown in Figure 6. The reported D50 value for the synthetic sample is shown in Table 3. The value is almost identical to that of NEI 03, which was 17.97. Other measures such as Mv, the mean diameter of the volume distribution, are also very close (20.33 µm versus 19.68 µm).
Despite the similar particle size, the TGA data shows a clear difference between these two samples, as shown in Figure 7. The corresponding derivative peak, T15 and T50 results are shown in Table 4. The shifts in decomposition temperatures, along with the excellent reproducibility of the data, indicate that TGA could be useful in characterizing different grades of graphite samples.
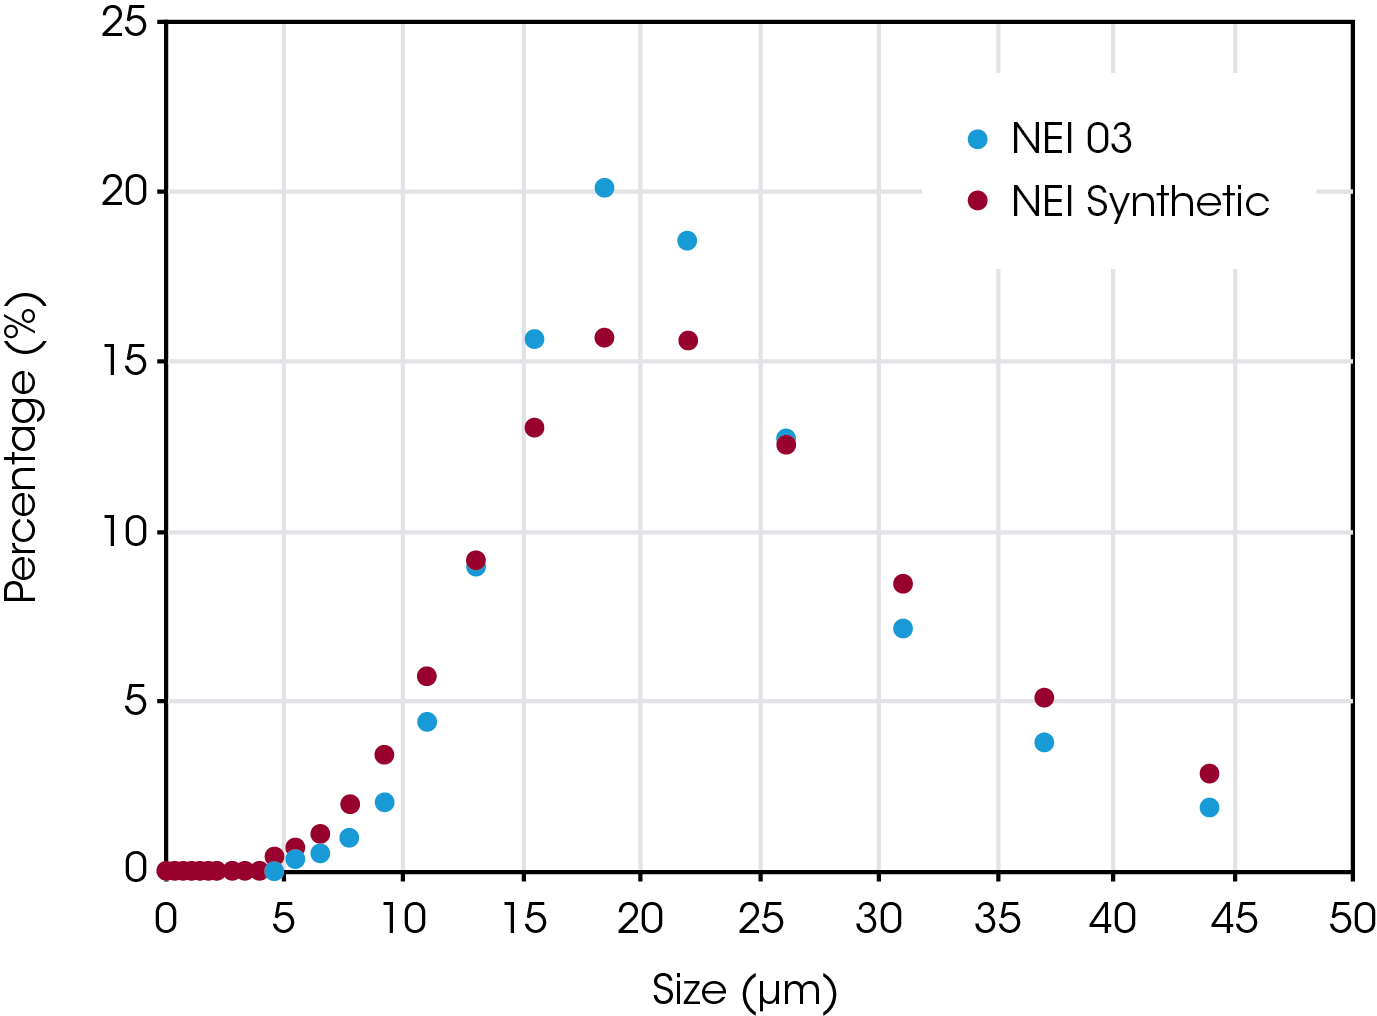
Table 3. Comparison of D50 for NEI Synthetic and NEI 03 graphite samples
| Sample | D50 (µm) |
|---|---|
| NEI Synthetic | 18.20 |
| NEI 03 | 17.97 |
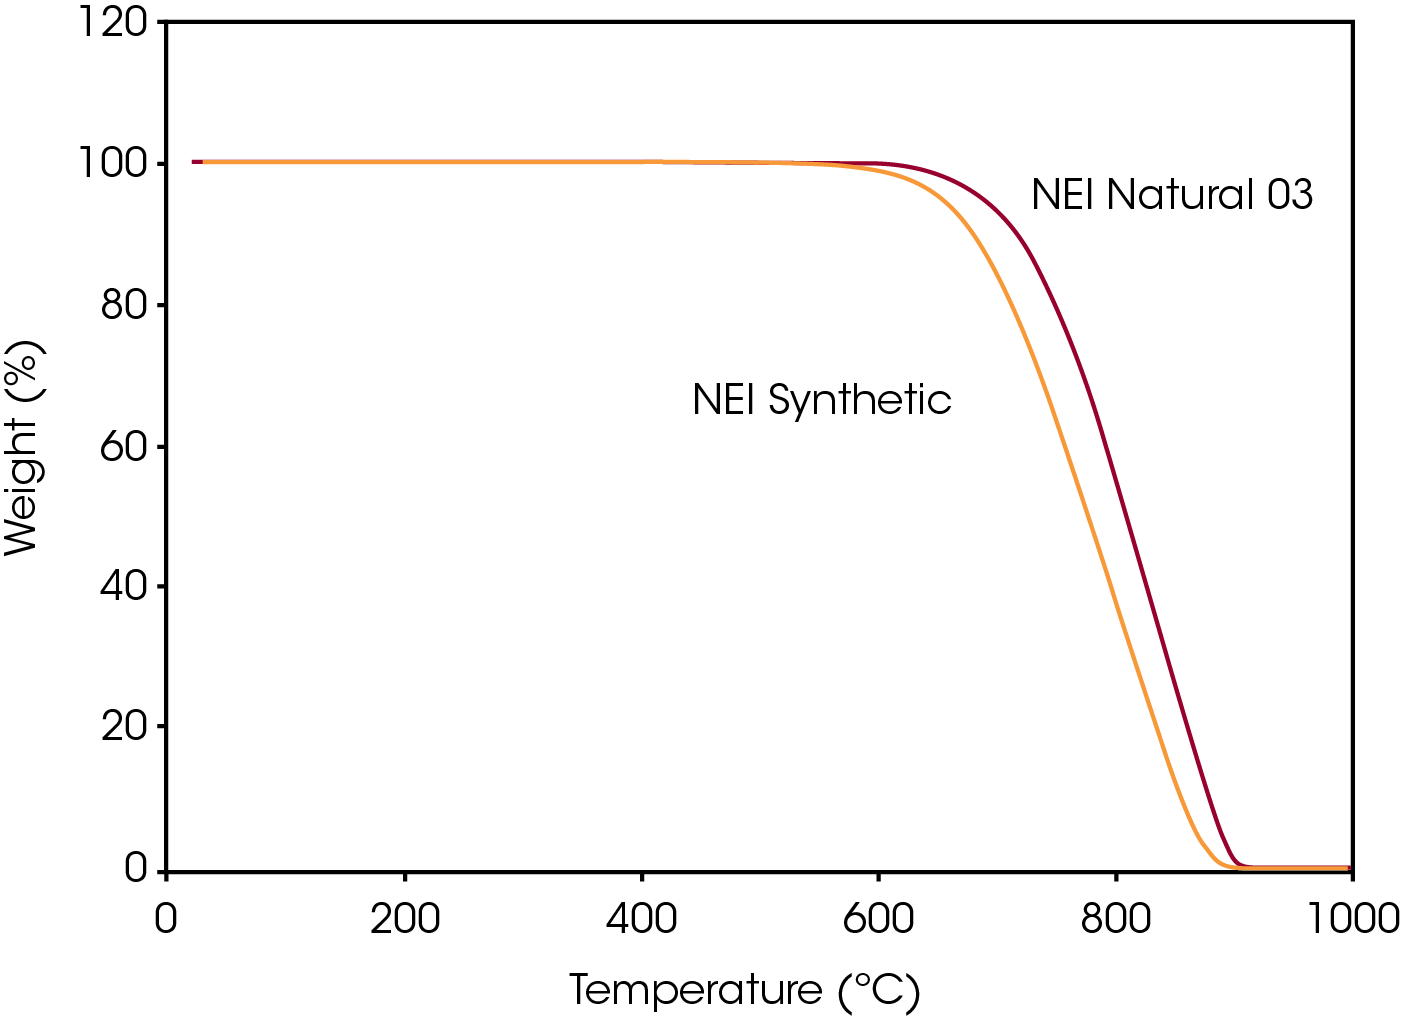
Table 4. Summary statistical results for analysis of the NEI Synthetic graphite TGA curves by the derivative peak temperature, the 15% weight loss point and the 50% weight loss point.
| Sample | Deriv Peak Avg (°C) | Stnd Dev (°C) | T15 Avg (°C) | Stnd Dev (°C) | T50 Avg (°C) | Stnd Dev (°C) |
|---|---|---|---|---|---|---|
| NEI Syn | 805.84 | 0.62 | 697.39 | 0.67 | 777.15 | 0.48 |
Natural versus Synthetic Graphite
In addition to using TGA to complement or, in some cases, clarify, particle size data, it can also be used to examine correlations between PDS properties such as D50, and the T15 and T50 temperatures [4]. Jiang et al. [4] and Farivar et al [5], plotted values of T15 and the derivative peak respectively versus average particle size. It is instructive to construct similar plots and compare trends between natural and synthetic samples.
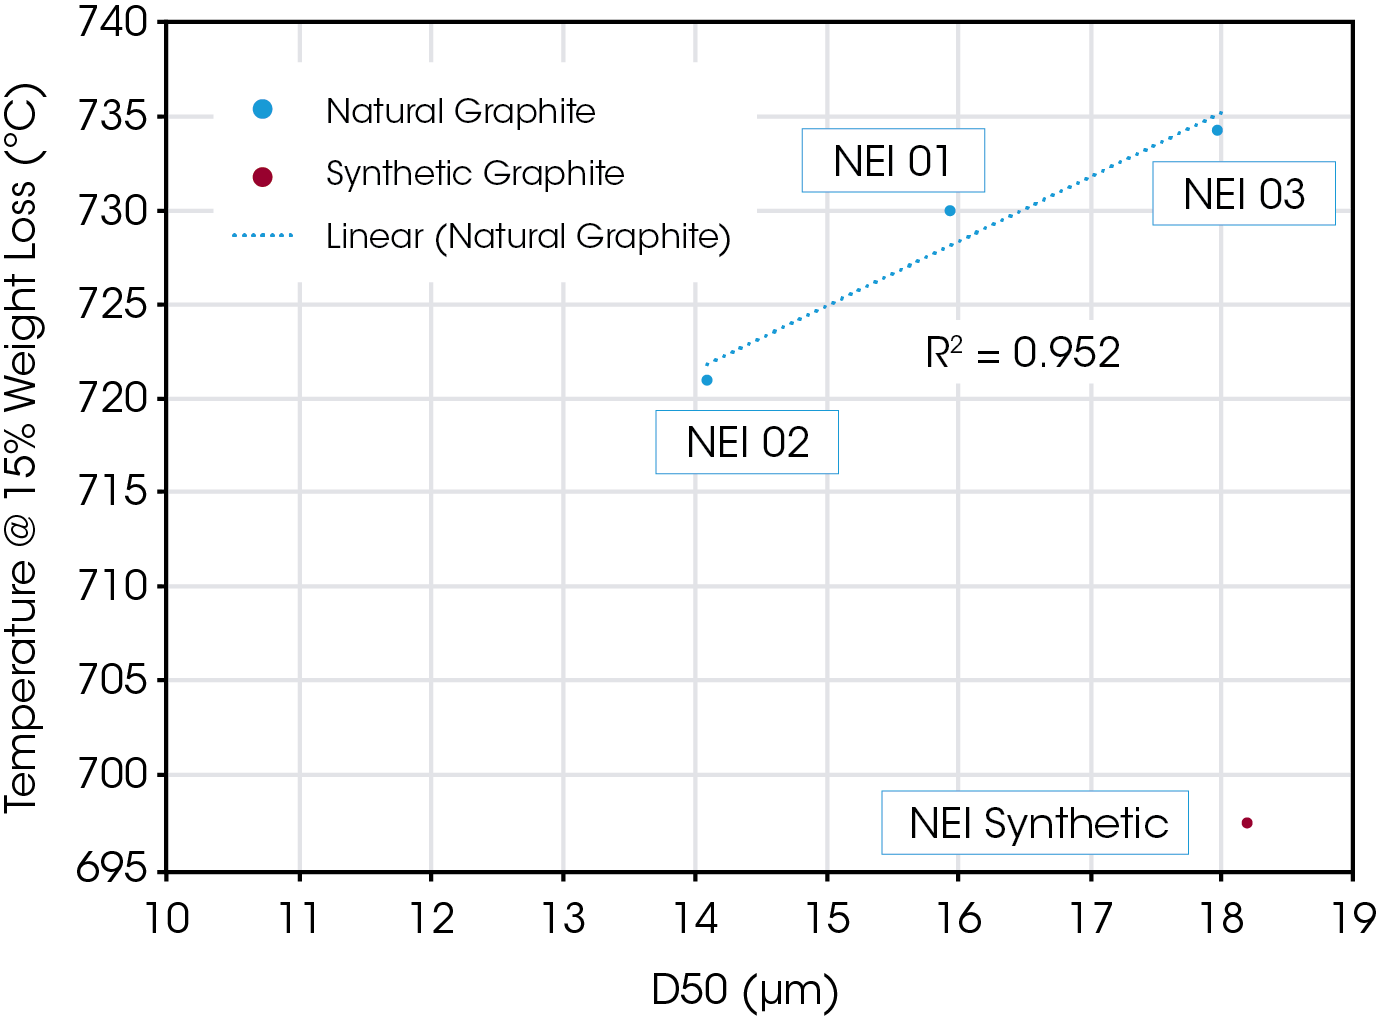
Figure 8 shows a plot of the measured T15 versus D50 for the four samples discussed. It is important to note that a plot such as this would be associated only with a particular mass of sample, since changes in mass can shift the degradation temperature. The natural samples show a very linear relation to particle size as has been observed by other researchers [5], while the synthetic sample does not fit with the calculated trend line.
Morphological differences exist between natural and synthetic types of graphite [1], and morphology and crystalline structure may also be a parameter that impacts degradation temperature [6]. While not known with certainty, it would not be unexpected that sample morphology and/or crystalline structure underlies the observed synthetic offset. Large deviation from a linear relation between particle size and degradation temperature can highlight samples that require further scrutiny. When generated with care, these curves can be helpful tools for correlating graphite characteristics to electrochemical performance for battery applications.
Conclusions
Thermogravimetric measurements of both natural and synthetic graphite were performed. Measurements on natural graphite indicate that the weight loss data is sensitive to particle size, in agreement with previously published data. The derivative peak, the temperature at 15% (T15) weight loss, and at 50% (T50) weight loss all track with particle size. When combined, the TGA data can both complement and clarify particle size data.
The synthetic sample was seen to degrade at a lower temperature than a natural one of very similar particle size. It also did not fit within the linear progression shown by the three natural samples, potentially due to morphology and crystalline structure. Natural and synthetic graphite have inherent differences in both morphology and crystalline structure obtained from their respective manufacturing processes. Particle size analysis may not be able to expose these differences. Thermogravimetric analyzers find use in both quality control and analytical research settings where powdered graphite is used, including the important field of battery research, providing information on sample uniformity and purity. It is a quick, reliable, and simple analytical technique for the characterization of graphitic materials.
References
- J. Asenbauer, T. Eisenmann, M. Kuenzel, A. Kazzazi, Z. Chen and D. Bresser, “The success story of graphite as a lithium-ion anode material- fundamentals, remaining challenges, and recent developments including silicon (oxide) composites,” Sustainable Energy & Fuels, vol. 4, no. 5387, 2020.
- C. Mao, M. Wood, L. David, J. An, Y. Sheng, Z. Du, H. M. Meyer III, R. E. Ruther and D. L. Wood III, “Selecting the Best Graphite for Long-Life, High-Energy, Li-Ion Batteries,” Journal of The Electrochemical Society, vol. 165, no. 9, pp. A1837-A1845, 2018.
- F. Roder, S. Sonntag, D. Schroder and U. Krewer, “Simulating the Impact of Particle Size Distribution on the Performance of Graphite Electrodes in Lithium-Ion Batteries,” Energy Technology, pp. 1588-1597, 2016.
- W. Jiang, G. Nadeau, K. Zaghib and K. Kinoshita, “Thermal analysis of the oxidation of natural graphite- effect of particle size,” Thermochimica Acta, vol. 351, pp. 85-93, 2000.
- F. Farivar, P. L. Yap, R. U. Karunagaran and D. Losic, “Thermogravimetric Analysis (TGA) of Graphene Materials: Effect of Particle Size of Graphene, Graphene Oxide and Graphite on Thermal Parameters,” Journal of Carbon Research, vol. 7, p. 12, 2021.
- T. J. Neubert, J. Royal and A. R. Van Dyken, “The Structure and Properties of Artificial and Natural Graphite,” 1955.
Acknowledgement
This paper was written by Gray Slough, PhD, Principal Applications Scientist at TA Instruments.
We gratefully acknowledge NEI Corporation for providing the graphite samples and the particle size distribution measurements on all samples.
Click here to download the printable version of this application note.

