Keywords: decomposition, degradation, kinetics, TGA, 3D printing, recycled materials, PET
TA475
Abstract
The use of recycled polymer materials is increasing, with manufacturers exploring the option of using recycled feedstock in place of virgin polymer material. Characterizing the recycled polymer and comparing its properties to virgin material is an important step in ensuring the substitution doesn’t impact performance. Understanding the material’s lifetime before failure can help prevent premature failure and can be predicted through thermogravimetric analysis. This note investigates the degradation kinetics of virgin and recycled polyethylene terephthalate fibers used for 3D printing through TGA, finding similar lifetime predictions for the samples studied.
Introduction
The persistence of plastics in the environment has led consumers, governments, and companies to push for more sustainable and renewable options. Polyethylene terephthalate (PET) is one of the most commonly utilized polymers, used for plastic bottles and packaging in a variety of industries. Due to its widespread use, PET is one of the most abundant polymers in waste streams; fortunately, it is also one of the most readily recycled polymers [1]. Recycling of polymers can be complex, with primary, secondary, and tertiary methods used. Primary recycling occurs when uncontaminated, discarded polymer is reused. Secondary recycling, or mechanical recycling, involves physically reprocessing the material but retaining the chemical backbone of the polymer. Tertiary recycling is commonly referred to as chemical recycling and utilizes chemical processing such as pyrolysis or hydrolysis to break down the polymer [2] [3].
Of these, mechanical recycling is the most frequently employed, although there are limitations and concerns due to the eventual breakdown of the polymer and potential negative impacts on properties [3]. When using recycled PET (rPET) feedstock, it is important to understand the properties and performance of the material. Previous work has included characterizing rPET for honeycomb structures and investigating the use of rheology measurements in determining melt stability and optimizing processing conditioning of recycled PET feedstock [4] [5]. Another important aspect of working with rPET is its degradation kinetics and how they compare to virgin, unrecycled PET. Thermogravimetric analysis (TGA) offers an efficient alternative to oven aging for degradation studies. TGA measures the weight changes of a material as a function of temperature while being heated at different rates through decomposition. The data can then be used to estimate the expected lifetime of the material, as well as offer insight into the degradation kinetics [6].
Experimental
This work investigated and compared the degradation kinetics of PET and rPET filaments used for 3D printing. Commercially obtained samples produced by the same manufacturer were used. The degradation kinetic parameters, activation energy, and expected lifetime were determined using TGA by the Flynn/Wall/Ozawa isoconversional method described by ASTM E1641 [7].
In TGA kinetic analysis, the conversion (a) of a sample is the ratio of actual mass loss to total mass loss of a degradation process and is calculated using Equation 1.

Where:
- W = sample weight at any point during the degradation
- Wi = initial weight
- Wf = final weight
The conversion level can be different than the percent weight loss of a sample run in TGA if there is residue from nonreactive fillers or char. In the Flynn/Wall/Ozawa method, the temperatures in the degradation profile at specific conversion levels for multiple ramp rates are recorded. These are the isoconversional temperatures for each conversion level and ramp rate. Once the isoconversional temperatures are found, plots can be generated to calculate activation energy, lifetime prediction, and the relative thermal index (RTI). The RTI is the maximum service temperature where a key material property, such as degradation percent, does not fall below some critical threshold over a long period of time. It can be used as a comparison of the thermal endurance of two or more materials.
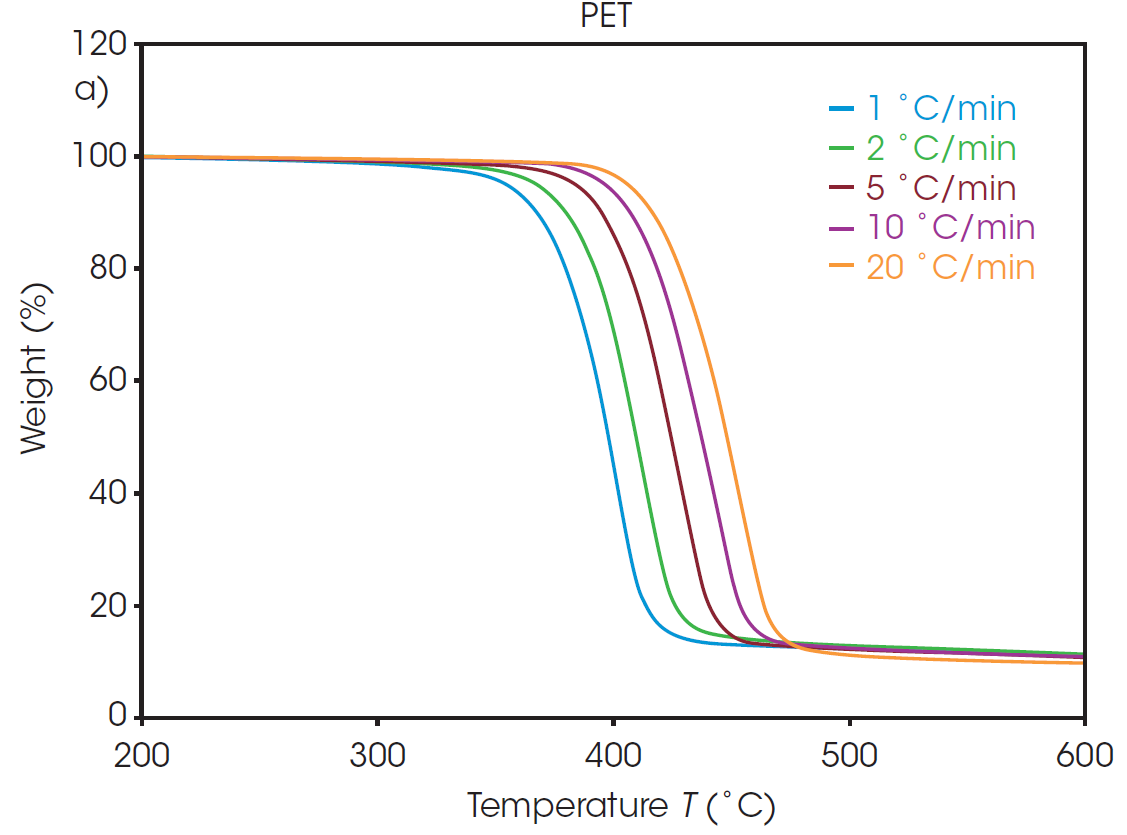
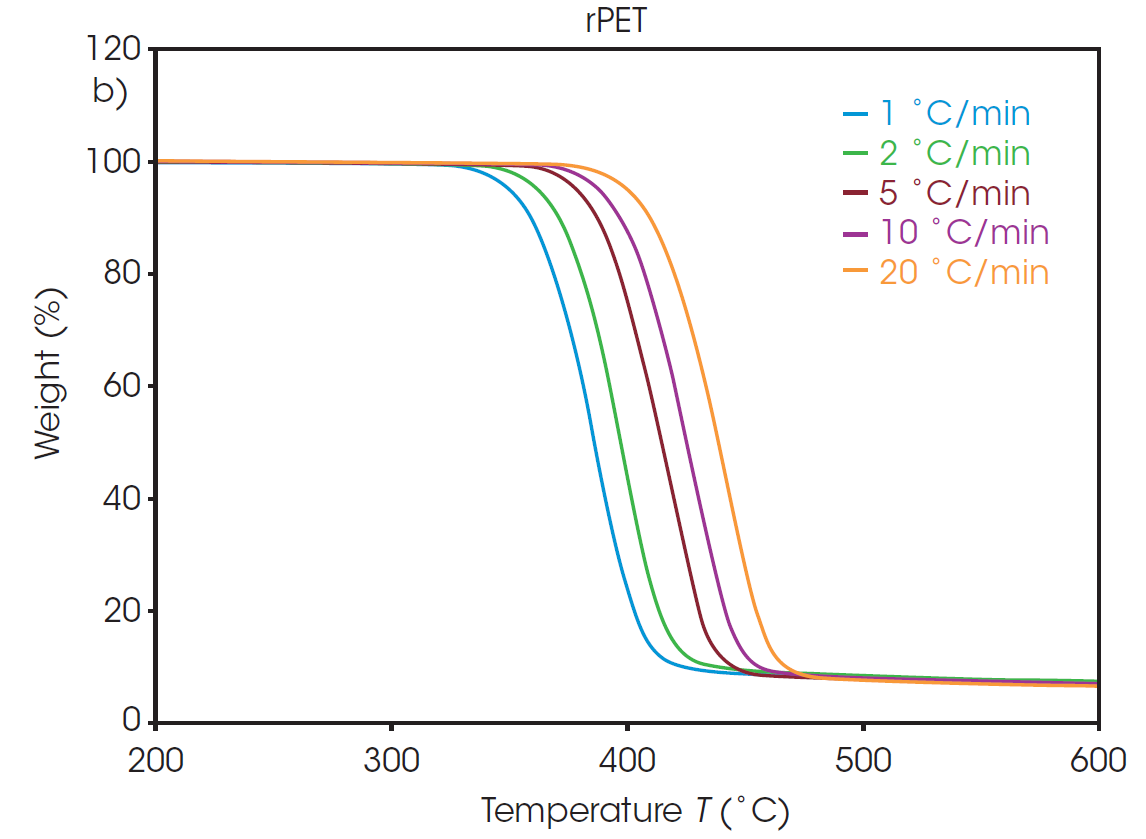
Measurements were made using a TA Instruments™ Discovery™ TGA 5500 with 7 mg (± 1 mg) samples in platinum pans. The samples were heated through decomposition from room temperature to 800 °C under nitrogen purge. For this work, five different heating rates were used: 1 °C/min, 2 °C/min, 5 °C/min, 10 °C/min, and 20 °C/min.
Results and Discussions
The weight loss profiles of PET and rPET at five different heating rates are shown in Figure 1. From each of these thermal curves, the absolute temperature at a constant conversion can be determined. It should be noted that, due to the inert environment, char residue remains from each sample and is accounted for in the conversion percentage calculation.
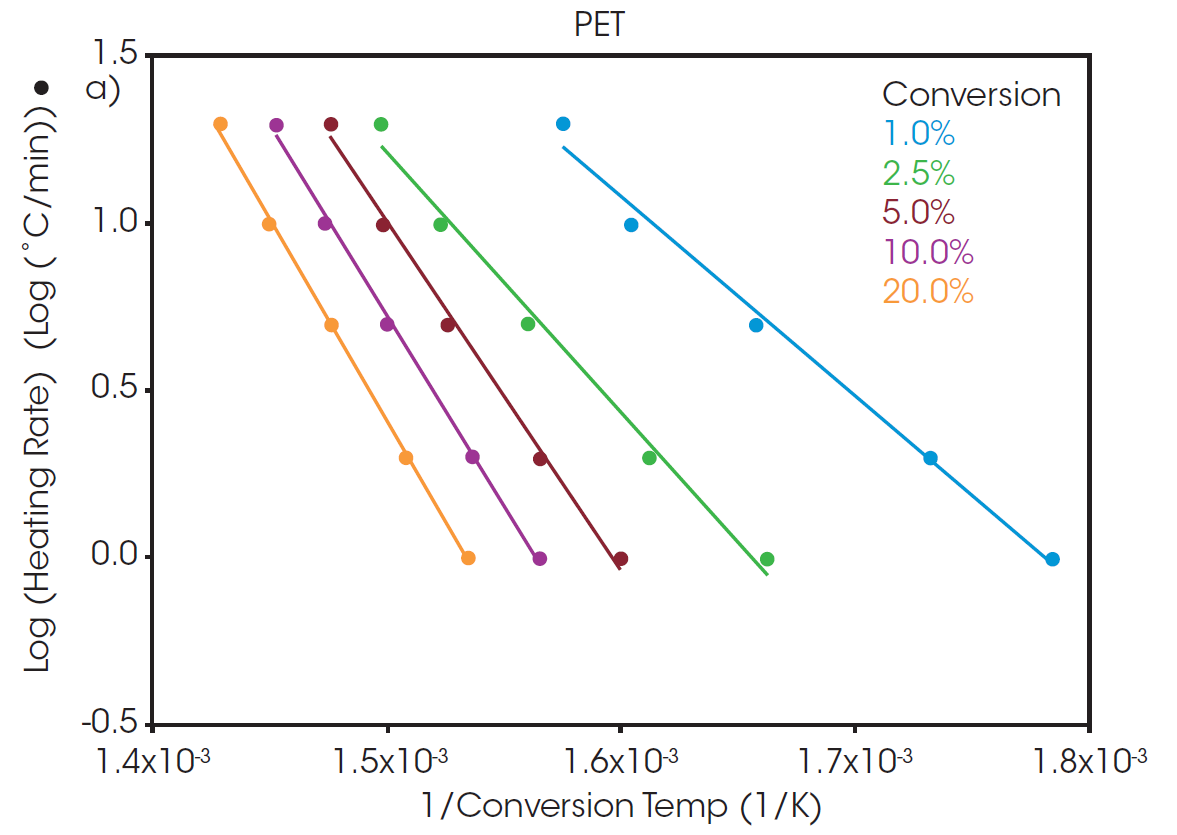
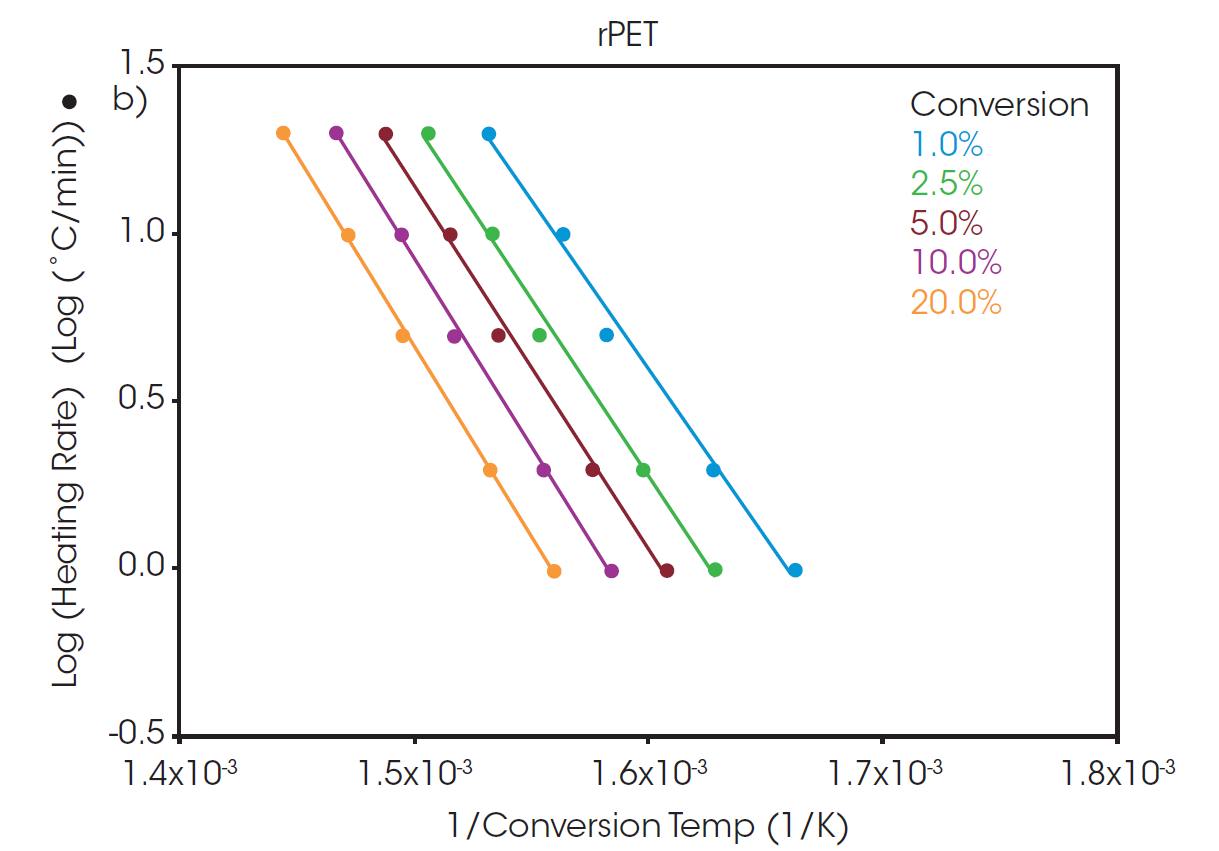
Plots of the logarithm of heating rate against the reciprocal of the isoconversional temperatures, shown in Figure 2, can be used to determine activation energy. The slopes of these curves are used in Equation 2 to calculate the activation energy for each conversion percentage in an iterative manner, as detailed in previous work [6].

Where:
- E = activation energy (J/mol)
- R = gas constant (8.314 J/mol K)
- T = temperature at constant conversion (K)
- b = heating rate (K/min)
- b = constant, approximation derivative (0.457) [ASTM E1641-18]
A “Log Heating Rate” curve can be informative when evaluating decomposition of a polymer sample. When the decomposition mechanism is the same at each isoconversion level, the lines will be parallel with equivalent slopes. At low conversion levels, the slopes may not match due to weight loss from small volatiles leaving the system. As a result, the analysis of activation energy of decomposition is often performed at a slightly higher conversion level where weight loss can be more confidently attributed to thermal degradation of the sample. A commonly used conversion level is 5%.
At a conversion of 5%, the activation energy for the thermal degradation of PET and rPET is calculated to be 210.6 and 213.9 kJ/mol, respectively. This shows that, despite being sourced from different feedstock, the polymer degradation is the same for both batches whether sourced from recycled or virgin material.
The calculated activation energy can be used to determine lifetime thermal stability as described in ASTM E1877 [8]. The resulting plots are shown in Figure 3, predicting the thermal stability of material as a function of time and temperature.
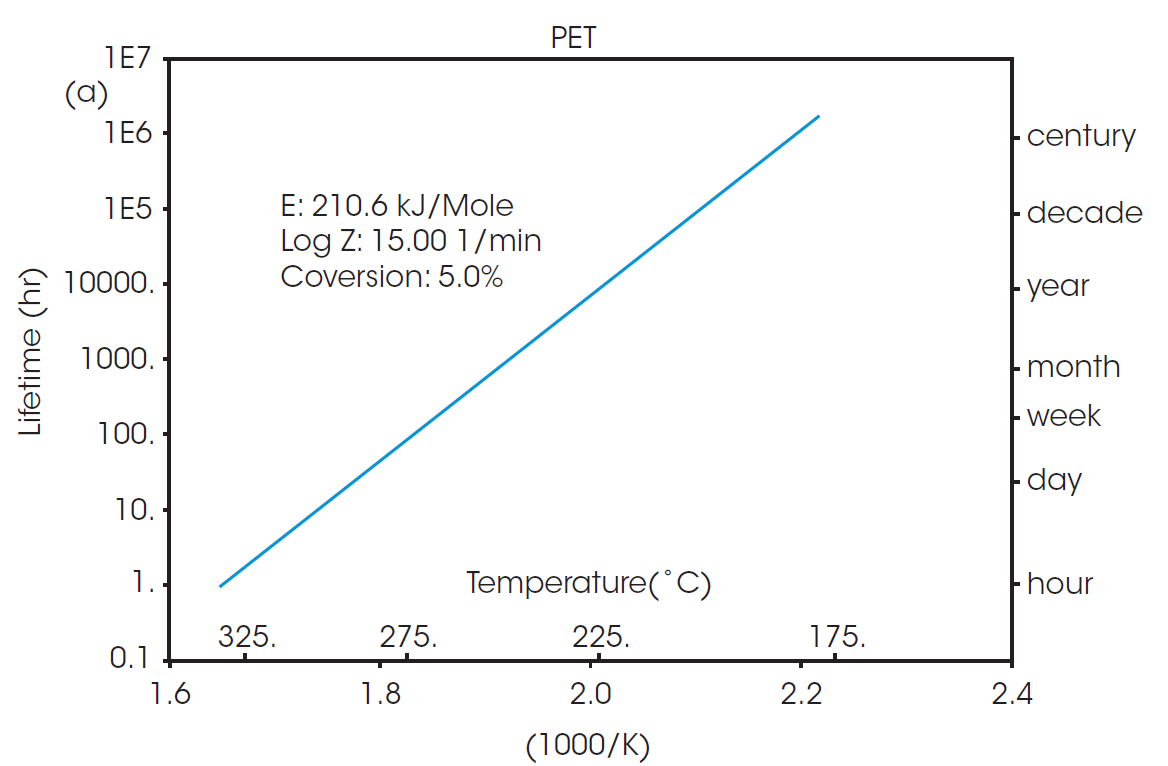
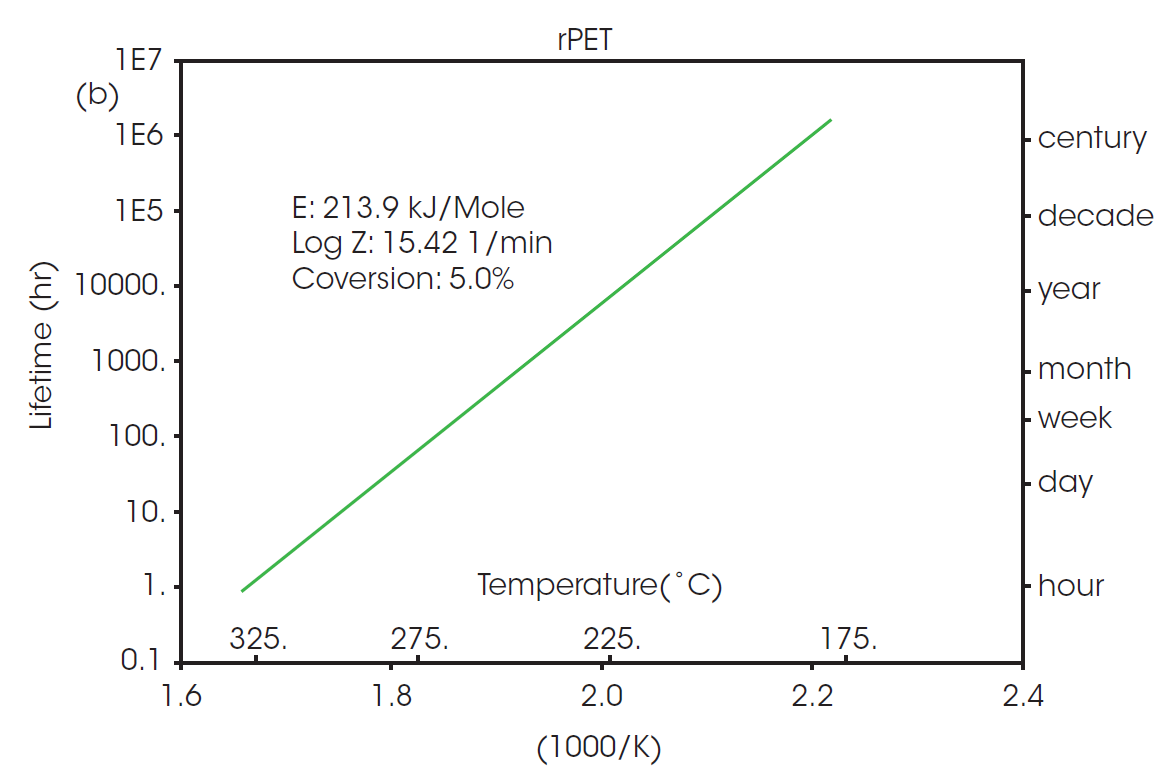
The RTI for two or more materials can be determined by selecting a common thermal lifetime and calculating the failure temperature (Tf) for each system to reach the designated conversion over the specified lifetime. From Figure 3, it can be calculated that the failure temperature for PET to reach 5% conversion over five years (43800 hours) is 208 °C. The RTI of rPET is functionally the same, calculated as 206 °C over the same lifetime. This demonstrates that products made with material sourced from this recycled feedstock will have the same thermal stability over its lifetime as any made with the virgin material.
Conclusion
The lifetime thermal stability of PET and rPET was predicted using a TA Instruments Discovery TGA 5500. Multiple dynamic heating ramps were applied to each sample to determine the kinetic parameters of thermal decomposition by the Flynn/Wall/Ozawa isoconversional method. The sample made from recycled feedstock was shown to have comparable thermal stability and lifetime performance to that of the sample of virgin material. It is valuable to know that, in this case, that there would be no change in predicted thermal stability when switching to a more sustainably sourced material.
References
- Z. O. G. Schyns and M. P. Shaver, “Mechanical Recycling of Packaging Plastics: A Review,” Macromolecular Rapid Communications, vol. 42, 2021.
- T. Thiounn and R. C. Smith, “Advances and approaches for chemical recycling of plastic waste,” Journal of Polymer Science, vol. 58, pp. 1347-1364, 2020.
- J. Payne and M. D. Jones, “The Chemical Recycling of Polyesters for a Circular Plastics Economy: Challenges and Emerging Opportunities,” ChemSusChem, vol. 14, pp. 4041-4070, 2021.
- E. Verdonck, “TA444: Comparison of the thermal behavior of different types of recycled PET for advanced honeycomb structures”,” TA Instruments, New Castle, DE.
- T. Chen, “RH122: Using Rheology and Thermal Analysis to Help Optimize Processing Conditions of Recycled PET,” TA Instruments, New Castle, DE, 2022.
- Y. Sanchez, “TA125: Estimation of Polymer Lifetime by TGA Decomposition Kinetics,” TA Instruments, New Castle, DE.
- “ASTM E1641-18, Standard Test Method for Decomposition Kinetics by Thermogravimetry Using the Ozawa/Flynn/Wall Method,” ASTM International, West Conshohocken, PA, 2018.
- “ASTM E1877-21 Standard Practice for Calculating Thermal Endurance of Materials from Thermogravimetric Decomposition Data,” ASTM International, Conshohocken, PA, 2021.
Acknowledgement
This paper was written by Andrew Janisse, PhD and Jennifer Vail, PhD at TA Instruments.
Click here to download the printable version of this application note.

