Keywords: Linear viscoelastic region, viscoelastic properties, rheology, DMA
RH110
Background
This note will describe the typical effects of frequency and temperature on the linear viscoelastic region (LVR). The LVR is the region of strains in a measurement for which the results, such as, moduli, glass transitions, modulus crossover points, and tan(δ), are independent of the strain itself and the stress and strain have a linear relationship. The critical strain is the end of the LVR. It may seem challenging to pick a strain for an experiment, such as a frequency sweep or temperature ramp, because the critical strain can change with frequency and temperature. This challenge is mitigated by the fact that the critical strain typically increases with temperature and decreases with frequency if there is an effect at all. The strain can be set within the linear region of the highest frequency and/or lowest temperature of interest to avoid exceeding the linear region at other conditions.
The critical strain will be defined as the point at which the stress-strain relationship deviates from linear behavior using the derivative of the logarithmic relationship. It is convenient to display data this way, however, a more standard definition would be the strain at which the storage modulus drops by 5% from its plateau value. These two methods are equally valid and produce similar critical strain values and trends [1].
Frequency Effects
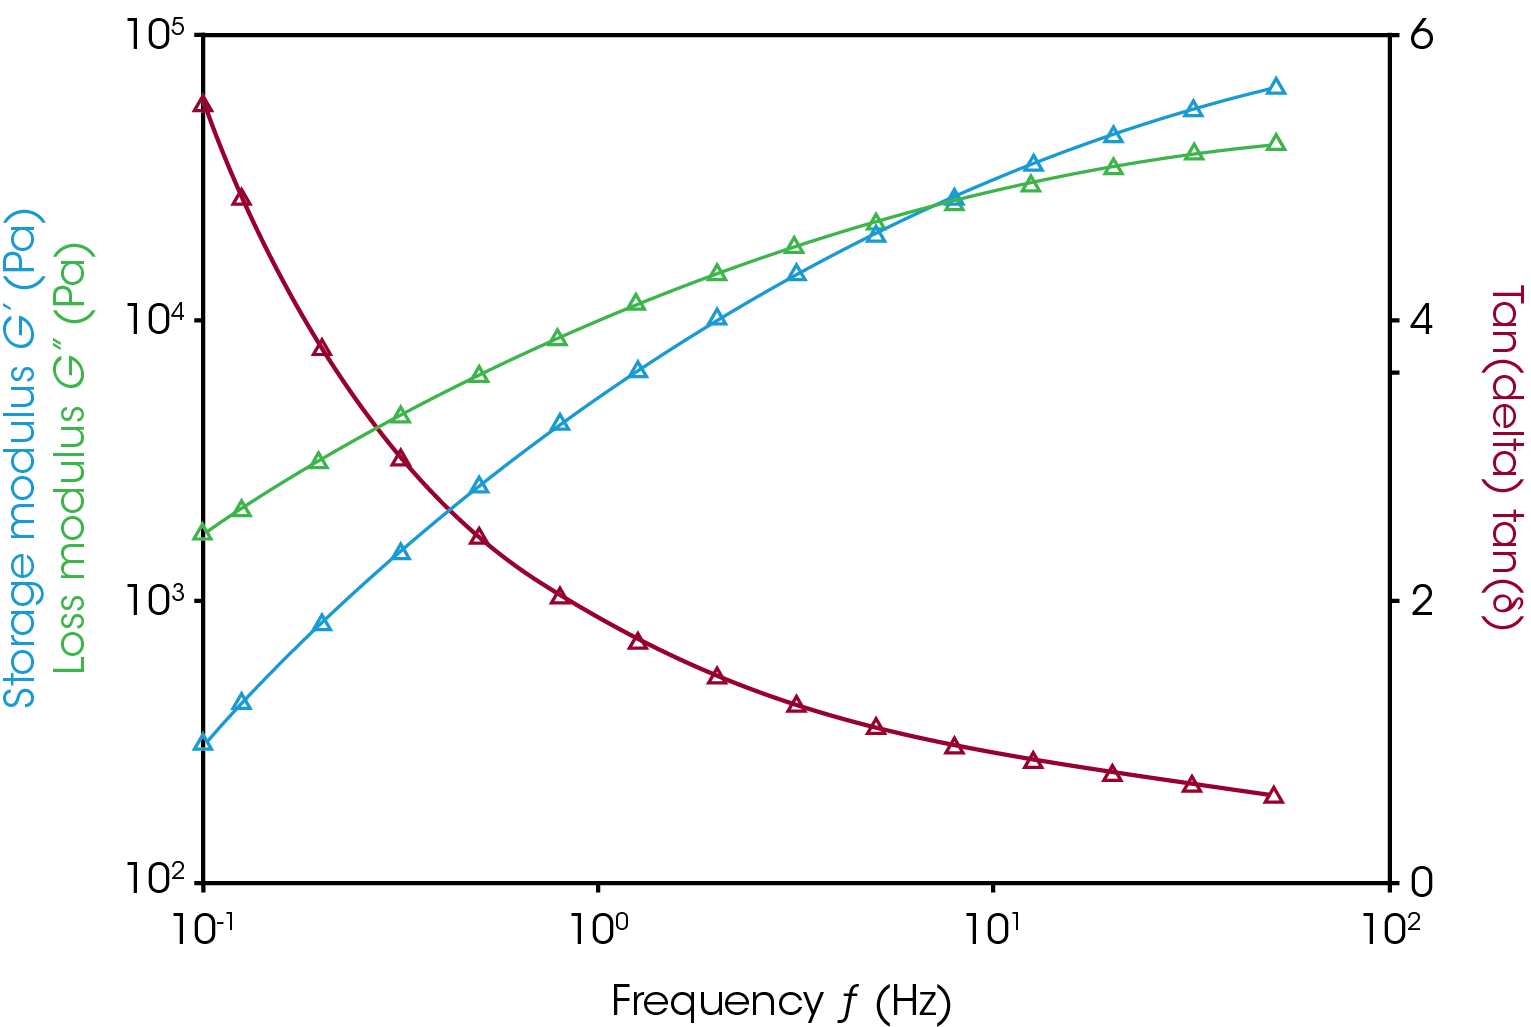
Figure 1, left, shows a frequency sweep of polystyrene at 220°C. This polymer is close to the terminal region at 220 °C so the storage and loss moduli are highly frequency dependent. At 10 Hz the loss and storage moduli are roughly equal. Deformations at lower frequencies will be dominated by the loss modulus and both moduli will decrease with frequency. Deformations at higher frequencies, above 10 Hz, will become more elastic and eventually approach a plateau.
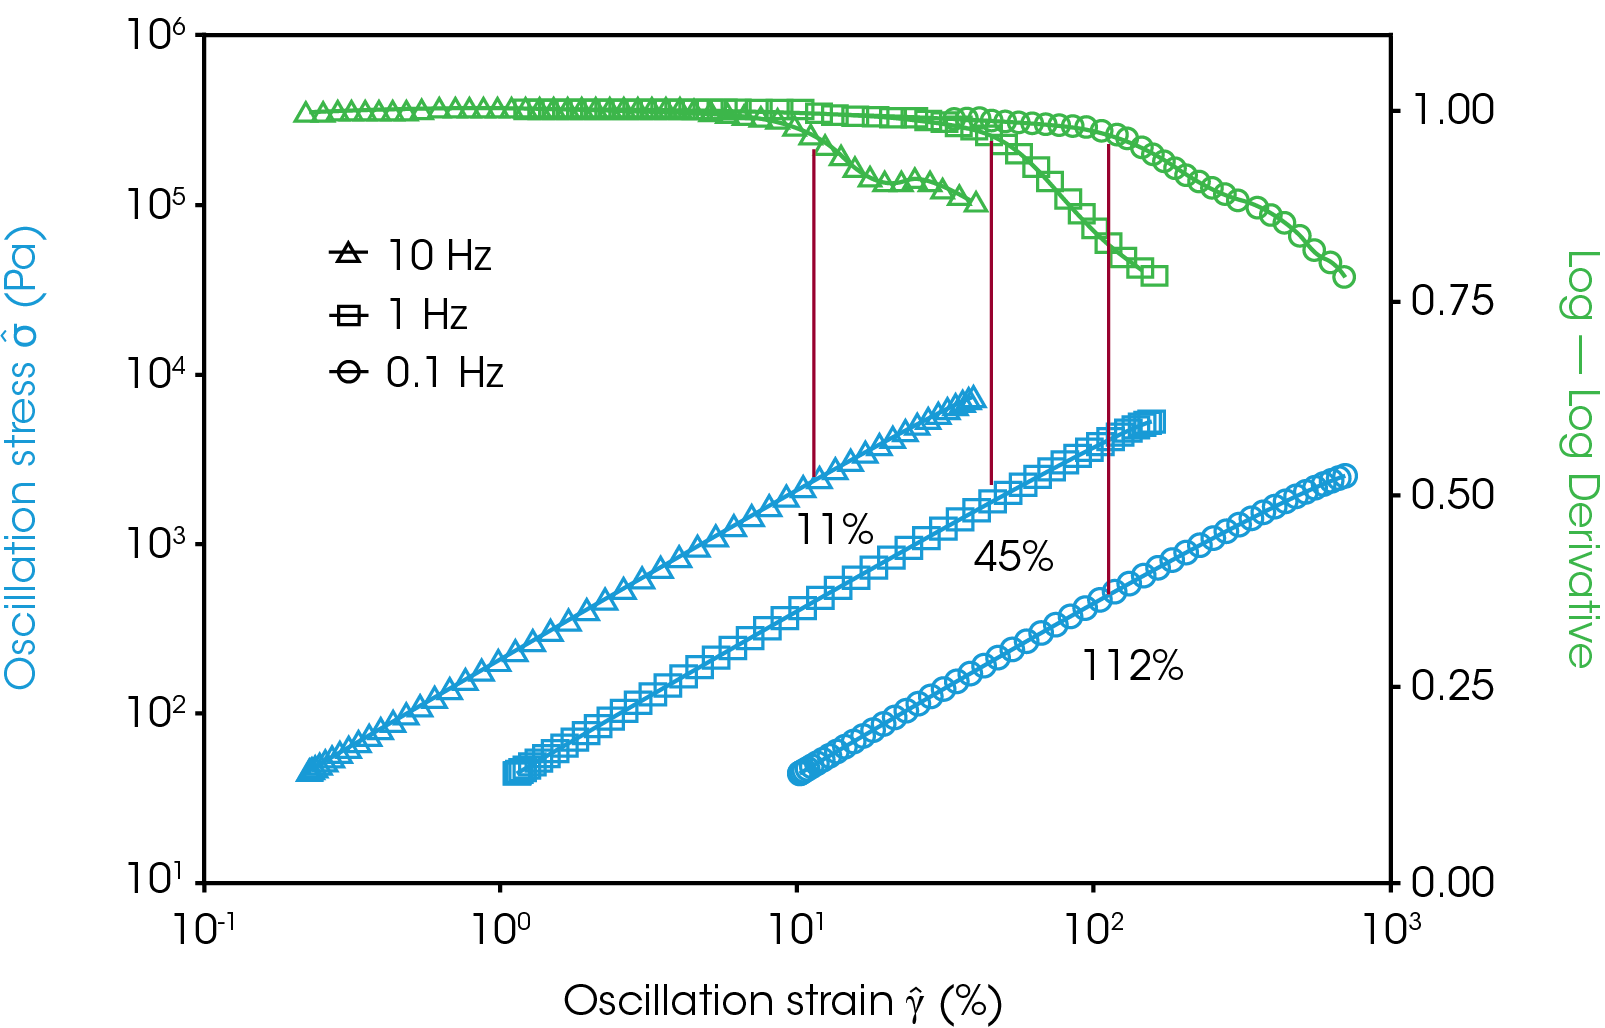
The critical strain also changes greatly with frequency in the terminal region. The amplitude sweeps (Figure 1, right) demonstrate that higher frequencies have shorter linear regions in this sample. A 100X decrease of frequency results in a 10X larger critical strain. The typical observed relationship in polymers is that higher critical strains are observed with more viscous, lower storage modulus measurements. Frequency sweeps for this sample of polystyrene at 175 °C, near the end of the rubbery plateau, have a critical strain of increase of about 1.5 X going from 10 to 0.1 Hz and a storage modulus of 100 kPa to 9 kPa respectively. Frequency and strain sweeps in the glassy plateau of polystyrene (up to ~80 °C) exhibit very little frequency dependence. The storage modulus and critical strain change by less than 5 % over 2 orders of magnitude in frequency.
Temperature Effects
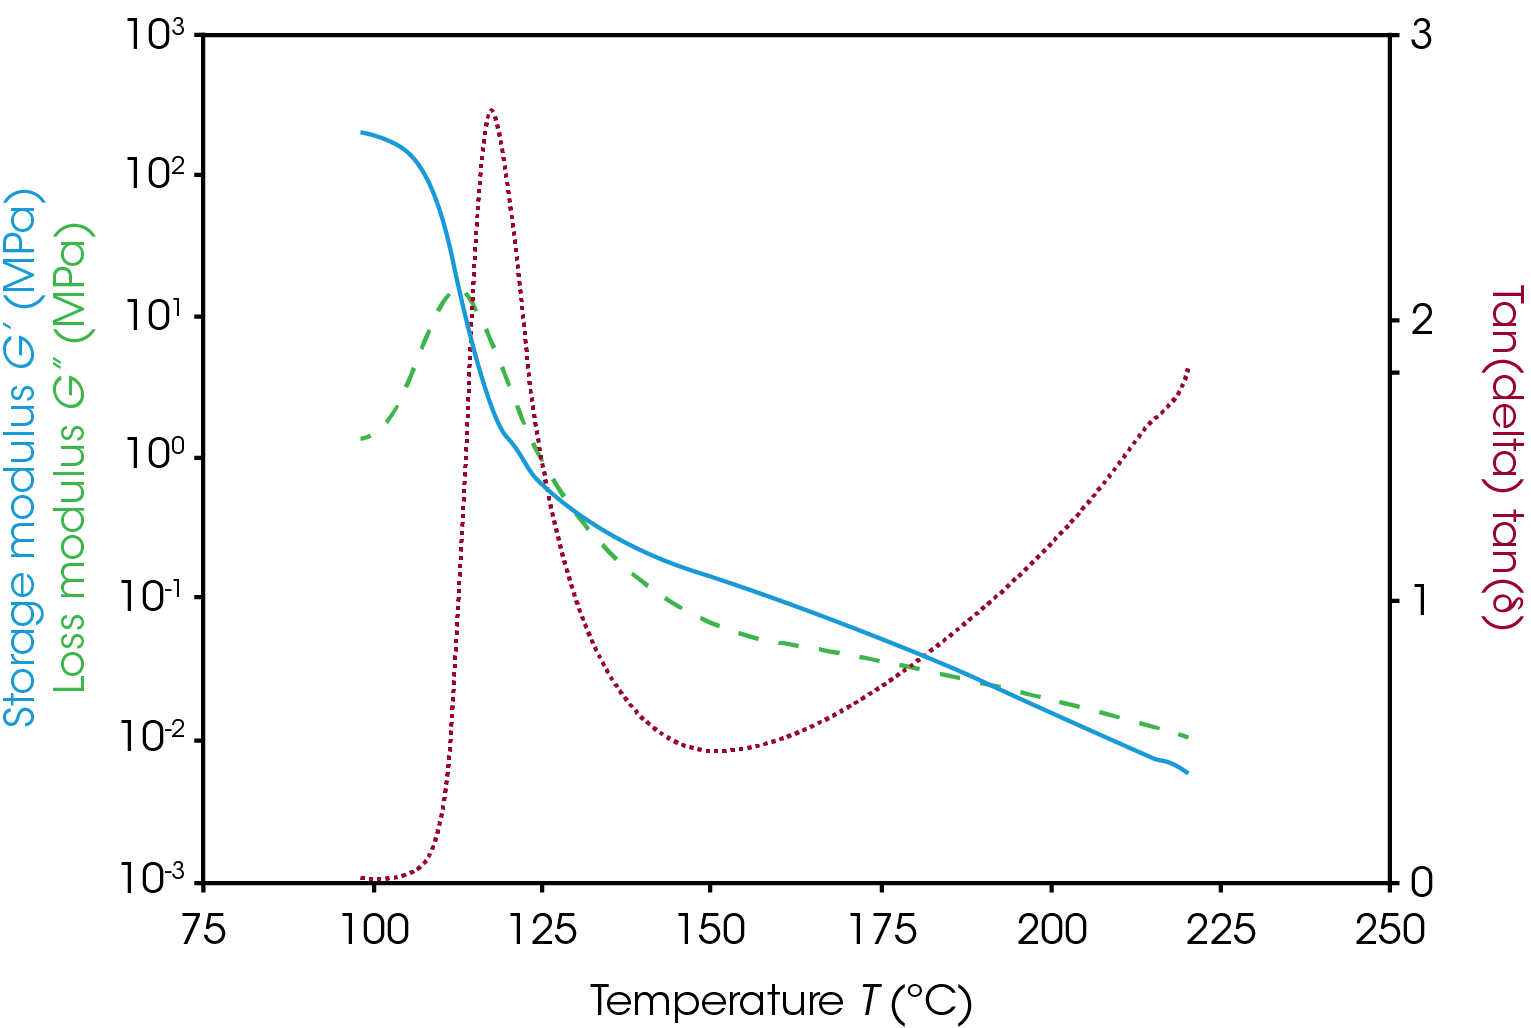
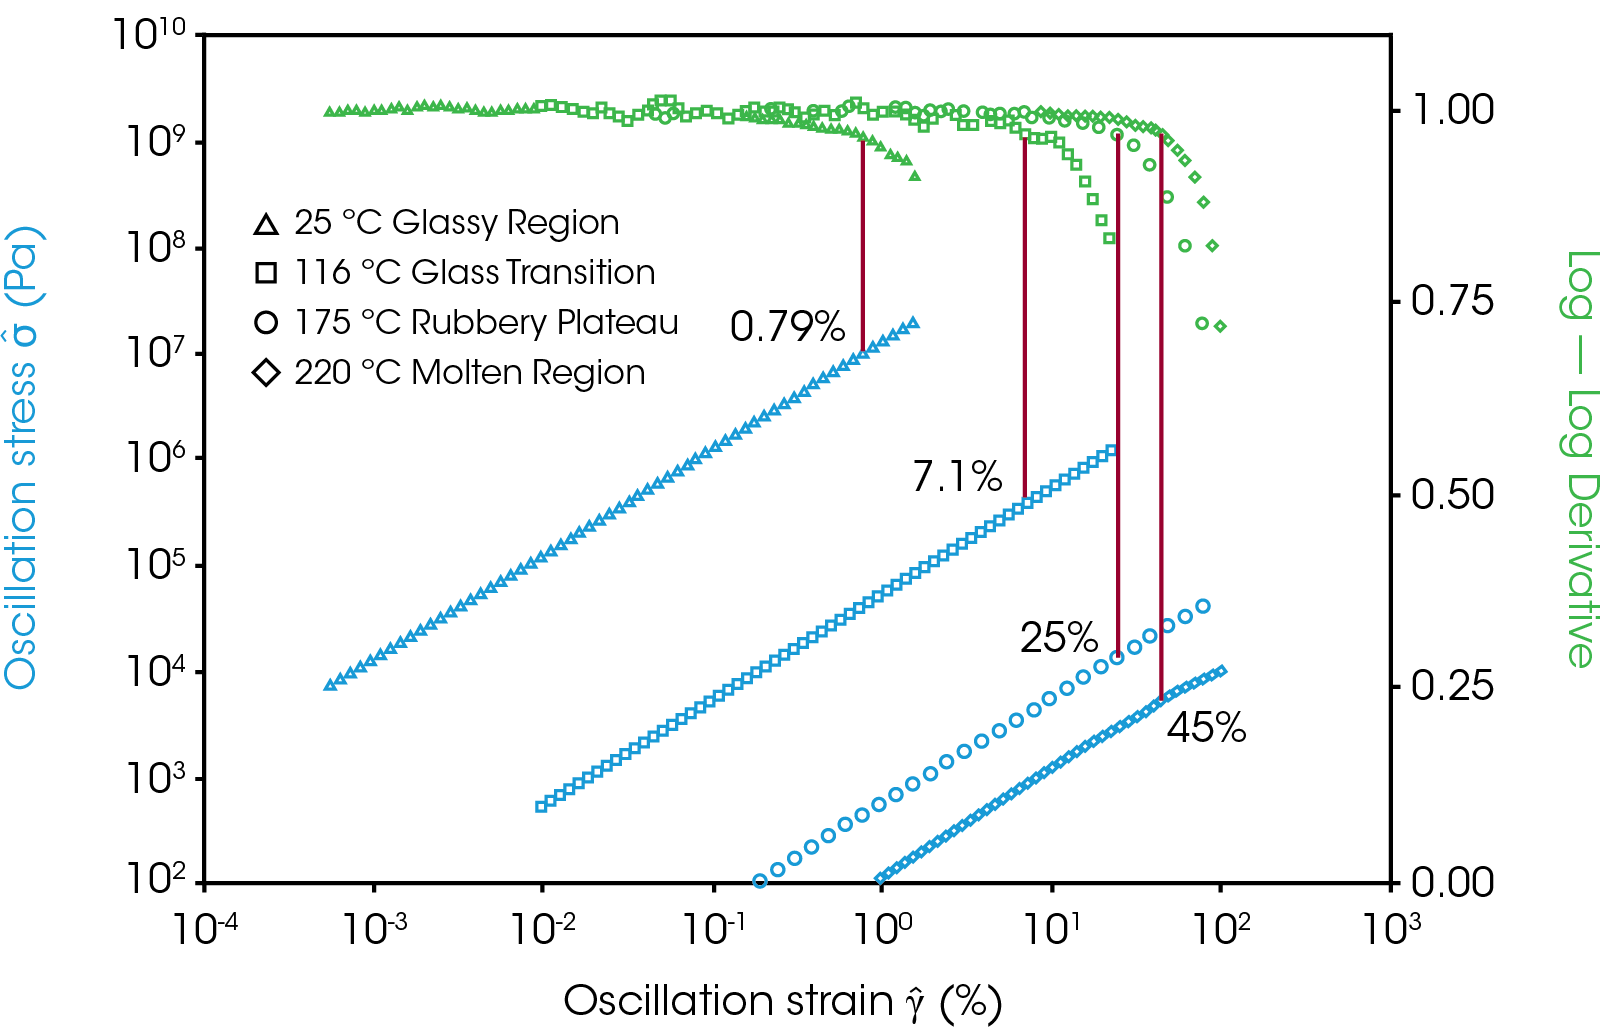
The temperature of the material can also affect the critical strain. Polymers have four typical regions: glassy region, transition region, rubbery plateau region, and terminal region. A temperature ramp from the very end of the glassy region to the molten state is shown in Figure 2, left, with strain sweep for a temperature in each region on the right. The glassy state is characterized by a high plateau in the storage modulus and a very low tan(δ) and therefor elastic response. The glassy state for this sample of polystyrene extends to around 100 °C. As the sample is heated from the glassy state it goes into the transition region where the storage modulus drops drastically and the tan(δ) signal peaks. The LVR also extends the most going from the glassy state to the transition state.
As observed with changing frequency, large changes in the viscoelastic parameters correlate to large changes in the LVR. When polymers get much softer, they typically have higher critical strains. Between 130 °C and ~190 °C the material enters the rubbery plateau where it is soft but elastic (storage modulus higher than loss). There is a moderate increase in the critical strain going from the transition region to the rubbery plateau. Around ~190 °C and higher is the terminal region where the material will continue to get softer and more viscous as it is heated and until it degrades. The linear region will continue to extend as the material gets softer and more liquid like.
Linear Region Trends
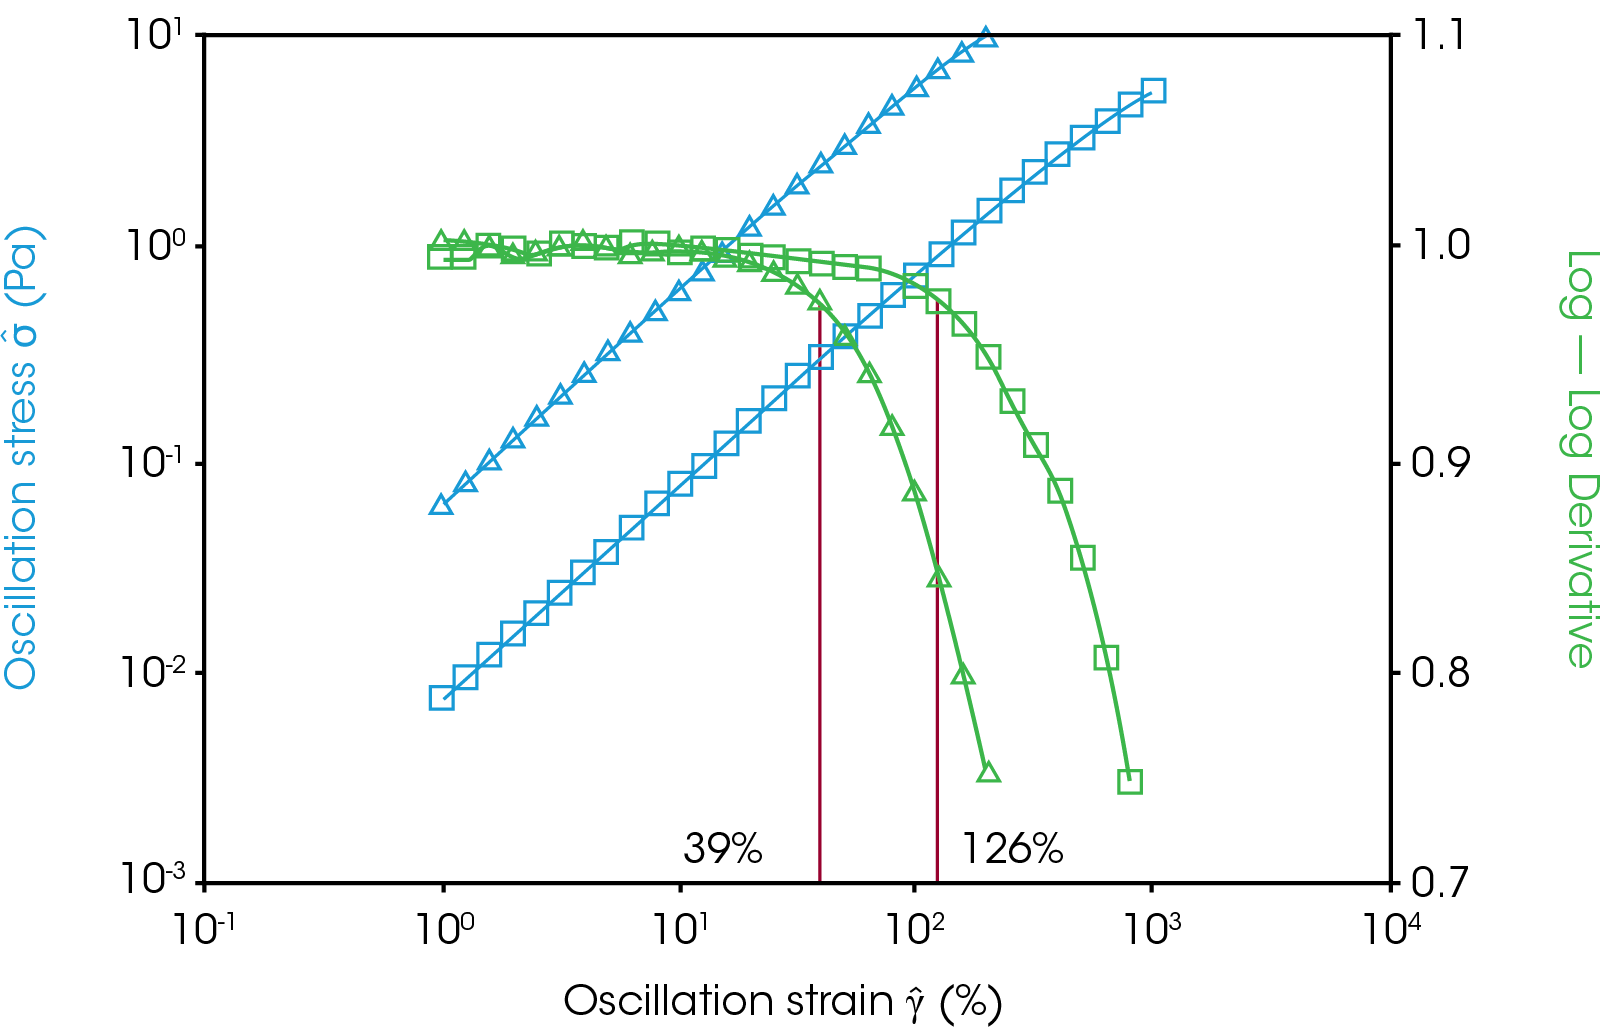
The observed relationship in the polystyrene is that the softer and more viscous (rather than elastic) the material is the longer the LVR is. This trend can be generalized to most polymers, polymer systems, and polymer solutions. Figure 3 shows strain sweeps at two different frequencies for a cetyltrimethylammonium bromide (30 mM), and sodium salicylate (230 mM) solution in water. This creates a worm-like micelle solution that behaves similarly to polymers [2]. This solution has a longer LVR at lower frequencies and a lower storage modulus and a more viscous response (loss modulus higher than storage modulus).
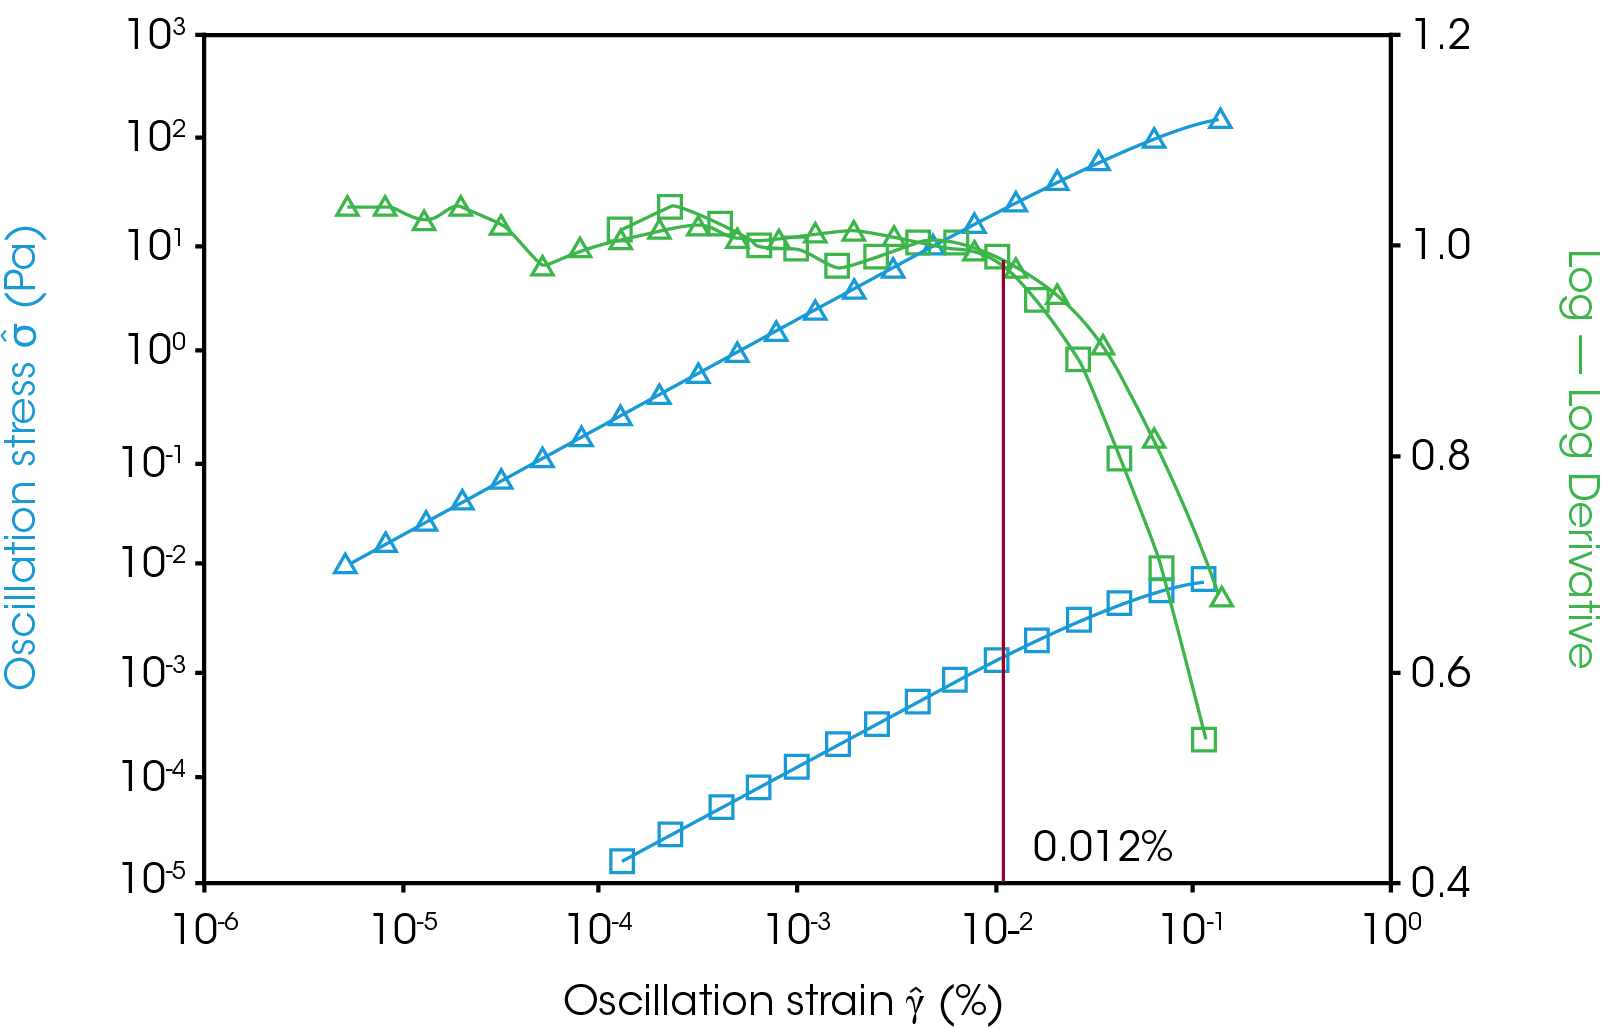
Many viscoelastic materials beyond polymers exhibit this trend but there are many exceptions. Milk chocolate (Figure 4) showed virtually no appreciable change in the linear region when heating from 10 °C to 50 °C and no frequency dependency on the linear region at either temperature despite becoming much softer; the storage modulus drops from 200 GPa to 12 KPa and tan(δ) increases from 0.1 to 0.25. Other notable exceptions were vacuum grease (room temperature to 90 °) as a temperature independent LVR, and mayonnaise, hand lotion, and latex paint (0.1 to 10 Hz at room temperature) for frequency independent LVR.
Conclusion
The linear viscoelastic region in polymer and polymer-like systems tends to extend as the material gets softer. The shortest linear region is usually at the lowest temperature and highest frequency oscillation. There are many materials that follow this trend but several examples that show no increase in the linear region with heating or reduced oscillation frequency, so it is prudent to conduct an amplitude sweep at the extremes of the testing conditions to ensure quality data is collected and all data is within the linear region. These observed trends are valid for both rheological and dynamic mechanical analysis experiments.
References
- Whitcomb, KJ. (2021) Determining the Linear Viscoelastic Region in Oscillatory Measurements https://www. tainstruments.com/pdf/literature/RH107.pdf
- Berret JF. (2006) Rheology of Wormlike Micelles: Equilibrium Properties and Shear Banding Transitions. In: Weiss R.G., Terech P. (eds) Molecular Gels. Springer, Dordrecht. https://doi.org/10.1007/1-4020-3689-2_20
Click here to download the printable version of this application note.

