Keywords: Rheo-microscopy, petroleum, Discovery, HR, Modular Microscope Accessory
RH141
Introduction
Rheo-microscopy is an exciting new technique that enables the simultaneous measurement of rheological properties and imaging of the microstructure that contributes to those properties. The technique enables the analysis of the impact of shear, temperature, and time on a formulation and can therefore provide insights into processing, storage, and performance of wax-based products.
Petrolatum
Petrolatum (commonly known as petroleum jelly or white soft paraffin) is a versatile and widely used ingredient in moisturisers. It is created as a by-product of crude oil refinement, undergoing many stages of purification before making it into cosmetic products. An occlusive, it forms an inert barrier on the skin and physically blocks water loss, trapping in moisture. Occlusive moisturisers at their most basic can exist as just petrolatum (e.g. 100% white petrolatum) or can use petrolatum as a key component of a formulation consisting of many ingredients.
A major problem to consider when working with petrolatum is the stability of the waxes when exposed to temperature changes. To ensure repeatability between batches, cooling waxes from a molten state requires careful monitoring of cooling rates and shear applied to the waxes. Previous studies have shown that waxy crude oil gels “display a strong dependence of the yield stress and moduli on the shear history, cooling rate, and stress loading rate” [1]. Size and morphology of the wax crystals, and therefore the crystalline structure of waxy systems, can differ significantly depending on cooling rates and how much shear is applied during cooling. This can affect the rheological behaviours of these ‘solid’ waxes.
Anyone who has used 100% white petrolatum or other similar emollients will appreciate how it could be difficult to move or pump petrolatum through a production pipeline. At room temperature, it exhibits solid-like characteristics and resistance to flow. A simple way to mobilise petrolatum is to heat it and heated transfer (or wax transfer) systems are commonly used. This, however, introduces stability issues as mentioned above.
Also consider the global transportation and storage of finished products and their subsequent exposure to wide-ranging temperature conditions, as well as agitation and vibration. These could introduce stability issues and spoil the product before making it onto supermarket and pharmacy shelves.
Rheo-microscopy offers the researcher and product developer the opportunity to reduce dependency on large-scale trials by rapidly screening their formulations for the impact of shear, temperature, and time to simulate processing, filling, and storage conditions.
Rheometer and Modular Microscope Setup
This study looks at the thermal stability of four petrolatum-containing products, comparing their rheological behaviour before, during, and after temperature cycling. The samples were tested using a TA Instruments™ Discovery™ Hybrid Rheometer (HR 20) coupled with a TA Instruments Modular Microscope Accessory (MMA). The MMA allowed for visualisation of the waxy samples melting on heating and crystallizing on cooling, whilst simultaneously capturing the bulk structure through small amplitude oscillatory shear rheology measurements. Additional oscillatory experiments were performed using a Discovery Hybrid Rheometer.
The MMA is a microscope platform with a glass lower plate mounted to the HR 20, allowing micro-structural changes to be observed during tests through the microscope beneath. It is highly versatile with a cross-polarisation filter, x-y-z micrometre positioning, and a piezo scanning system for precision adjustment of focal plane (100 μm in 0.1 μm increments). The HR 20/MMA is also equipped with an Upper Peltier Plate (UPP) to accurately control the temperature of the upper geometry during the experiments.
Rheo-microscopy is a useful technique as it facilitates linking micro-structural changes to bulk rheological properties. The microstructure of a material can change significantly upon application of shear. Whilst the result of these micro-structural changes can be characterised by rheological properties such as viscosity and yield stress, the use of a microscope during the measurements allows us to better understand and attribute these rheological behaviours. This is particularly valuable for this study, as during the cooling of the petrolatum waxes from a molten state, the onset of wax crystallisation and evolution of the micro-structure can be directly linked to the changes in rheological properties. Complex modulus (G*), a measure of the overall resistance to deformation (loosely described as rigidity) is one such useful metric to observe. As the crystallizing three-dimensional microstructure assembles, complex modulus increases, signifying the transition from a freeflowing liquid to a rigid solid.
Materials and Methods
Four petrolatum-based, commercially available products were chosen for this work on account of their relative petrolatum content. These are labeled below in Table 1 based on their percentage of petrolatum.
Temperature cycles of 20-80-20 °C and 20-40-20 °C at 2 °C per minute were performed using the MMA to obtain complex modulus (G*) as a function of temperature at a constant strain and frequency. The micro-structure was observed on a 1 fps time-lapse using a 40x objective with cross-polarisation. The same temperature cycles were repeated using a cross-hatched geometry, but oscillatory stress sweeps were performed before and after each temperature cycle. These tests provided insights into how temperature changes affected the structure of the samples and their stability against the magnitude of the changes.
Data analysis and processing were performed using TA Instruments TRIOS™ Software. Image analysis and processing were performed using ImageJ software, which is open-source and freely available online.
Table 1. Samples A and B contained only paraffin waxes/petrolatum; samples C and D contained other ingredients
| Sample Key | Sample Content |
|---|---|
| A: 100 | 100% White Soft Paraffin |
| B: 50/50 | 50% White Soft Paraffin, 50 % Liquid Paraffin |
| C: 46.5 | 46.5% petrolatum |
| D: 41 | 41% petrolatum |
Results and Discussion
Temperature cycle 20-80-20 °C
Throughout the temperature cycles a range of observations can be made across the samples:
Sample A starts with a needle-like crystal structure that melts to an amorphous, homogeneous mass then cools back to reveal fewer, larger wax needles.
Sample B shows largely similar behaviour but the lower proportion of wax needles in this 50% wax sample is clearly apparent at the start and end of the test.
Samples C and D both show the presence of a far more globular structure prior to melting, revealing the presence of other constituents such as mineral oils, water, and other ingredients. Sample C, however, demonstrates what appears to be clear round droplets in the melt that then become “frozen” into the cooled, solidified state. It is unclear if these droplets are a result of coalescence occurring following mobilisation or whether their distended, deformed precursors existed within the initial waxy structure.
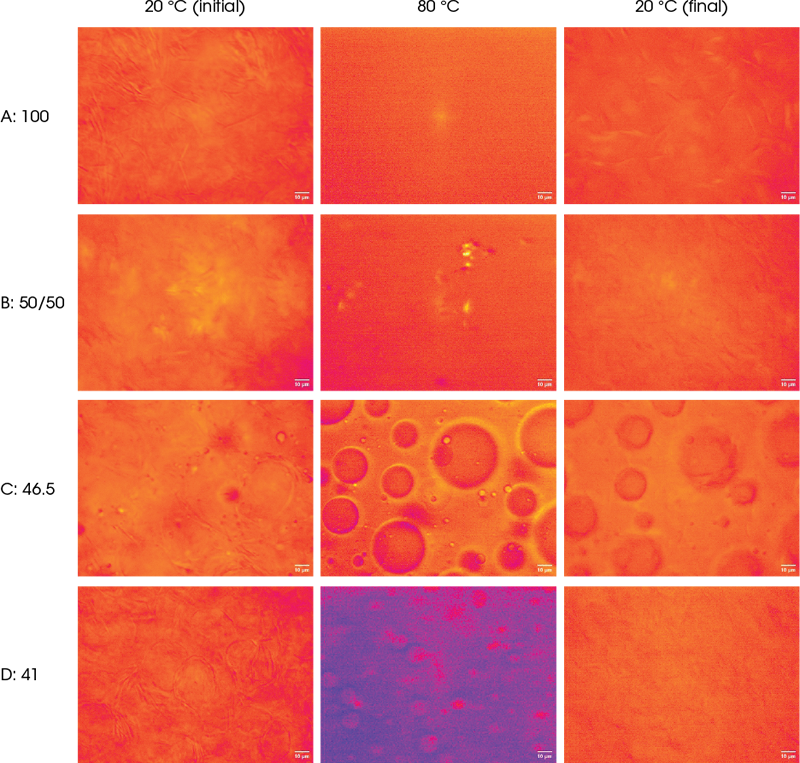
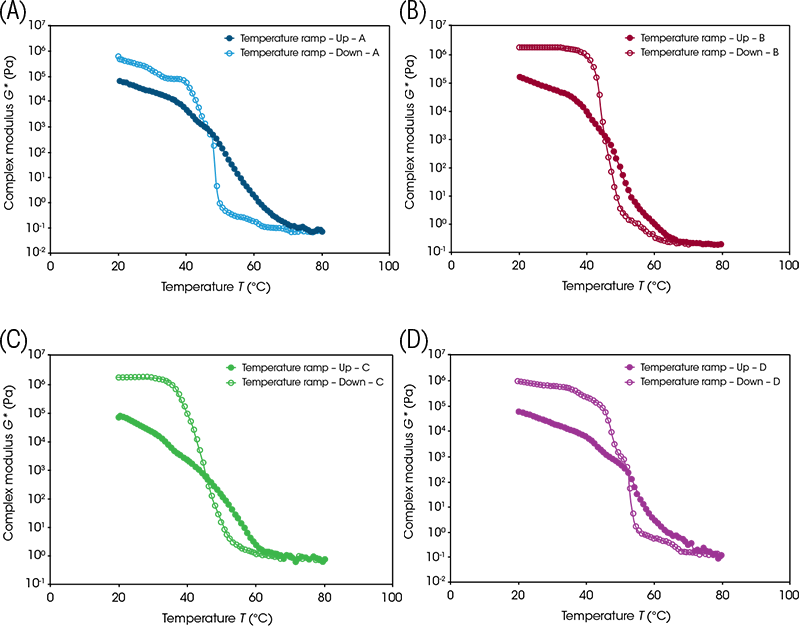
Figure 2 shows that the trends in the rheological data mirror those observed using microscopy for all four samples. At 20 °C, the samples displayed solid-like behaviour and were rigid, seen by the relatively high complex modulus values (G*). As the samples were heated, they began to melt as a result of a gradual degradation of the crystalline network. This was echoed in the gradual decrease in the G* with the values eventually settling at a plateau when the samples were completely molten and the G* values reached a minimum by 80 °C. As the temperature decreased from the maximum, the G* values continued back along the plateau until they significantly increased over several orders of magnitude once they reached the outwaxing temperature. The outwaxing temperature can be defined as the temperature below which wax crystallises such that the flow is impeded, and likely indicates a phase change.
One way the outwaxing temperature can be determined is by using “onset point” analysis in the TRIOS Software (Figure 3). Two tangents (one along the plateau before the transition and one along the transition slope) are constructed. The outwaxing temperature is then determined from the x-axis value of the projected intersection of the tangents.
Table 2. Outwaxing temperatures for each sample
| Sample | Outwaxing temperature (°C) |
|---|---|
| A: 100 | 49.7 |
| B: 50/50 | 48.7 |
| C: 46.5 | 50.6 |
| D: 41 | 54.9 |
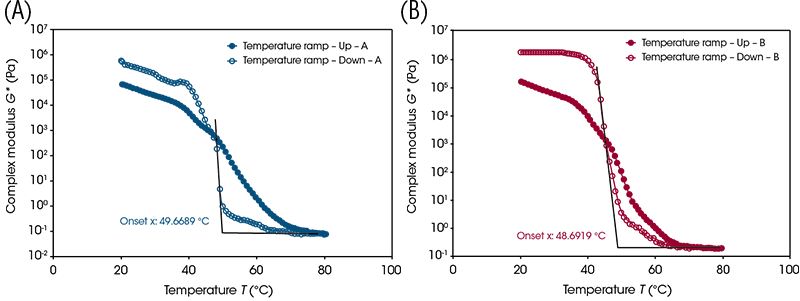
Of the four samples tested, there was one which was significantly different. Samples A, B, and C all had similar outwaxing temperatures at ~50 °C. Sample D was closer to ~55 °C. Looking at the micrographs of each sample at their respective outwaxing temperatures (Figure 4), sample D also differs from the rest. A, B, and C show the small wax crystals precipitating and beginning to form networks. This is not observed for sample D. Such differences could conceivably manifest as textural differences, particularly during the “rub-out” phase of application of the product to the skin.
Thermorheological “fingerprints”
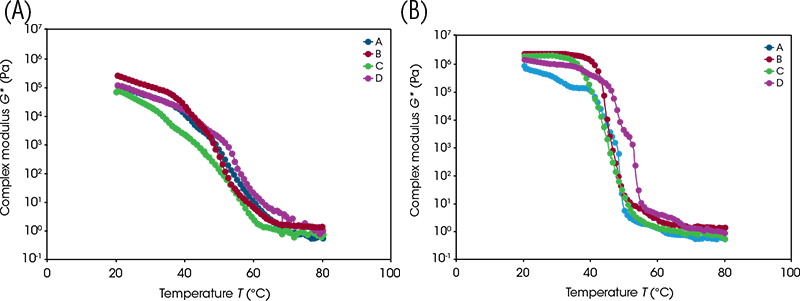
Outwaxing temperature and melt temperature, are, of course, merely single numbers that are attempting to describe a series of events. The multiple steps present in the temperature upsweeps and downsweeps (see comparisons in Figure 5 below) in fact reveal highly nuanced thermorheological fingerprints that may deliver a significant insight into the aggregate effects of multiple constituents in a product through heating and cooling processes.

Temperature cycle 20-40-20 °C
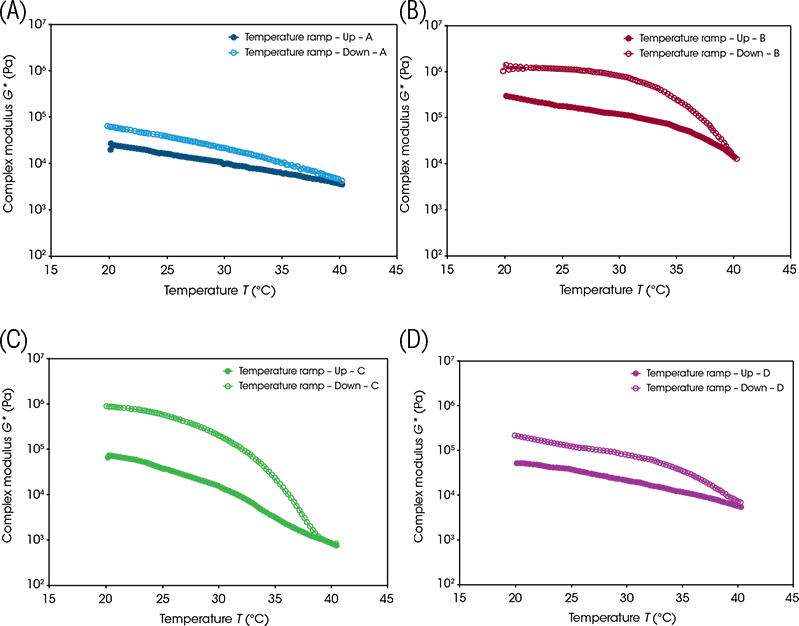
This temperature cycle was designed to mimic gentler heating conditions; representative images taken during this cycle are presented in Figure 6. At 40 °C, samples A and B still retained their interconnected network of needle-like crystals. Sample A had started to flow and the micro-structure became less well-defined, and a droplet or an air bubble had entered the field-of-view. This differed with sample B, which had not started to flow, although the crystal network had slightly deformed. The large round particles in sample C had started to disappear, although the outlines of some could still be discerned. The small droplets had started to move but hadn’t started to coalesce. Sample D shows minimal qualitative change throughout.
Figure 6. Micro-structural changes of the four samples during the low-temperature cycle Once cooled back to 20 °C, samples A and B returned to their initial micro-structural states with their needle-like crystalline network retained. The outlines of the large round particles in sample C did not reform in any significant way. Sample D, like A and B, returned to its initial state.
The micro-structural observations align with the changes seen in the rheological data presented in Figure 7. None of the samples exhibited behaviour that would indicate significant phase change or had their micro-structure disrupted. The samples mostly retained their rigidity, with the largest decrease in complex modulus being sample C with a decrease of roughly two orders of magnitude. Sample C also showed the greatest micro-structural change; although sample A began to flow, it retained its crystalline network, whereas sample C lost its structural features.

Oscillatory stress sweeps
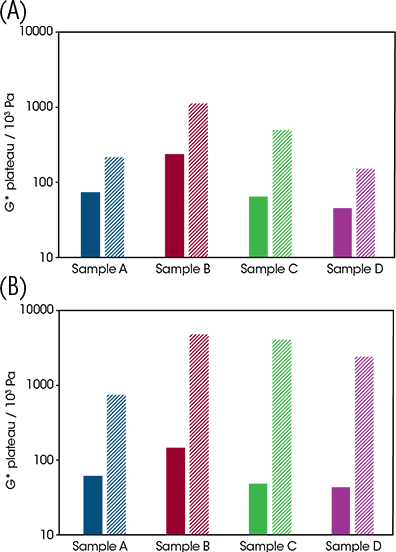
The oscillation stress sweep test provides a simple quantification of the rigidity and strength of soft solid structure present throughout a sample. The test entails the application of small, incrementing sinusoidal (i.e. clockwise then anti-clockwise) shear stresses to the sample whilst monitoring the resulting elastic deformation and/or flow. In the early stages of the test, the stress is sufficiently low to preserve structure. At this stage, the sample rigidity, quantified by the complex modulus, remains at a plateau value. As the test progresses, the incrementing applied stress eventually disrupts sample structure as the yielding process progresses. This is manifested as the decrease in rigidity (complex modulus decreases) detailed in Figure 8. By performing oscillation stress sweeps before and after temperature cycling, it was observed that both cycles caused all samples to increase in rigidity. The lower-temperature cycle caused the G* plateau to increase by under one order of magnitude; however, the higher-temperature cycle caused an increase of over one order of magnitude for all samples, close to two for samples C and D. This could be caused by the quiescent nature of the cooling. Had the structures been cooled under shear, a weaker wax network from smaller crystals may have formed, potentially lowering the rigidity of the samples closer to their initial states.
Conclusions
Understanding how the micro-structure and bulk rheological properties of wax-based formulations change across temperature cycles can help to inform key processability, transport, and storage decisions. This work shows how petroleum wax-based products can change dramatically with temperature, both on a bulk rheological and micro-structural level. Complex formulations with multiple ingredients beyond the simple paraffin wax appear to exacerbate these changes, furthering the need for robust characterisation methods for advanced product lines. These samples often experience large changes in their bulk rheological properties, particularly their complex modulus, not only during temperature cycles but also on-going, long-term changes following the return to ambient conditions. The use of the MMA and rheo-microscopy allows for quantification of the products in terms of their bulk rheological properties, and simultaneously qualification of the results in relation to the micro-structure of the formulations. Similar methods and methodologies could be utilised in order to quantify these behaviours in terms of shear and stress independent of, or alongside, temperature as a control parameter. Similarly, whilst the focus of this study is petroleum-wax based products, similar methodologies are applicable to any formulation which displays a degree of crystallisation or microstructural network.
References
Acknowledgement
This paper was a collaboration with the Centre for Industrial Rheology, written by Neil Cunningham and Daniel Williams.
For more information or to request a product quote, please visit www.tainstruments.com to locate your local sales office information.
TA Instruments, Discovery, and TRIOS are trademarks of Waters Technologies Corporation.
Click here to download the printable version of this application note.

