Keywords: Differential Scanning Calorimetry (DSC), Oligonucleotide-Based Therapeutics (ON), Antisense Oligonucleotide (ASO), Small Interfering RNA (siRNA), DNA, RNA, Concentration Effects, Formulation Development
MC180
Abstract
Short-term thermal stability testing is crucial to ensure product quality and support regulatory approval of oligonucleotide-based therapeutics. The TA Instruments™ RS-DSC (Rapid Screening-Differential Scanning Calorimeter) is an effective tool for measuring the thermal stability of oligonucleotides (oligos) as a function of buffer, concentration, and oligonucleotide length.
Introduction
The TA Instruments Nano DSC (Differential Scanning Calorimeter) is an established tool for monitoring the thermal stability of short- and medium-length oligonucleotides at low concentration [1, 2]. While the capillary cell offers improved sensitivity, its ability to measure duplex stability at low concentrations (<1 mg/mL) may not be fully representative of biotherapeutic stability at higher, formulationstrength concentrations. The TA Instruments RS-DSC offers a groundbreaking microcalorimetric technique that allows for screening of macromolecular stability using low volumes of formulation strength concentrations, usually without dilution or cleaning.
Oligonucleotide-based therapeutics (ONs) are an emerging drug class that seek to treat disease by modulating gene expression [3, 4]. The most common examples of ONs include antisense oligonucleotides (ASOs) and small interfering RNA (siRNA) therapy. While ASO and siRNA-based drugs achieve their therapeutic effects through different mechanisms, both bind to target RNA via Watson-Crick base pairing to activate or suppress gene expression. The melting temperature (Tm), defined as the temperature at which half of the DNA duplex is dissociated into single strands, is a critical parameter in designing the sequence of oligonucleotide drugs, and the therapeutic effect of many DNA-binding drugs has been shown to correlate to the thermodynamic profiles of the complexes [5]. One common technique used to characterize nucleotide melt is by measuring absorbance at A260 as a function of temperature; however, this method generally requires dilution of high concentration samples as absorbance readings should fall between 0.15 and 1.0 to ensure that measurements are within the linear range [6].
DSC is an invaluable tool used to obtain thermodynamic profiles of nucleic acids, modified nucleic acids, and nucleic acid-ligand interactions (Figure 1). In addition to directly measuring the melting temperature of nucleic acid complexes, DSC directly measures calorimetric enthalpy changes (ΔHcal) and is used to understand dissociation parameters such as Gibbs free energy change (ΔG) and entropy change (ΔS). Using DSC, the effect of nucleotide chain length, nucleotide concentration, and formulation conditions including buffer, excipients, pH, and ionic strength can be clearly elucidated. Other physiochemical analytical techniques, such as liquid chromatography, require an understanding of non-denaturing and denaturing conditions, and DSC provides complementary information to guide method development for nucleic acid analysis [2].
To demonstrate the capabilities of the TA Instruments RS-DSC for screening oligonucleotide therapeutics, two derivatives of commercially available ASO drugs were evaluated. EXONDYS 51™ Eteplirsen is a 30-mer phosphorodiamidate morpholino antisense oligonucleotide that was approved for the treatment of Duchenne muscular dystrophy in 2016. Eteplirsen functions by affecting splicing of the dystrophin gene by skipping exon 51; this allows for production of a partially functional protein rather than the nonfunctional dystrophin. The ASO is formulated at a concentration of 50 mg/mL and administered by intravenous infusion [7].
TEGSEDI™ Inotersen is a 20-mer antisense oligonucleotide with a gapmer structure that is approved for the treatment of polyneuropathy hereditary transthyretin mediated amyloidosis (hATTR). A mutation in the transthyretin (TTR) gene is characteristic of hATTR and inotersen functions by hybridizing to TTR mRNA and triggering degradation of the complex by RNase H. It is formulated at 200 mg/mL and administered weekly by subcutaneous injection [8].
 event, an oligonucleotide exists in its canonical double helical structure and at elevated temperatures it exists in the single stranded coil form. When referring to oligo denaturation studies, the melting temperature (Tm) and temperature at peak maximum (Tmax) are often used interchangeably.")
Figure 1. Representative schematic showing a DNA denaturation profile obtained via DSC analysis. Prior to the denaturation (melt) event, an oligonucleotide exists in its canonical double helical structure and at elevated temperatures it exists in the single stranded coil form. When referring to oligo denaturation studies, the melting temperature (Tm) and temperature at peak maximum (Tmax) are often used interchangeably.
Experiments and Methods
Custom oligonucleotides were purchased as complementary strands of single-stranded DNA from Integrated DNA Technologies (IDT) and combined prior to analysis. The following derivatives of FDA-approved oligonucleotide therapeutics TEGSEDI Inotersen and EXONDYS 51 Eteplirsen were chosen for analysis and purchased as sequences of natural nucleotides without modifications.
20-base pair duplex (inotersen derivative):
- 5’ – TCT TGG TTA CAT GAA ATC CC – 3’
- 3’ – GGG ATT TCA TGT AAC CAA GA – 5’
30-base pair duplex (eteplirsen derivative):
- 5’ – CTC CAA CAT CAA GGA AGA TGG CAT TTC TAG – 3’
- 3’ – CTA GAA ATG CCA TCT TCC TTG ATG TTG GAG – 5’
To promote duplex formation, forward and reverse complements were combined in buffer in a 1:1 ratio at the desired duplex concentrations and allowed to anneal at room temperature before DSC analysis. Stock concentration was determined by diluting each single-stranded oligo prior to combining and measuring absorbance using a NanoDrop™ One Microvolume UV-Vis Spectrophotometer from Thermo Fisher Scientific Inc.
Buffer Composition:
- Gibco™ DPBS, pH 7.4
- 10 mM sodium phosphate, 150 mM sodium chloride, pH 7.0-7.75
- 10 mM sodium phosphate, 0-150 mM sodium chloride, pH 7.0
For calorimetric analysis, 11 μL of oligonucleotide sample was pipetted directly into the disposable glass microfluidic chips (MFCs) into a channel that is designed to contain liquid sample. After addition of sample, the microfluidic chips were sealed with adhesive-backed glass coverslips to contain the sample during heating to 100 °C. Assembled MFCs were placed onto the sample side of each twin calorimeter in the TA Instruments RS-DSC. A reusable polyetheretherketone (PEEK) chip remains on the reference side. Up to 24 samples may be run simultaneously with a temperature range of 20 – 100 °C and pre-set scan rates of 1 or 2 °C/min. By using disposable MFCs, up to 96 samples can be run on a typical workday.
The TA Instruments RS-DSC, operated with TA Instruments RS-DSCRun Software, was set to equilibrate at the initial temperature for 1800 s prior to the start of each scan. Replicates of each sample were scanned at 1 or 2 °C/min across the full temperature range (20 – 100 °C).
Data was processed using NanoAnalyze™ Software (version 4.1.0.) NanoAnalyze Software v4.1.0 includes a new software feature, NanoAnalyze RapidDSC, that will automatically detect baseline, Tmax, and Tonset in DSC thermograms by searching for peaks across the specified range of data. An automatic baseline is applied across the peak and used to further refine the Tmax temperature for improved accuracy. Automatic peak detection features display up to five peaks across the temperature range of interest. The automation features can be easily edited in the “Guided RapidDSC Analysis” wizard to narrow the window of detection, select a specific range for peak identification, or adjust the automated baseline, Tmax and Tonset. Tabulated data from automated analysis can be exported for easy comparison and easy data comparison is viewable in the Tmax visualization, concentration dependence, and overlay tabs in the NanoAnalyze RapidDSC feature.
Manual analysis in NanoAnalyze Software was performed by normalizing to molar heat capacity using the moles of nucleic acid in the active cell volume. A fourth or fifth order polynomial was applied as the baseline to the normalized data. Further analysis of the thermograms may be completed by fitting with models as described in “NanoDSC: What to Consider When Choosing a Baseline and Model” [9].
Results and Discussion
Screening of Oligonucleotides at Varying Concentrations
Thermal stability is a critical quality attribute of an oligonucleotide drug product and is influenced by chain length, G:C-richness, concentration, and the ionic strength of its buffering system [10]. DSC is the premier tool for characterizing the thermodynamic profile of biologic molecules, including melting temperature. The parallel throughput and concentration allowances of the TA Instruments RS-DSC enables rapid screening of oligonucleotide drug candidates at formulation strength concentrations.
To demonstrate how the TA Instruments RS-DSC can be used for screening oligonucleotide drugs, triplicate data was analyzed at varying concentrations from native-DNA analogues of approved ASO drugs inotersen and eteplirsen. While concentrations up to ~70 mg/mL were screened in this study, some approved nucleic acid therapies are formulated up to 200 mg/mL [4] and the disposable microfluidic sample chips of the TA Instruments RS-DSC are designed to contain these high formulation strength concentrations, allowing for direct thermal stability testing of undiluted drug product. For further information of high concentration drug product testing, see TA Instruments’ application note “Rapid Thermal Stability Screening of High Concentration Biologic Drugs” [11].
The melting temperature of an oligonucleotide corresponds to the temperature where 50% of the helical duplexes are separated into single-stranded coil formation. The inotersen analogue is a 20-base pair DNA strand with 40% GC content. Excellent reproducibility in melting temperature is achieved for each concentration and a strong, positive correlation exists between concentration and Tm, which shifts more than 7 °C when concentration increased from 1.4 mg/mL to 72 mg/mL (Figure 2A). Similarly, the eteplirsen analogue is a 30-base pair DNA complement with 43% GC content. Melting temperatures range across concentration from 76.79 °C at 1.4 mg/mL to 81.70 °C at 72 mg/mL (Figure 2B). The resulting average Tmax and standard deviation of triplicate experiments for the two oligonucleotides are shown in Table 1.
 20-base pair duplex and B) 30-base pair duplex in Gibco DPBS, pH 7.4. The van’t Hoff plot is shown in the inset for each data set.")
Table 1. Transition temperatures for the 20- and 30-base pair duplex concentration screens. Mean ± SD, n = 3.
| Concentration (mg/mL) | 20-base pair duplex Tmax (°C) |
30-base pair duplex Tmax (°C) |
|---|---|---|
| 1.4 | 69.71 ± 0.21 | 76.79 ± 0.19 |
| 3.6 | 70.81 ± 0.04 | 77.67 ± 0.10 |
| 7.2 | 72.25 ± 0.10 | 78.76 ± 0.06 |
| 14 | 73.83 ± 0.08 | 80.07 ± 0.02 |
| 36 | 76.01 ± 0.05 | 81.69 ± 0.06 |
| 72 | 76.80 ± 0.31 | 81.70 ± 0.34 |
A plot of the reciprocal of the melting temperature as a function of ln(C/4), commonly known as the van’t Hoff plot, is shown in the insets in Figure 2. This plot is based on the van’t Hoff relationship for a non-self-complementary strand where Tm is melting temperature in Kelvin, C is the total DNA concentration, and R is the gas constant (Equation 1).
![]()
ΔHvH and ΔSvH are the van’t Hoff enthalpy and entropy changes, respectively. A linear van’t Hoff is an indication that the enthalpy and entropy of duplex formation are temperature independent. van’t Hoff analysis is often used in DNA UV melt techniques to extract thermodynamic data; however, this type of analysis is modeldependent. This model assumes only two states exist: duplex and coil. In contrast, calorimetry allows the direct measurement of model-independent enthalpy values (ΔHcal). Differences between ΔHvH and ΔHcal are attributed to the presence of non-two-state transitions and contributions from heat capacity changes during DNA melt [12–14].
Formulation Buffer Screening
Familiarity with PCR suggests that increasing cationic salt concentrations are correlated with increased thermal stability for oligonucleotides used in primer selection [15]. It is generally true that increasing salt concentrations result in a higher Tm of the oligonucleotide; however, every sequence and structure is unique, providing the need to test further with DSC. When tested at 10, 20, and 40 mg/mL, the eteplirsen analog showed increased thermal stability when 75 or 150 mM NaCl was added to its phosphate buffer (Figure 3). In the van’t Hoff Plot in the inset, it is clear the sample without NaCl showed a greater concentration dependence than with either 75 mM or 150 mM NaCl. The average Tm and Tonset values of each sample condition are provided in Table 2.

Table 2. Peak maximum transition and onset temperatures for 30 base pair duplex concentration screen. Mean ± SD, n = 4.
| NaCl Conc. (mM) | DNA Conc. (mg/mL) | Tmax (°C) | Tonset (°C) |
|---|---|---|---|
| 0 | 40 | 80.02 ± 0.03 | 72.05 ± 0.13 |
| 20 | 76.36 ± 0.05 | 69.31 ± 0.25 | |
| 10 | 73.32 ± 0.08 | 67.36 ± 0.32 | |
| 75 | 40 | 81.10 ± 0.05 | 72.53 ± 0.35 |
| 20 | 79.47 ± 0.10 | 72.51 ± 0.40 | |
| 10 | 78.06 ± 0.10 | 72.09 ± 0.43 | |
| 150 | 40 | 83.55 ± 0.03 | 76.05 ± 0.05 |
| 20 | 81.89 ± 0.03 | 75.40 ± 0.09 | |
| 10 | 80.34 ± 0.06 | 74.95 ± 0.50 |
Oligonucleotide sequences with the propensity to form non-helical secondary structures are shown to display pH-dependent thermal stability. For example, the i-motif is a tetraplex-type structure in which the basis of formation is dependent on a hemiprotonated C-C+ mismatch and is shown to exhibit greater thermal stability under acid conditions [16]. The etepliresen analog was exposed to varying pH conditions, but unlike oligonucleotides displaying the i-motif, its thermal stability is not affected by pH (Figure 4 and Table 3). Concentration dependence of thermal stability of the DNA duplex remains consistent across the pH range.

Table 3. Peak maximum transition and onset temperatures for 30-base pair duplex concentration screen. Mean ± SD, n = 4.
| pH | DNA Conc. (mg/mL) | Tmax (°C) | Tonset (°C) |
|---|---|---|---|
| 7.0 | 40 | 83.52 ± 0.02 | 76.40 ± 0.20 |
| 20 | 81.81 ± 0.04 | 75.27 ± 0.10 | |
| 10 | 80.47 ± 0.27 | 74.87 ± 0.32 | |
| 7.75 | 40 | 83.51 ± 0.08 | 76.26 ± 0.14 |
| 20 | 81.78 ± 0.04 | 75.69 ± 0.11 | |
| 10 | 80.33 ± 0.02 | 74.55 ± 0.32 | |
| 7.50 | 40 | 83.31 ± 0.01 | 76.13 ± 0.23 |
| 20 | 81.60 ± 0.01 | 75.51 ± 0.15 | |
| 10 | 80.30 ± 0.07 | 74.59 ± 0.12 | |
| 7.75 | 40 | 83.58 ± 0.02 | 76.77 ± 0.12 |
| 20 | 82.00 ± 0.02 | 76.00 ± 0.21 | |
| 10 | 80.34 ± 0.03 | 74.98 ± 0.22 |
Lower Limit of Quantitation
The microfluidic sample chips for the TA Instruments RS-DSC require low sample volumes, and, as such, it is important to understand the lower limit of concentration required to accurately determine thermal melt for oligonucleotides. As a representative example, the 30-base pair duplex eteplirsen analogue at low concentrations in quadruplicate at a scan rate of 2 °C/min was evaluated (Figure 5 and Table 4).

Table 4. Peak maximum transition and signal-to-noise (S/N) for 30 base pair duplex concentration screen. Mean ± SD, n = 4.
| DNA Conc. (mg/mL) | Tmax (°C) | S/N |
|---|---|---|
| 8 | 79.99 ± 0.02 | 52 |
| 4 | 78.91 ± 0.11 | 25 |
| 2 | 77.90 ± 0.19 | 11 |
| 1 | 76.92 ± 0.30 | 5 |
| 0.5 | 75.83 ± 0.16 | 1.7 |
Statistically, the signal-to-noise ratio (S/N) gives an indication of the degree of confidence in a signal being greater than background noise [17]. The S/N ratio (Equation 2) is defined as:
![]()
The S/N for each concentration of the Eteplirsen melt is shown in Table 4.
A S/N ratio of three standard deviations (3σ) is generally the minimally accepted deviation from baseline noise for confidence in the signal being real [17]. The lower limit of quantitation (LLOQ) accounts for 3σ away from mean background and can be determined through Equation 3:
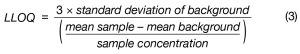
Using this equation, the LLOQ for the 30-base pair duplex on the TA Instruments RS-DSC is 0.5 mg/mL. It is important to note that enthalpy and therefore signal intensity vary with oligonucleotide length, and with changes in the solution environment, including pH and salt concentration [10]. Thus, it should be anticipated that the LLOQ will vary similarly.
Conclusions
Screening the impacts of solution environment and sequence modifications on short-term thermal stability is critical for the development of high-quality pharmaceutical oligonucleotide drug products. The TA Instruments RS-DSC enables high-throughput screening for thermal stability through simultaneous testing of up to 24 samples at formulation strength concentrations. Herein, we demonstrated accurate and reproducible analysis of duplex DNA oligonucleotides, and the rapid determination of buffer component and mutation impacts on overall thermal stability. New algorithms in the data processing software, NanoAnalyze, facilitated the analysis of large quantities of thermal data now accessible with high-throughput screening. Overall, the TA Instruments RS-DSC provides a new platform for characterizing oligonucleotide stability — an important variable in understanding resilience to thermal stress, product quality, and supporting regulatory approval.
References
- “Monitoring DNA Melting using Nano DSC,” TA Instruments, MC157.
- M. Gilar, S. Redstone and A. Gomes, “Impact of mobile and stationary phases on siRNA duplex stability in liquid chromatography,” J. Chromatogr. A, vol. 1733, p. 465285, 2024.
- L. Moumné, A.-C. Marie and N. Crouvezier, “Oligonucleotide Therapeutics: From Discovyer and Development to Patentability,” Pharmaceutics, vol. 14, p. 260, 2022.
- B. P. Vinjamuri, J. Pan and P. Peng, “A Review on Commercial Oligonucleotide Drug Products,” J. Pharm. Sci., vol. 113, pp. 1749-1768, 2024.
- M. Kuroda, Y. Kasahara, H. Yamaguma, M. Oda, C. Nagao and K. Mizuguchi, “Construction of a Tm-value prediction model and molecular dynamics study of AmNA-containing gapmer antisense oligonucleotide,” Molecular Therapy: Nucleic Acids, vol. 35, p. 102272, 2024.
- Promega, “How do I determine the concentration, yield and purity of a DNA sample?,” [Online]. Available: https://www.promega.com/resources/pubhub/enotes/how-do-idetermine-the-concentration-yield-and-purity-of-a-dnasample/. [Accessed 14 03 2025].
- A. Aartsma-Rus and A. M. Krieg, “FDA Approves Eteplirsen for Duchenne Muscular Dystrophy: The Next Chapter in the Eteplirsen Saga,” Nucleic Acid Ther., vol. 27, pp. 1-3, 2017.
- D. Al Shaer, O. Al Musaimi, F. Albericio and B. G. de la Torre, “2018 FDA Tides Harvest,” Pharmaceuticals, vol. 12, p. 52, 2019.
- “NanoDSC: What to Consider when Choosing a Baseline and Model,” TA Instruments, MC154.
- P. L. Privalov, Nucleic Acids. In. Microcalorimetry of Macromolecules, Hoboken, New Jersey: Wiley, 2012.
- “Rapid Thermal Stability Screening of High Concentration Biologic Drugs,” TA Instruments, MC177.
- C. Hofr, N. Farrel and V. Brabec, “Thermodynamic properties of duplex DNA containing a site-specific d(GpG) intrastrand crosslink formed by an antitumor dinuclear platinum complex,” Nucleic Acids Res , vol. 29, pp. 2034-2040, 2001.
- P. J. Mikulecky and A. L. Feig, “Heat capacity changes associated with nucleic acid folding,” Biopolymers, vol. 82, pp. 38-58, 2006.
- P. Wu, S. Nakano and N. Sugimot, “Temperature dependence of thermodynamic properties for DNA/DNA and RNA/DNA duplex formation,” Eur. J. Biochem., vol. 269, pp. 2821-2830, 2002.
- Z.-J. Tan and S.-J. Chen, “Nucleic Acid Helix Stability: Effects of Salt Concentration, Cation Valence and Size, and Chain Length,” Biophys J, vol. 90, pp. 1175-1190, 2005.
- R. A. Rogers, A. M. Fleming and C. J. Burrows, “Rapid Screen of Potential i-Motif Forming Sequences in DNA Repair Gene Promoters,” ACS Omega, vol. 3, pp. 9630-9635, 2018.
- J.-H. Zhang, T. D. Y. Chung and K. R. Oldenburg, “A Simple Statistical Parameter for Use in Evaluation and Validation of High Throughput Screening Assays,” J. Biomol. Screen., vol. 4, pp. 67-73, 1999.
Acknowledgments
For more information or to request a product quote, please visit www.tainstruments.com to locate your local sales office information.
This paper was written by Christine S. Nervig, Ph.D., Viviana Costa, Ph.D., and Samuel Redstone, Ph.D., application scientists at TA Instruments.
TA Instruments and NanoAnalyze are trademarks of Waters Technologies Corporation. EXONDYS 51 is a trademark of Sarepta Therapeutics, Inc. TEGSEDI is a trademark of Akcea Therapeutics, Inc. NanoDrop is a trademark of NanoDrop Technologies LLC. Gibco is a trademark of Life Technologies Corporation.
Click here to download the printable version of this application note.