Keywords: differential scanning calorimetry, duplex DNA, thermal denaturation, nucleic acid structure
MC157
Abstract
Differential scanning calorimetry (DSC) is a powerful analytical tool that can analyze the thermal denaturation of biopolymers, and its ability to measure the unfolding of macromolecules is unparalleled. The Nano DSC (TA|Waters) is highly advantageous due to its sensitivity and ability to accommodate dilute samples in solution. This application note will demonstrate the use of the Nano DSC to measure DNA denaturation at varying concentrations.
Introduction
The DNA double helix is one of the most widely recognized macromolecules.1 Its two strands are held together by several non-covalent interactions that are constantly being broken and reformed during replication, transcription, and general metabolic processes. Most notably, the DNA duplex is held together by complementary base pairing interactions that take advantage of the favorable hydrogen bonding interactions between adenine (A) and thymine (T), and guanine (G) and cytosine (C, Figure 1). Additionally, the double helical structure of the DNA backbone contains both a major and minor groove that directs the binding of proteins contributing to replication, repair, and transcriptional activation.2 Understanding these intermolecular forces has led to groundbreaking advances in molecular biology, pharmacology, and most recently, gene therapy. For more than a half century, differential scanning calorimetry (DSC) has been the premier method to study the inter- and intramolecular forces within DNA.3 Herein, we highlight ability of the Nano DSC to probe melting in duplex DNA.

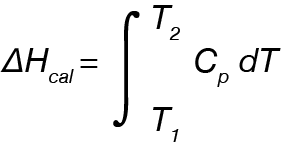
The Nano DSC measures the change in partial molar heat capacity at a constant pressure (ΔCp) as a function of temperature of a given biological system. Put another way, DSC measures the amount of energy required to increase the temperature of the sample by a given amount relative to the reference, which typically consists of buffer. Integrating ΔCp over a range of temperatures provides:

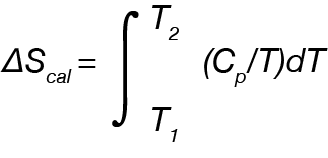
Entropy can then be determined from the area under the curve of Cp/T vs. T:

Finally, the free energy of the system can be determined at a given temperature by the following:

Taken together, DSC can measure strength of non-covalent interactions that hold a macromolecule together. The purpose of this applications note is to highlight the ability of the Nano DSC to measure the melting of medium length DNA oligos (~2,000 bp).
Experimental
A solution of salmon testes DNA (ST-DNA) in DNase- and RNase-free water was purchased from Invitrogen (Long Island, NY). Samples were diluted in 1xPBS (137 mM NaCl, 2.7 mM KCl, 10 mM Na2HPO4, 1.8 mM KH2PO4, pH 7.4) to achieve final concentrations of 0.25, 0.5, 1, 2, and 3 mg/mL before being loaded into the Nano DSC (TA|Waters). Duplicate samples were scanned twice from 40 ºC to 120 ºC at a scan rate of 1 ºC/min. To determine if refolding occurred samples were subjected to a controlled cooling scan from 120 °C to 40 °C at a scan rate of 1 °C/min in between the heating scans. Raw data was normalized to mass and analysis was performed in NanoAnalyze v. 3.12.0.
Results and Discussions
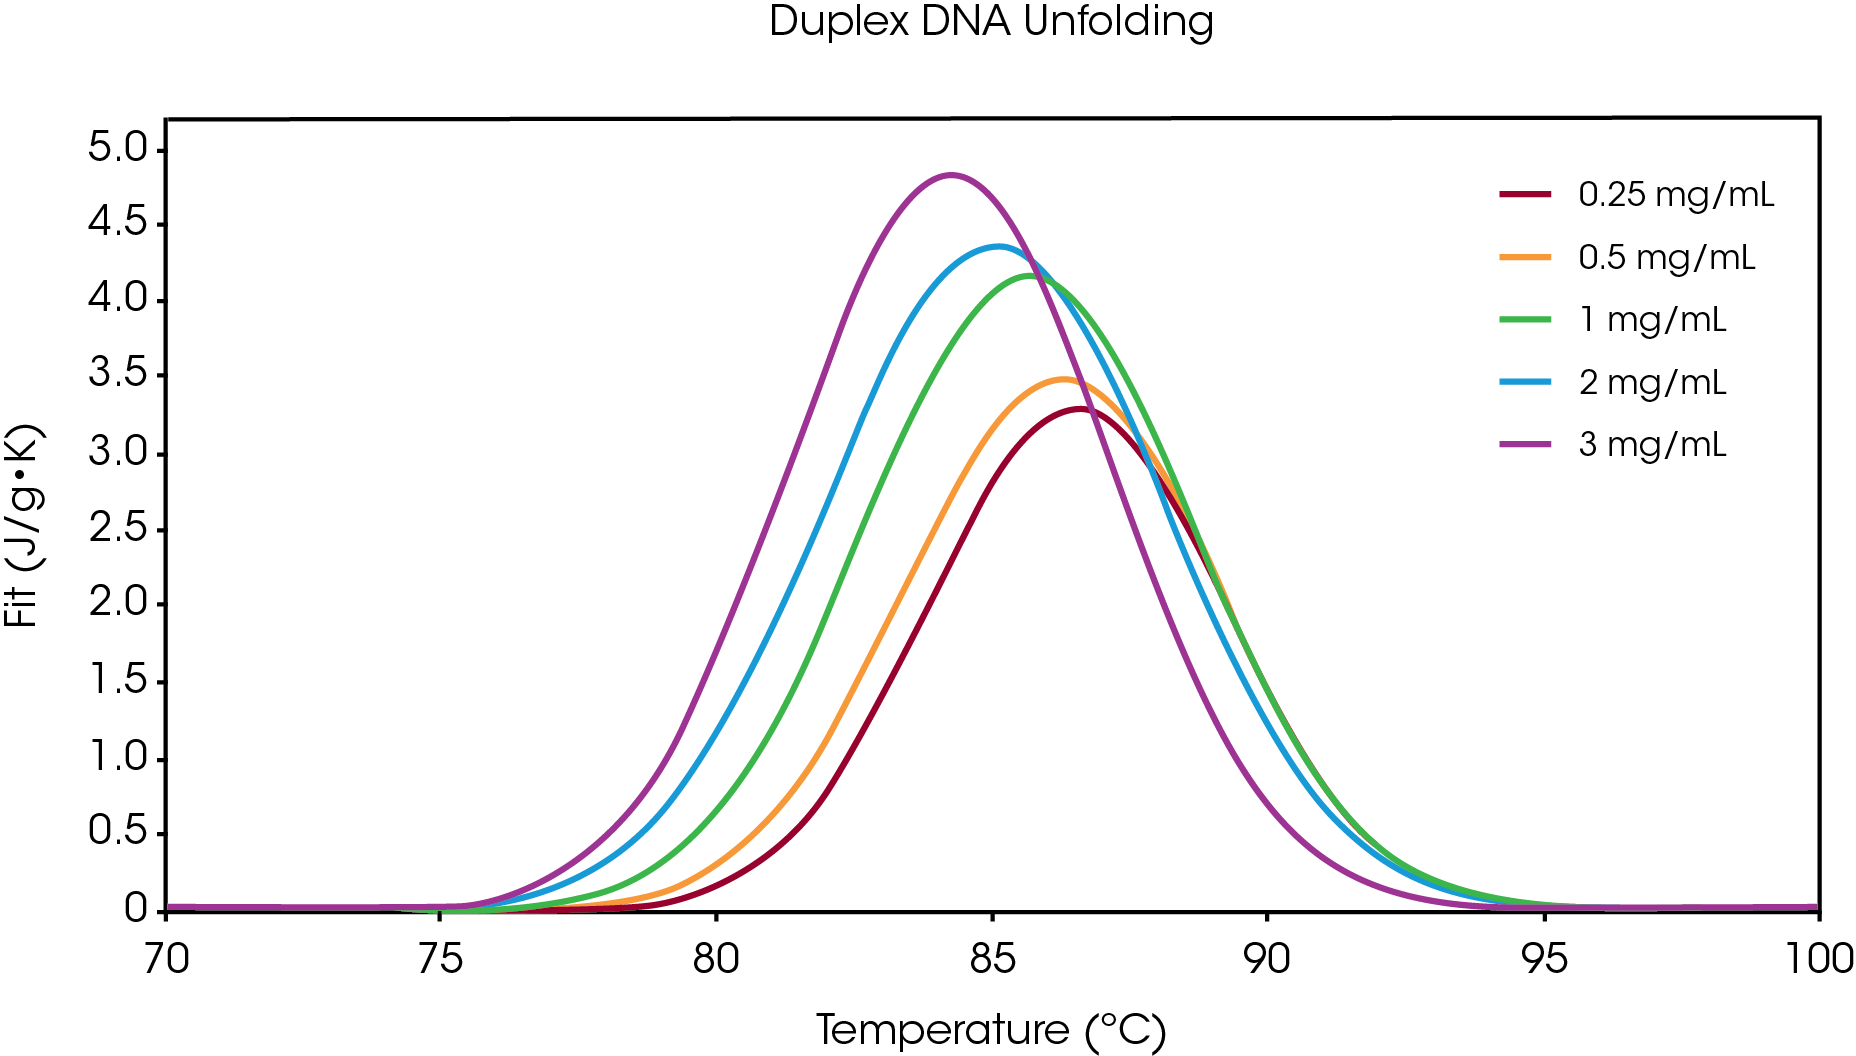
An overlay graph depicting duplex DNA melting at concentrations ranging 0.25 – 3 mg/mL is shown in Figure 2, where the data fit (J/g*K) is plotted against temperature (ºC). All scans show two a single transition that was fit using the Gaussian model. Table 1 provides average TM and area (enthalpy) values for duplicate samples. Under these specific buffer conditions, there was shown to be a positive correlation between concentration and enthalpy (ΔH). Previous experimental data suggests the propensity of more highly concentrated DNA to form aggregate structures.4 Further, there are additional enthalpic contributions towards duplex stability beyond the hydrogen bonding patterns seen in Watson-Crick base paring interactions. Among these non-covalent interactions, base stacking and sequence effects were also observed on the Nano DSC.5-6 Under high concentrations, nucleic acids are also known to “condense” into multimolecular structures,7 which may also contribute to the increased enthalpy seen at high concentrations.
In addition to the concentration-dependent increase in enthalpy, we also observed an inverse relationship between concentration and TM. There are many factors that contribute to DNA thermostability, including buffer composition, salt concentration, and pH.8 The experiments described in this work were completed in non-homogenous sample with DNA that was sheared to ~2,000 bp in length. Each DNA sequence and buffer system exhibits its own unique thermal melting characteristics, and the Nano DSC is well suited for advanced studies. Previous reports show that under certain condition, DNA aggregation may contribute to decreased TM, similar to the observation in this work.9-10 Due to the inherent polymorphic and dynamic characteristics of nucleic acids, DNA melting profiles are highly influenced by concentration and buffer conditions.

Table 1. Average TM and area (enthalpy) values obtained by fitting the data with a Gaussian model.
| Concentration | T (°C) | Area (J/g*k) |
|---|---|---|
| 0.25 mg/mL | 86.54 ± 0.02 | 11.07 ± 0.8 |
| 0.5 mg/mL | 86.23 ± 0.08 | 14.15 ± 1.3 |
| 1 mg/mL | 85.68 ± 0.02 | 31.99 ± 1.6 |
| 2 mg/mL | 85.08 ± 0.01 | 34.21 ± 0.4 |
| 3 mg/mL | 84.26 ± 0.01 | 38.25 ± 2.1 |
Conclusions
In this application note, we used the Nano DSC to monitor ST-DNA melting at a range of concentrations in phosphate buffer.
Notes
Please visit the application notes library on our website for more information about Nano DSC experiments, including information on drawing a baseline and selecting a model in NanoAnalyze.
References
- Watson, J.D., Crick, F.H.C. A structure for deoxyribonucleic acid. Nature, 1953, 171, 964-967.
- Privalov, P.L.; Dragan, A.I., Crane-Robinson, C., Breslauer, K.J., Remeta, D.P., Minetti, C.A.S.A. What drives proteins into the major or minor grooves of DNA? J. Mol. Biol., 2007, 365(1), 1-9.
- Privalov, P.L., Monaselidze, D.R., Mrevlishvili, G.M., Magaldadze, V.A. Heat of intramolecular fusion of macromolecules. Sov. Phys. JETP. 1965, 20, 1393-1396.
- Wissenburg, P., Odijt,T., Cirkel, P., Mandel, M. Multimolecular aggregation of mononucleosomal DNA in concentrated isotropic solutions. Macromolecules, 1995, 28, 2315-2328.
- Marky, L.A., Breslauer, K.J. Calorimetric determination of base stacking enthalpies in double helical DNA molecules. Biopolymers, 1982, 21, 2185-2194.
- Privalov, P., Crane-Robinson, C. Forces maintaining the DNA double helix. Eur. Biophys. J. 2020, 49(5), 315-321.
- Ling, L.-S., Fang, X.-H., Wang, C., Wan, L.-J., Bai, C.-L., Chen, D.M. Direct observation of the DNA multimolecule condensation with fluorescence microscopy. Chem. Lett., 2003, 32(1), 80-81.
- Olsen, C.M., Shikiya, R., Ganugula, R., Reiling-Steffensmeier, C., Khutsishvilli, I., Johnson, S.E., Marky, L.A. Biochim. Biophys. Acta Jen. Subj. 2016, 1860 (5), 990-998.
- Markegard, C.B., Gallivan, C.P., Cheng, C.D., Nguyen, H. D. Effects of concentration and temperature on DNA hybridization by two closely related sequences via large-scale course-grained simulations. J. Phys. Chem. B. 2016, 120(32), 7795-7806.
- Cherstvy, A.G., Kornyshev, A.A. DNA melting in aggregates: impeded or facilitated? J. Phys. Chem. B., 2005, 109(26), 13024-13029.
Acknowledgement
This paper was written by Samuel Redstone, Applications Support Scientist at TA Instruments.
Click here to download the printable version of this application note.

