Keywords: Mixing rules, polymer blends, miscibility, multi-phase systems
RH095
Introduction to the Behavior of Polymer Blend Systems
Complex polymer systems are combinations of different types of polymers which can exist as single or multi-phase systems. The polymers of the components are chosen according to criteria like: – costs,– processing performance,– mechanical properties,–thermal properties, etc… One of the main reasons for combining polymers is effectively costs. Polymer combinations are cost effective since mixing an expensive material with a less expensive one, provides increased performance at a lower price. Polymers are also blended to combine the specific properties of different materials in one. Crystalline and amorphous materials are good combinations. Amorphous materials are transparent and have a better dimensional stability; crystalline materials are stiffer. The combination of a thermoplastic material with an elastomer provides high stiffness and good impact resistance. Combining polymer materials permits to create new material properties, without developing a new material.
How to Develop Complex Polymer Combinations?
A simple approach to modify polymers is to incorporate solid particles or fibers. These components act as reinforcements and increase the strength of the material.
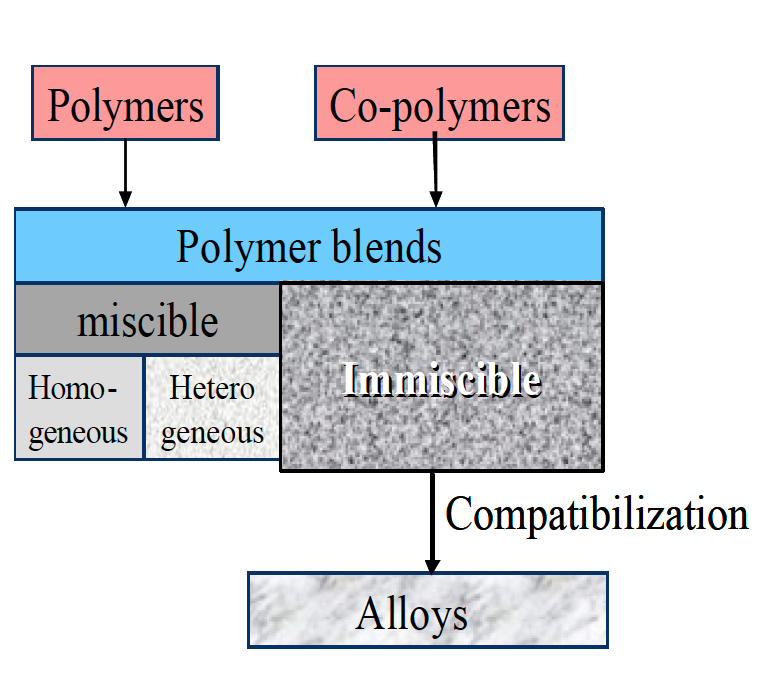
Combining chemical different types of polymers in a melt mixing process to form a polymer blend however increases considerably the possible material and property variations. Material combinations can be miscible or immiscible (Figure 1). The miscible blends can be combinations of polymers of the same kind (homologous) or of different nature (heterogeneous). Immiscible polymer combinations are multiphase systems. The morphology plays an important role and significantly influences the final material properties. Properties can be modified using compatibilizers such as co-polymers to change and stabilize the morphology of the blends.
Why do polymers mix?
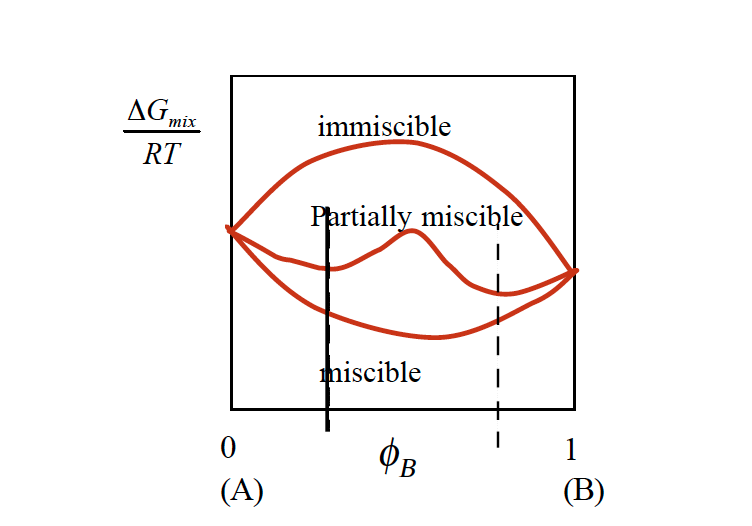
Whether polymer mix or demix spontaneously depends on the free energy of mixing. If the free energy is negative, the polymers mix at a microscopic level and develop a single phase.

Most polymer combinations are immiscible. The reason for this is the entropy term, which does contribute little to the free energy. Polymers have already a high degree of disorder, adding a different polymer causes no significant change in entropy. Therefore, the mixing enthalpy has to be negative in order to make polymer spontaneously mix. Many polymers are miscible when a small amount of the other component is added, but immiscible for high loading content of each species. The temperature also has a strong effect on the miscibility of a blend. These material combinations are referred to as partially miscible (figure 2).
Properties of polymer blends
When polymers are combined, it is most important to understand how the materials properties will change as a function of the composition. A key objective of the application research is to develop mixing rules for the desired material properties.
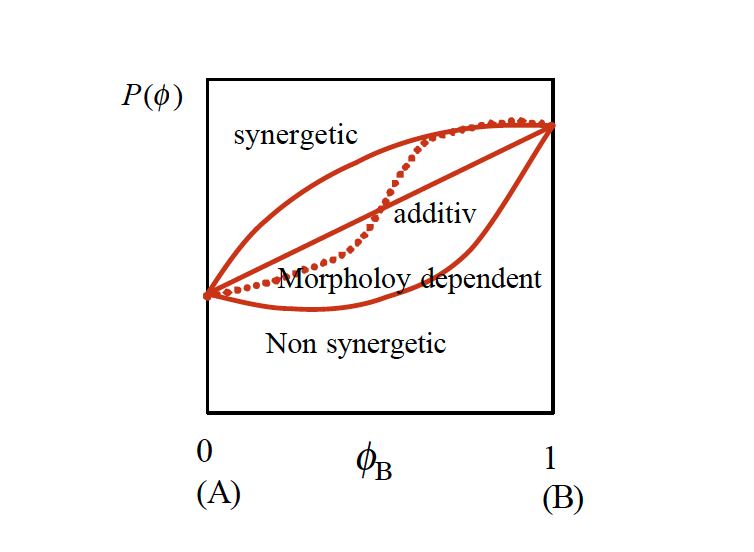
These mixing rules are hardly ever linear. They may be synergetic, that means the desired property increases strongly with the volume fraction of the minor component or non synergetic when the property deteriorates (figure 3). The typical mixing rule includes the contributions of each component as well as an additional interaction term.

ɸB is the volume fraction of component B. Typical material properties are the material’s viscosity,– the glass transition Tg,– or any other mechanical or physical property. For immiscible blends, the mixing rule can be extremely complex due to the morphology which may develop.
Rheology of Homologous Blends
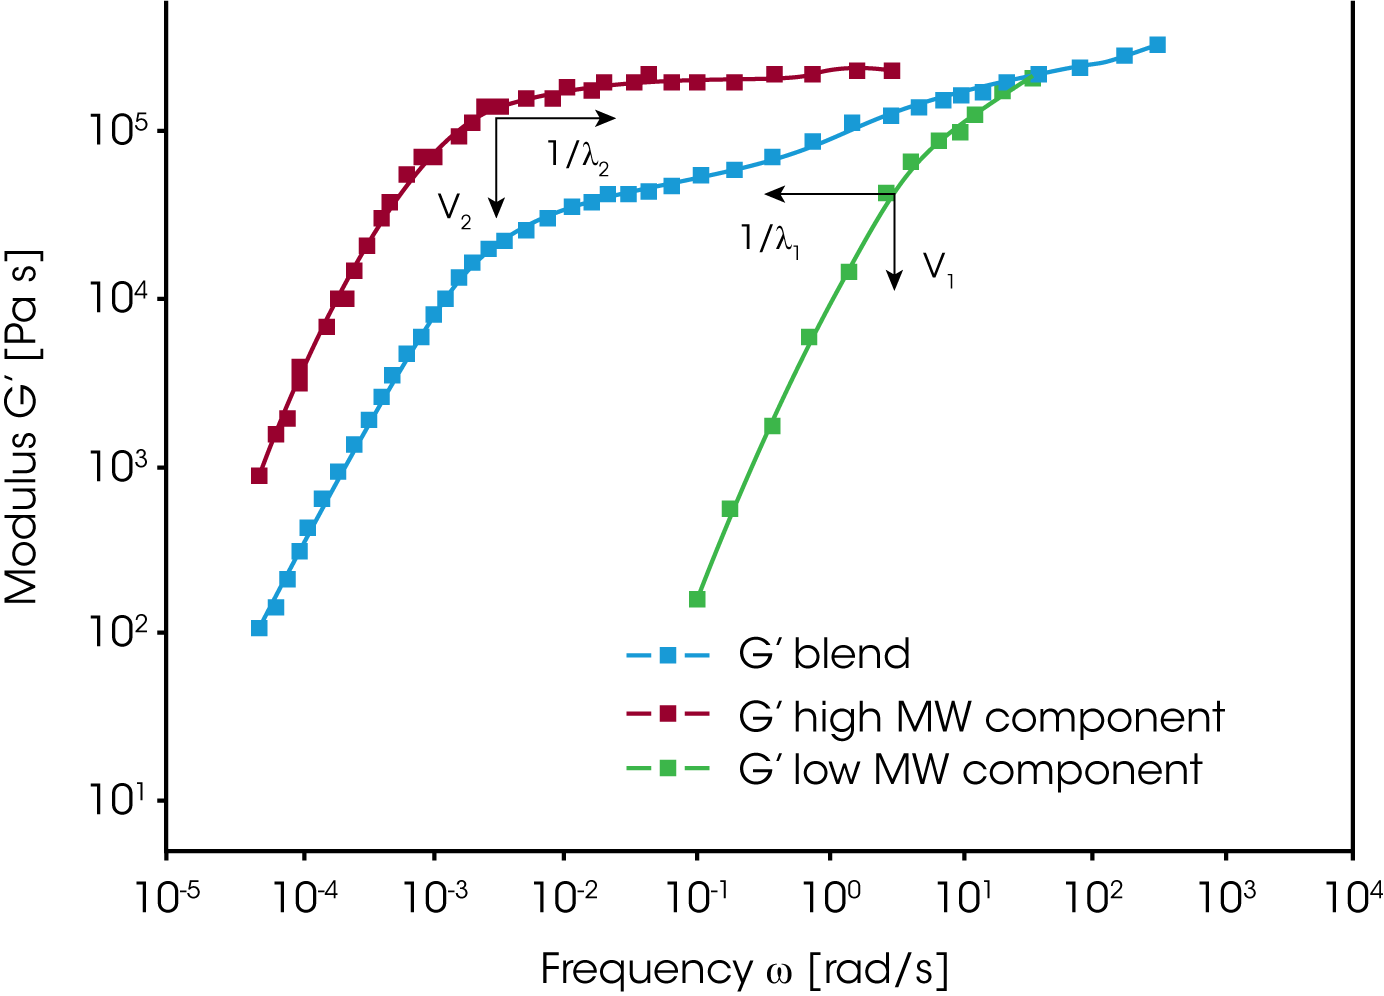
Combining homo-polymers is a frequently used method to adjust the viscosity and elasticity of polymer melts. This approach can also be used to investigate the contributions of different size polymer chains to the rheological response of a material. In the composite curve of the storage modulus in figure 4, the contributions of the two polymer components can be easily seen. The terminal region is located between the terminal regions of the individual components – which means that the relaxation times of the high MW component are reduced, and those of the low MW component increased. The volume fraction determines the height of the second plateau. The modulus i.e. the relaxation time spectrum for the mixture of monodisperse homo-polymers can be described as a function of the mixing ratio and a shift factor for the individual components.
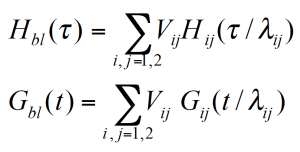


For a binary blend with ɸB, the volume fraction of the high molecular weight component, the formula for a simple linear and a quadratic mixing rule are given in (4) and (5). In order to check, the validity of these simple mixing rules, the weight factor V22 is plotted as a function of the weight fraction of the high molecular weight component. V22 has been obtained from the relaxation time spectrum, reduced to a simple box-distribution, as shown in the figure 5. /1/ It can be seen, that the experimental data fall in between the limits of the linear and quadratic mixing rule – thus none of these rules describes the experimental findings. The shift factors ʎ11 und ʎ22 were found to be also dependent on the weight fraction. In addition the higher MW shift factor ʎ22 scales with MZ, which means that the high MW component has a stronger influence on the rheology of the blend /1/.

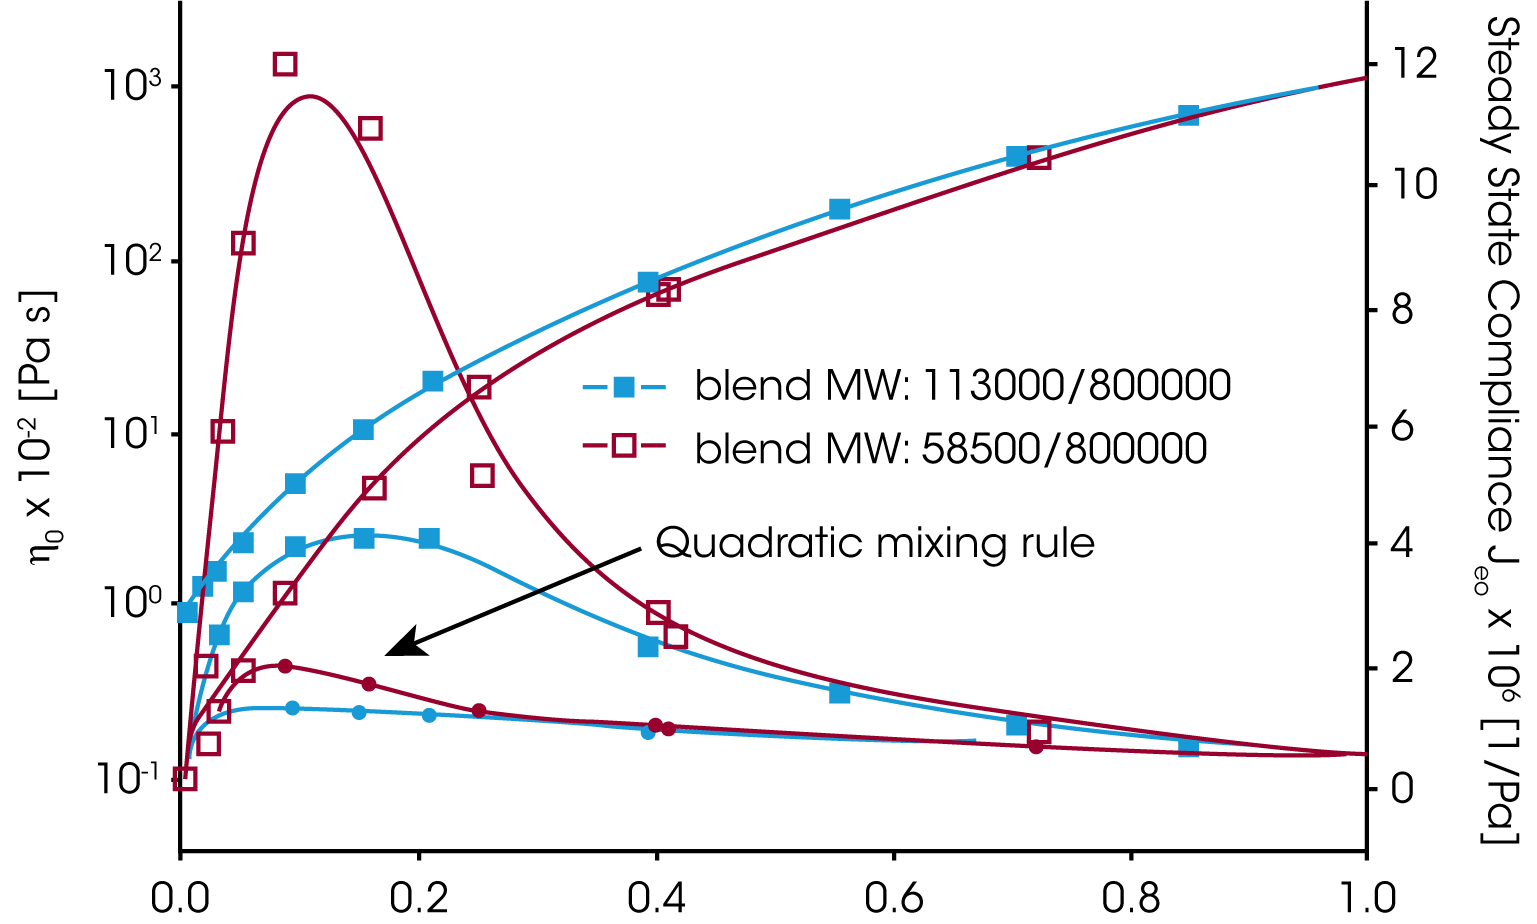
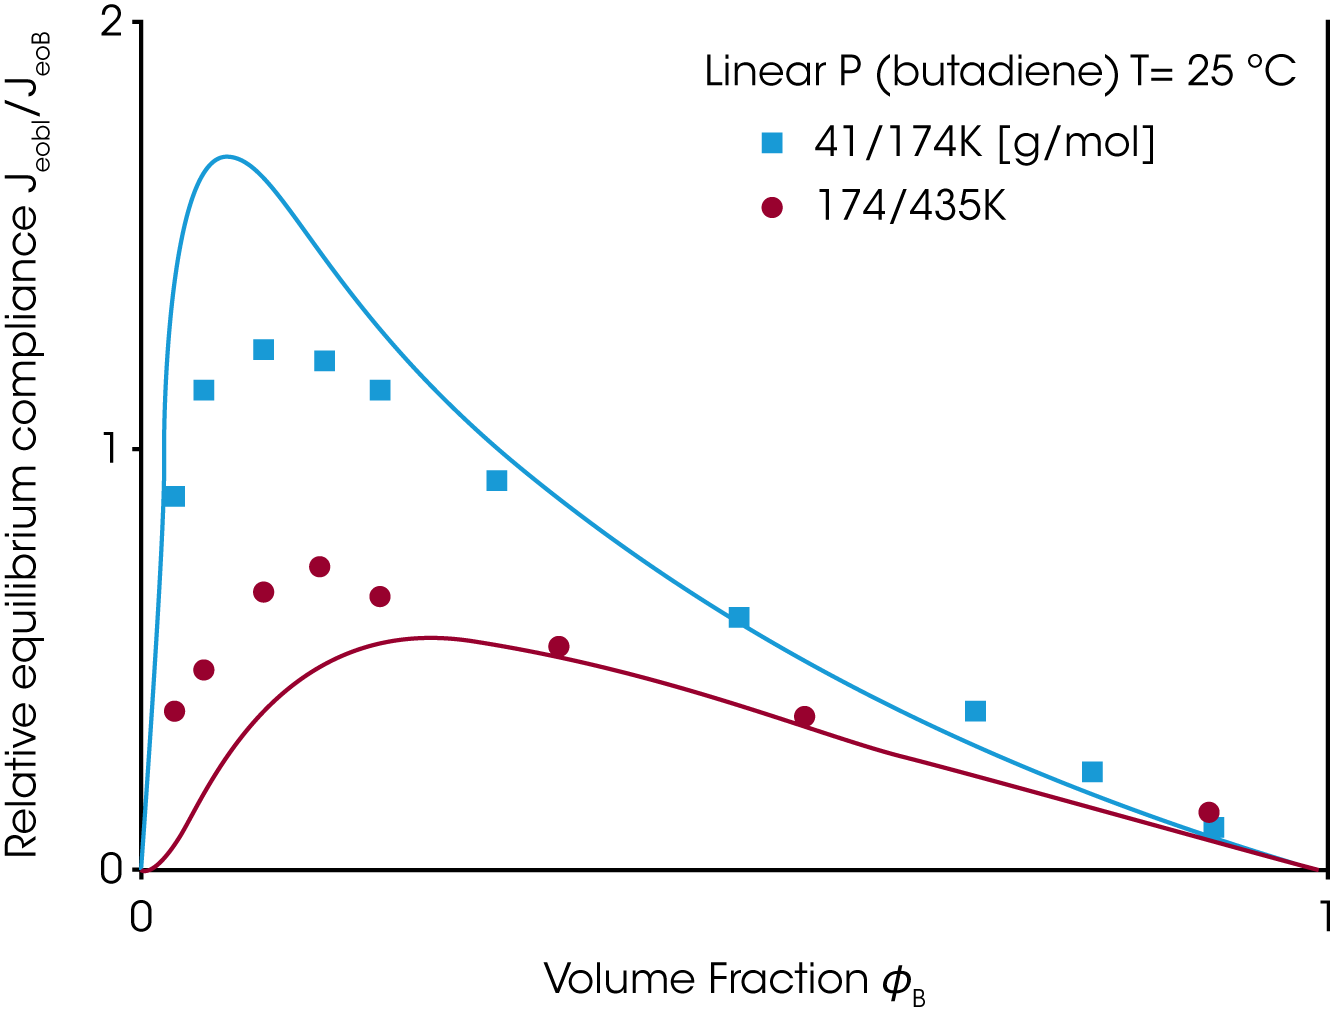
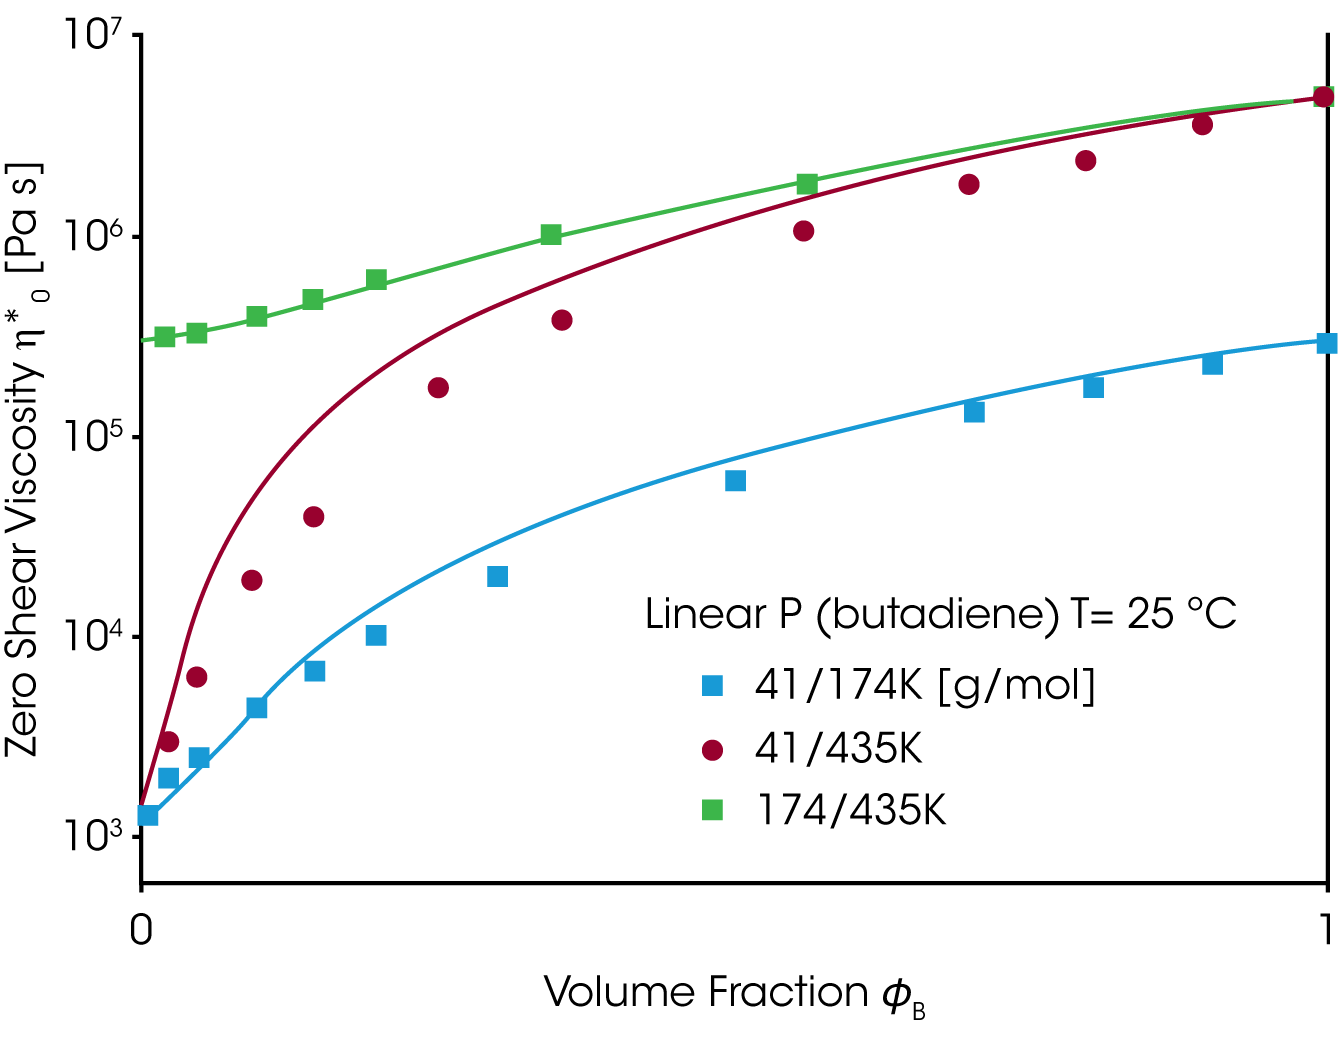
A good material property to check the mixing rule, is the zero shear viscosity ƞo and the equilibrium compliance Jeo. Whereas the viscosity increases with the weight fraction of the high molecular component ɸB the equilibrium compliance goes through a maximum at low content of the high molecular weight component (Figure 6). Neither the linear or quadratic mixing rules describe the equilibrium compliance.
Based on the reptation theory /2,3/ Haley has derived a mixing rule for the modulus and the viscosity as follows:
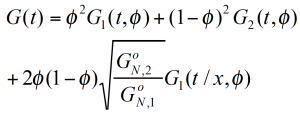

The reptation model is quadratic in the weight fraction and includes a complex interaction term. τ1 and τ2 are the monodisperse relaxation (reptation) times for the two components of the blend /2/. ζ is the local friction factor and Me the entanglement molecular weight.
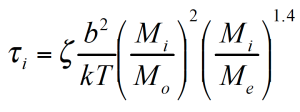
The viscosity and the equilibrium compliance as a function of the high molecular weight component are much better predicted by this modified mixing rule and shown in figure 7.
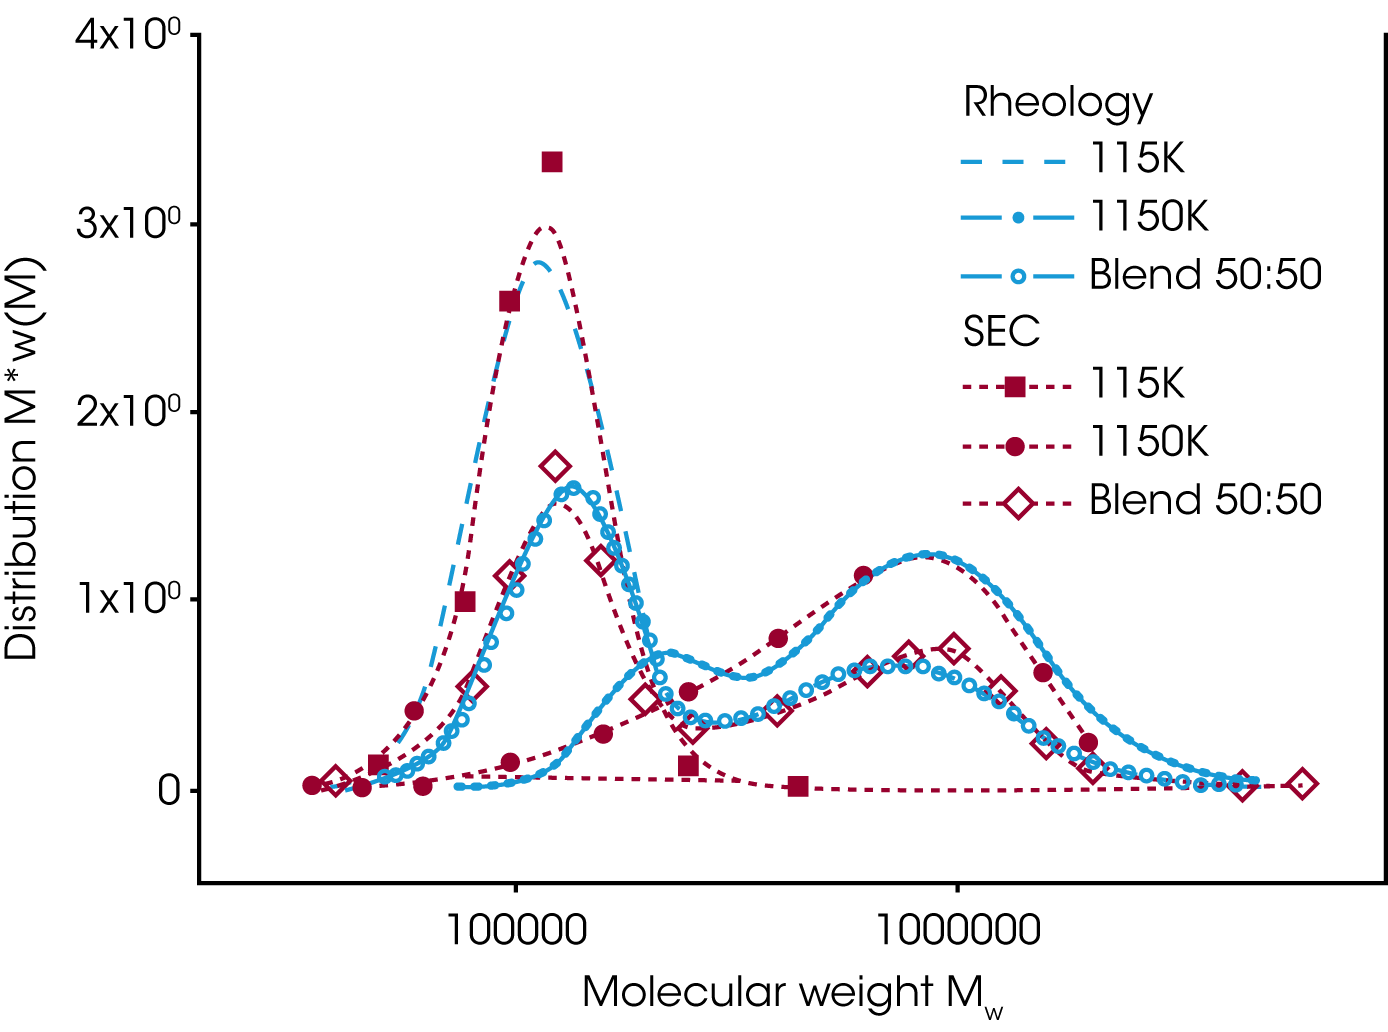
The mixing rule from Tsenoglou has been extended /4/ and the weight fraction of the high molecular component replaced by the molecular weight distribution w(M). The extended mixing law is used to obtain the MWD from rheological data. Figure 8 shows the MWD for a bimodal distribution blend of two PS with different molecular weight, extracted from the relaxation time spectrum i.e. dynamic data G’ and G’’/5/. For reference, SEC data have been plotted also. Good agreement between the results from SEC and Rheology have been obtained.
Rheology of Heterogenous Miscible Polymer Blends
Heterogeneous polymer systems are composed of polymers of different chemical nature and glass transitions Tg. Completely miscible heterogeneous blends exhibit only one Tg, which is located between the Tg of the pure components. Typical miscible blends are PS/PVME (Polystyrene/Poly(vinyl methyl ether)), PSAN/PMMA (Poly(styrene sacrylnitrile)/ Poly(methyl methacrylate)), PEO/ PMMA (Poly(ethylene oxide)/Poly(methyl methacrylate)), PB/PIP (Polybutadiene/Polyiso-prene), etc…
Miscible heterogeneous blends have been found not to scale with the mixing rules developed for homologous polymer combinations. Also miscible blends have only one Tg like homopolymers, the Tg is a strong function of the composition, often asymmetric and broader than the Tg of the pure compnents. Heterogeneous blends furthermore do not follow the time temperature superposition and as such are thermo-rheological complex.
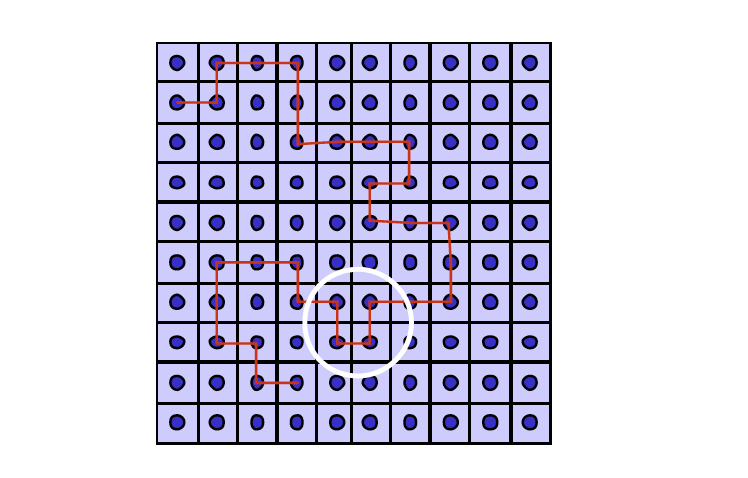
Due to the connectivity of the monomers along the main chain, local self concentration of the chemical different components leads to concentration fluctuations in the fluid phase /6/ as shown in figure 9. The self-concentration is defined as the volume of a Kuhn segment divided by the volume given by the length3 of one Kuhn segment. Since polymers with a low Tg are more flexible, they have a higher self concentration (ɸB for PI=0.45). As a result of the self concentration effect, the polymer components locally behave more like in the pure polymer and the segmental dynamics in the blend therefore are not only temperature, but also dependent on concentration.
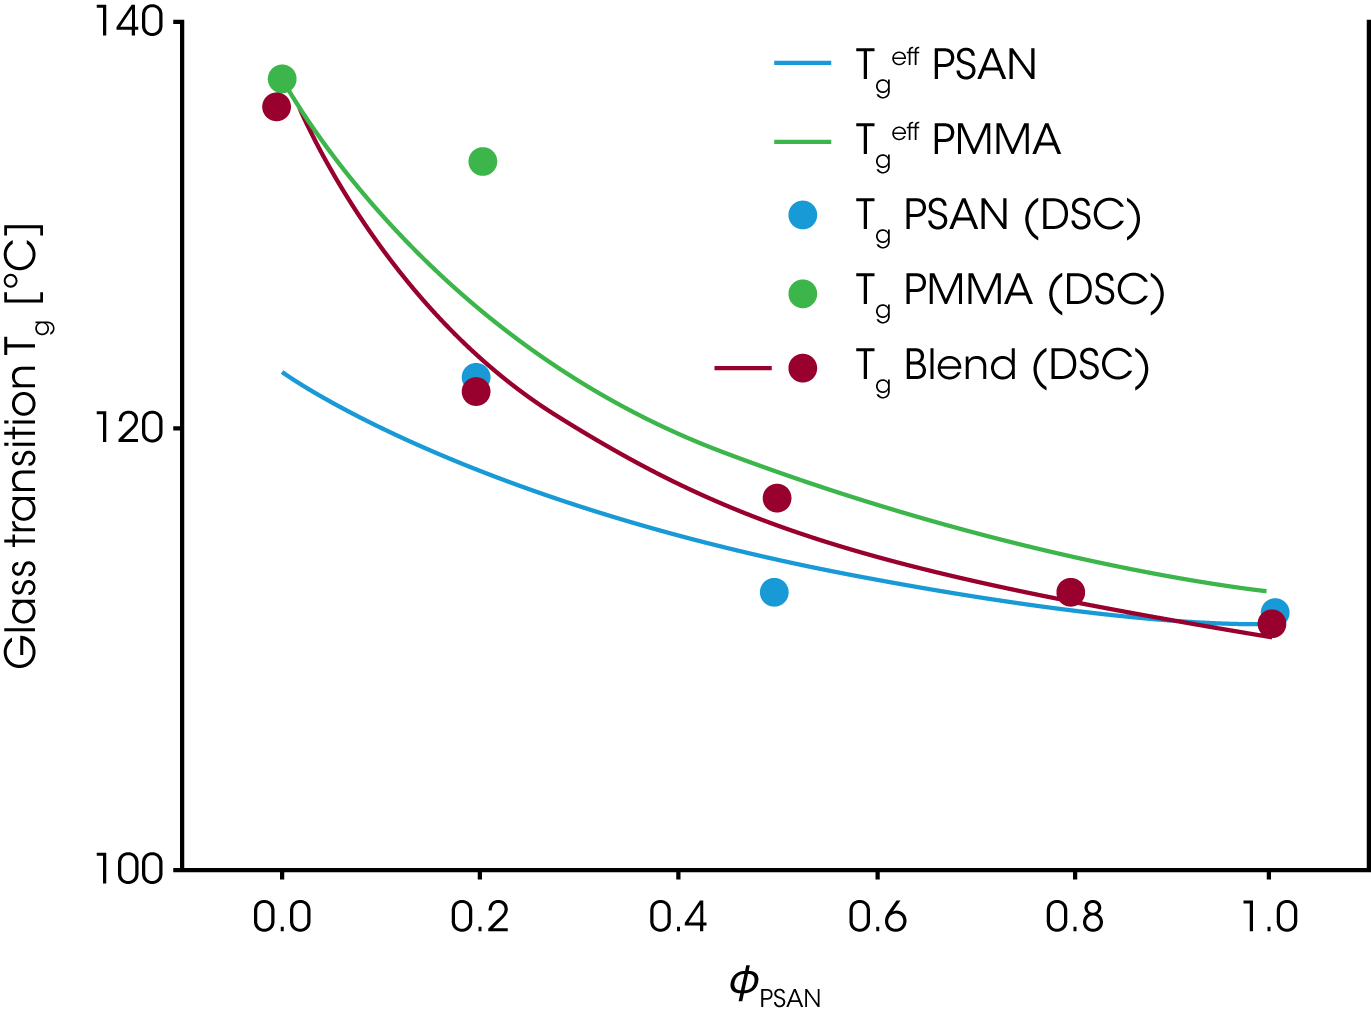
The figure 10 shows the experimental Tg(ɸ) for the PMMA/PSAN blend obtained from DSC measurements. The envelop curves represent the effective glass transitions Tgeff which are the Tg at the effective local composition ɸeff adjusted for the self concentration ɸs.
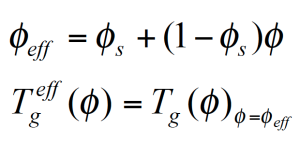
Since low Tg components are more flexible, the self concentration ɸs is higher and the local dynamics in the mixture are more like in the pure component; – the local Tgeff being suppressed in comparison to the experimental Tg of the mixture.
High Tg components have a lower ɸs and the local dynamics in the mixture are more representative of the dynamics of the mixture itself. Therefore the Tgeff follows much closer the Tg of the mixture. Due to the local variation of Tg with the volume fraction, the experimental Tg broadens as the concentration of PSAN decreases in the mixture.
As a consequence of the local concentration fluctuations, the local friction coefficient varies with the volume fraction also.

ζ is now a function not only of temperature, but also of the relative concentration of the components. The representative relaxation (reptation) time (equation 8) /7/ for each component has to be corrected for the friction factor. The Me molecular weight at the volume fraction ɸ is calculated from the individual components as follows:

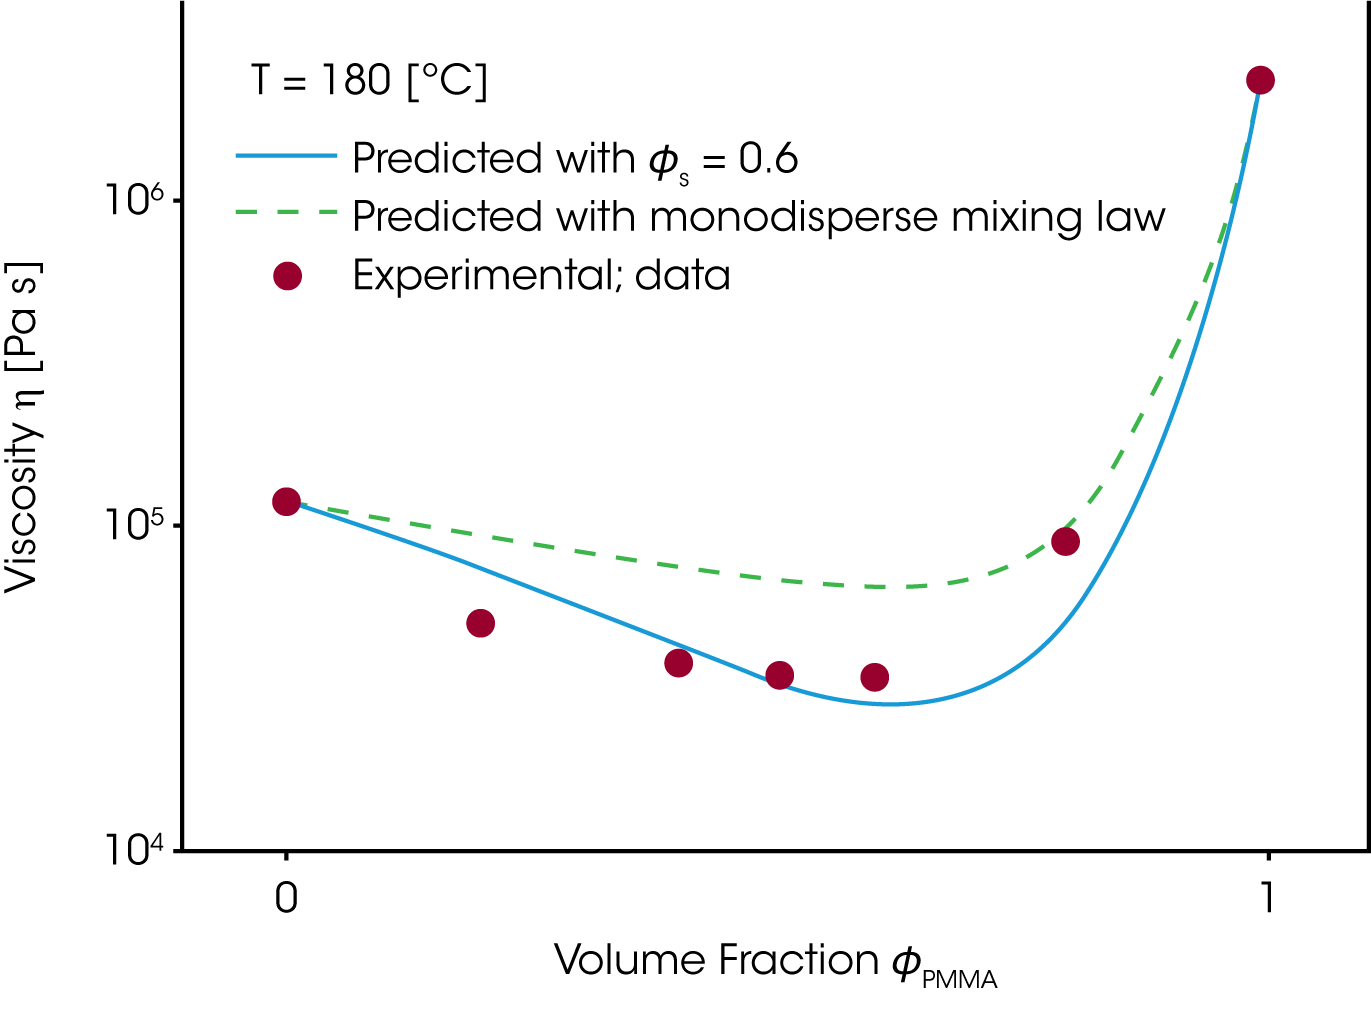
The time constants for the component A and B in the mixing rule, i.e. the mixing rule from Tsenoglou, developed for the homologous blends, can now be replaced and the rheological behavior of the blend as a function of the relative composition calculated. The viscosity for the PMMA/PEO blend (figure 11) has been predicted for a self concentration of ɸσ = 0.6. PEO is a small monomer and as such quite flexible, which is reflected in the high self concentration value /8/.
Rheology of Immiscible Blends
Most polymersystems are not compatible and as such immiscible. Their blends are multiphase systems and as such often have a complex morphology. In order to obtain for example the desired mechanical properties, these blends need to be modified further using a co-polymer to improve the adhesion at the interface. Both, compatibalizers and the flow during processing are important to change and stabilize the morphology – thus improving the physical properties of these complex polymer systems. The properties control-led by blending include surface properties, impact resistance, thermal properties, dimensional stability, gas barrier, and ease of processing.
Dynamic mechanical response of a PS/PMMA blend
A good example of an immiscible blend is the PS/PMMA combination. In the following study /9/ PMMA is the continuous phase and PS is the dispersed phase in form of spherical inclusions. The blend was prepared in a melt mixing process using an extruder.
The PS and PMMA samples were chosen to have similar rheological properties in the frequency response (similar relaxation time spectrum).
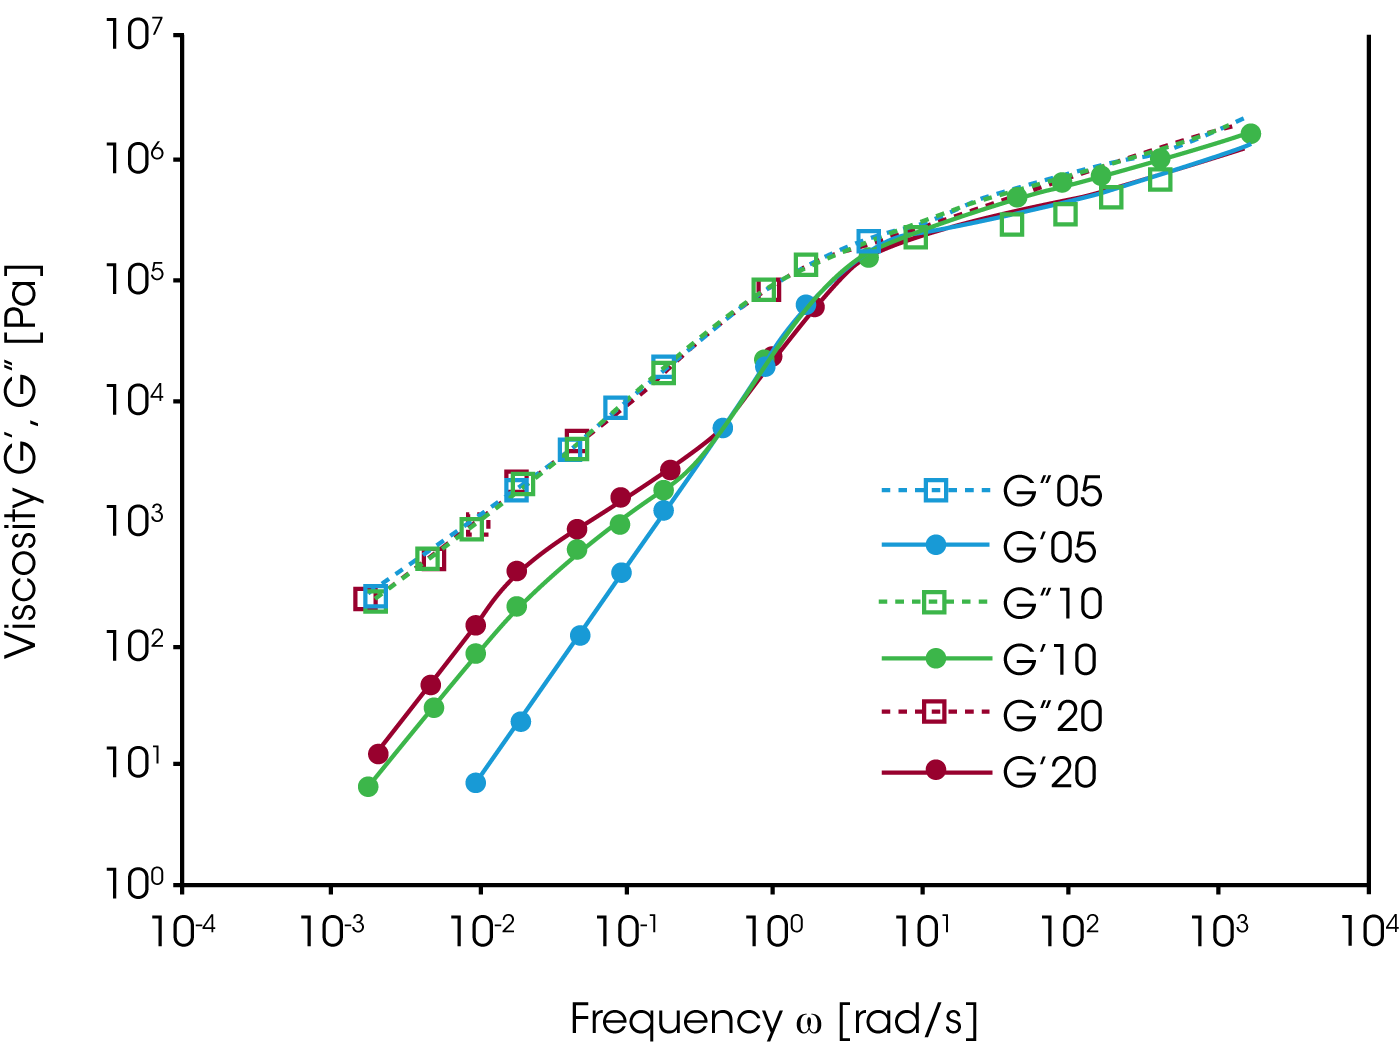
To characterize the blends, frequency dependent oscillation measurements on samples of 5, 10 and 20% of PS as the dispersed phase have been performed. The storage modulus G‘ in figure 12 shows an additional relaxation at low frequency, which increases with the concentration of the dispersed phase.The magnitude of the additional low frequency relaxation seems to correlate with the volume fraction of the minor phase.
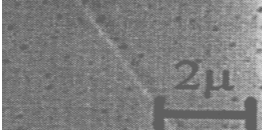
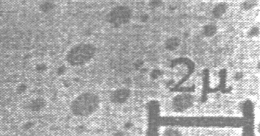
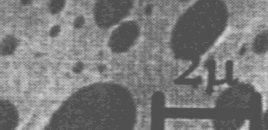
TEM (Transmission Electron Microscopy) pictures show an increase of the size of the spheres of the dispersed phase as well as a broadening of the distribution of particle sizes with increasing PS concentration. The extensive increase of the elasticity of the blend, due to a higher G’ contribution at low frequency in comparison to the pure components, has to be attributed to energy storage mechanisms of the morphology itself. Mechanical energy is stored as interfacial energy while the spherical inclusions are deformed, and then dissipated as they recover to the original spherical shape. Since the PS domain relaxation is slow, it can be separated from of the fast relaxation of the components. The energy storage mechanism is the interface tension; the energy dissipation mechanism is the friction at the interface.
How can these experimental findings be modeled and accounted for in mixing rules to predict the rheological behavior of immiscible blends? Consider the simplest multiphase system, which is a hard sphere in a Newtonian fluid. According to Einstein /10/ the viscosity increase in such a system is a hydrodynamic effect and depends on the volume fraction of the added particles only. If the solid particles are replaced by deformable droplets of a Newtonian fluid, the system exhibits a viscoelastic response with a relaxation time which depends on the viscosity of the continuous phase and the interface tension. A simple model for the viscosity and the normal stress for an emulsion of two Newtonian fluids has been derived by Choi and Schowalter /11/. For immiscible polymer systems, the mixing rule can be modified to include the phase relaxation phenomenon as:

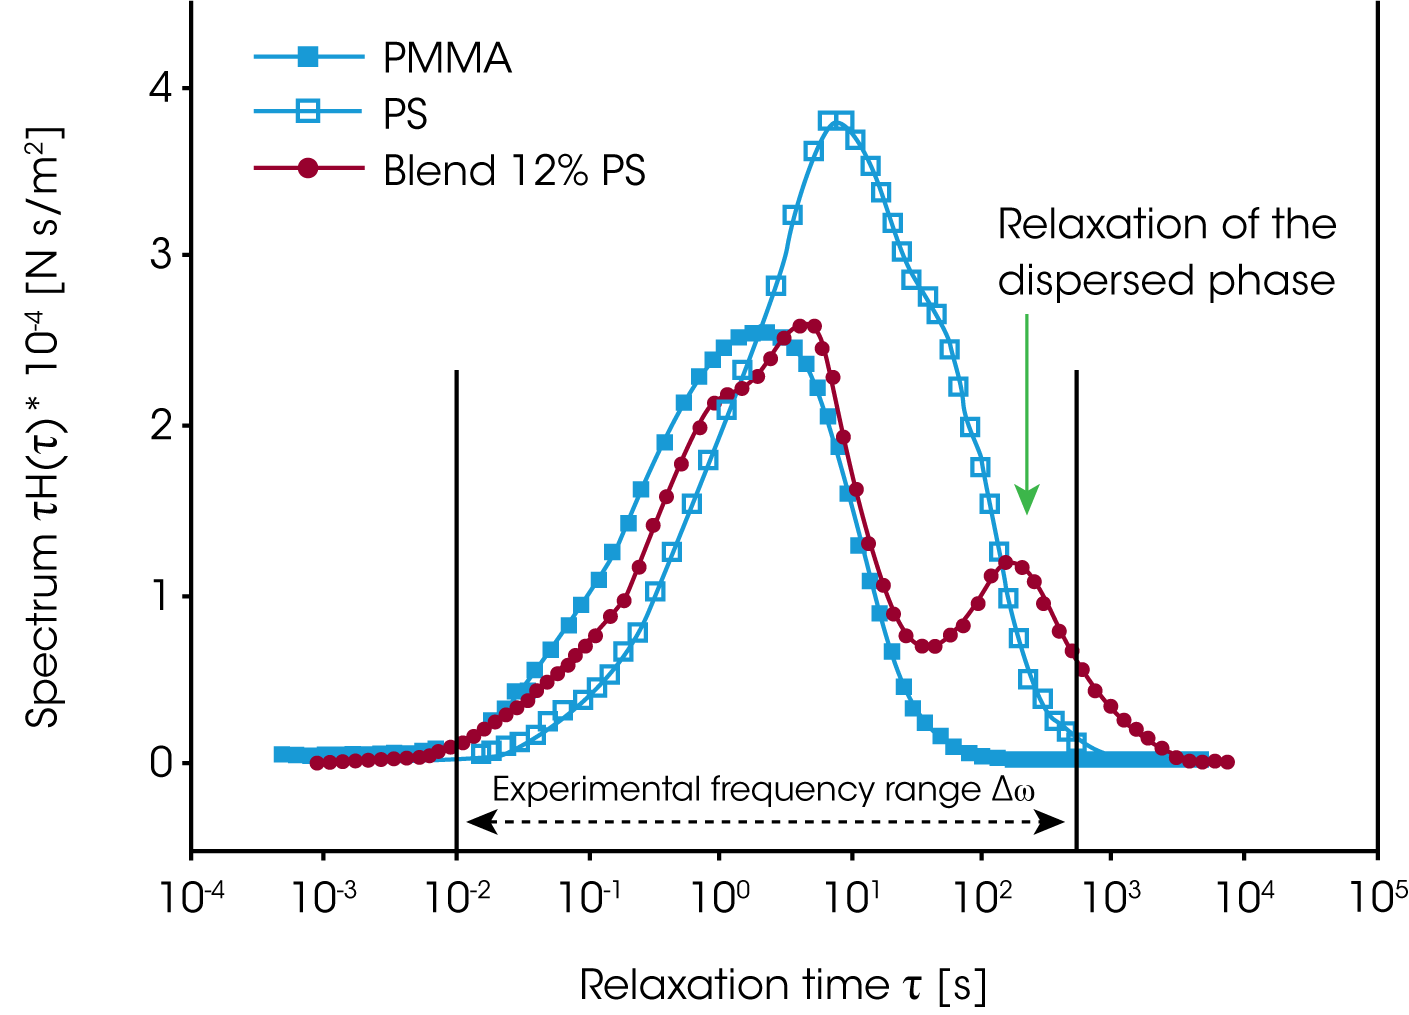
For the PMMA/PS blends investigated, the relaxation of the phase is much slower, then the component relaxation. Gramespacher et al. /12/ extracted the relaxation spectrum from the experimental moduli G’ and G” and plotted the weighted spectrum τH(lnτ) vs. the relaxation time as shown in figure 13. The characteristic phase relaxation time was determined from the second maximum of the spectrum and the interface tension Γ was determined from:

Here ɑ represents the drop size. Note: in order to obtain the average particle size, the interface tension must be known and the interfacial tension can be calculated if the average particle size is known .
Monitoring the change of particle size during flow using rheology
Immiscible blend are difficult to mix at a microscopic level. Mechanical energy has to be introduced to mix the components and to offset coalescence. The resultant droplet size is a function of the energy input, the applied flow conditions, etc… Can rheology be used to monitor the evolution of particle size under defined flow conditions?
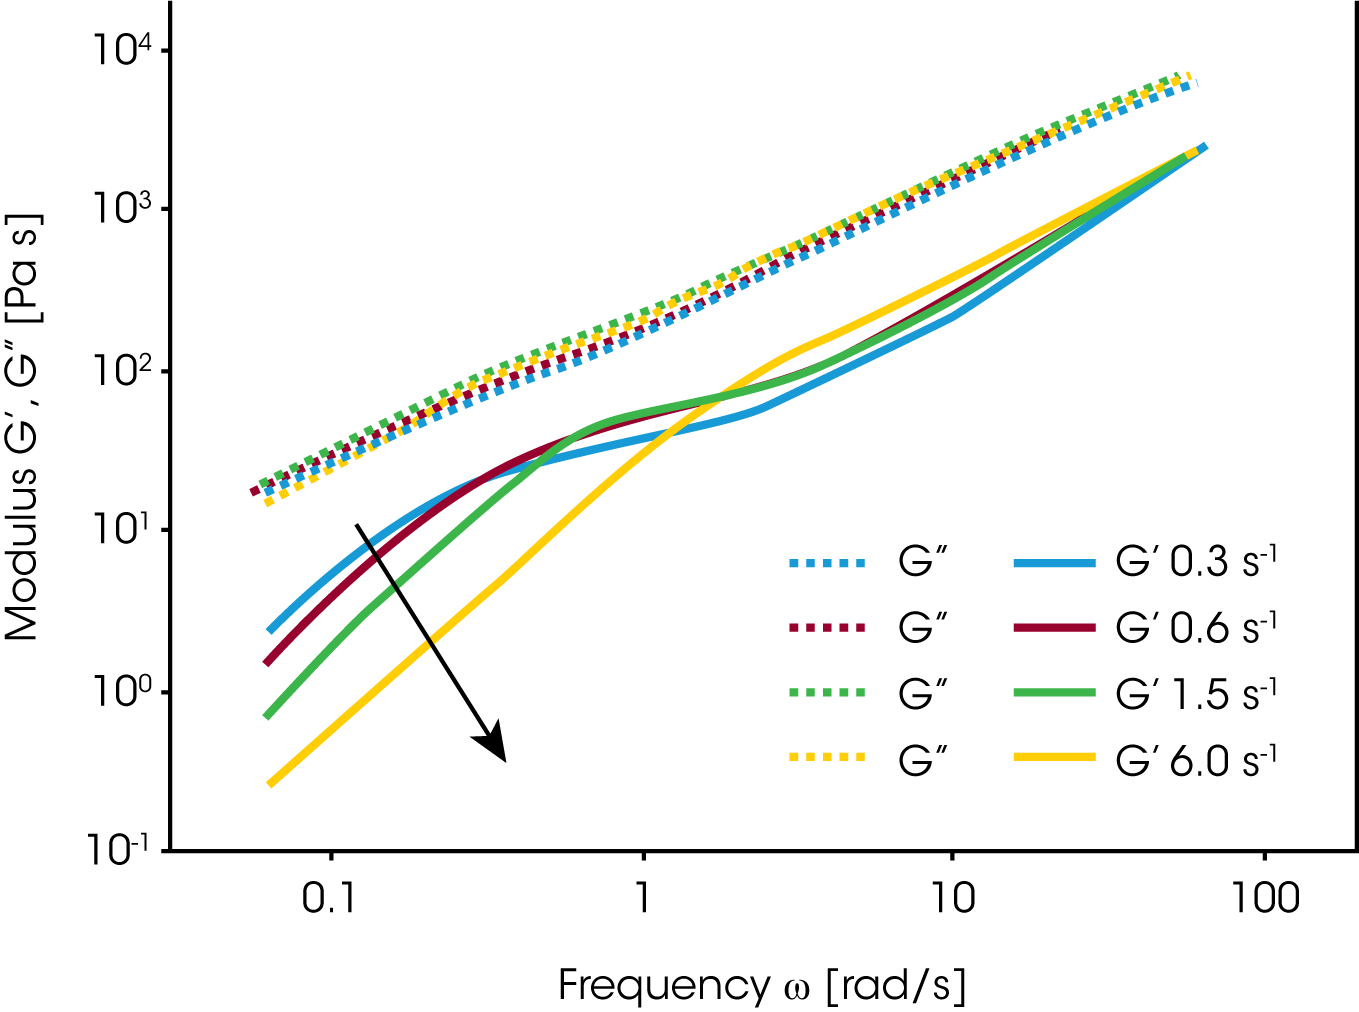
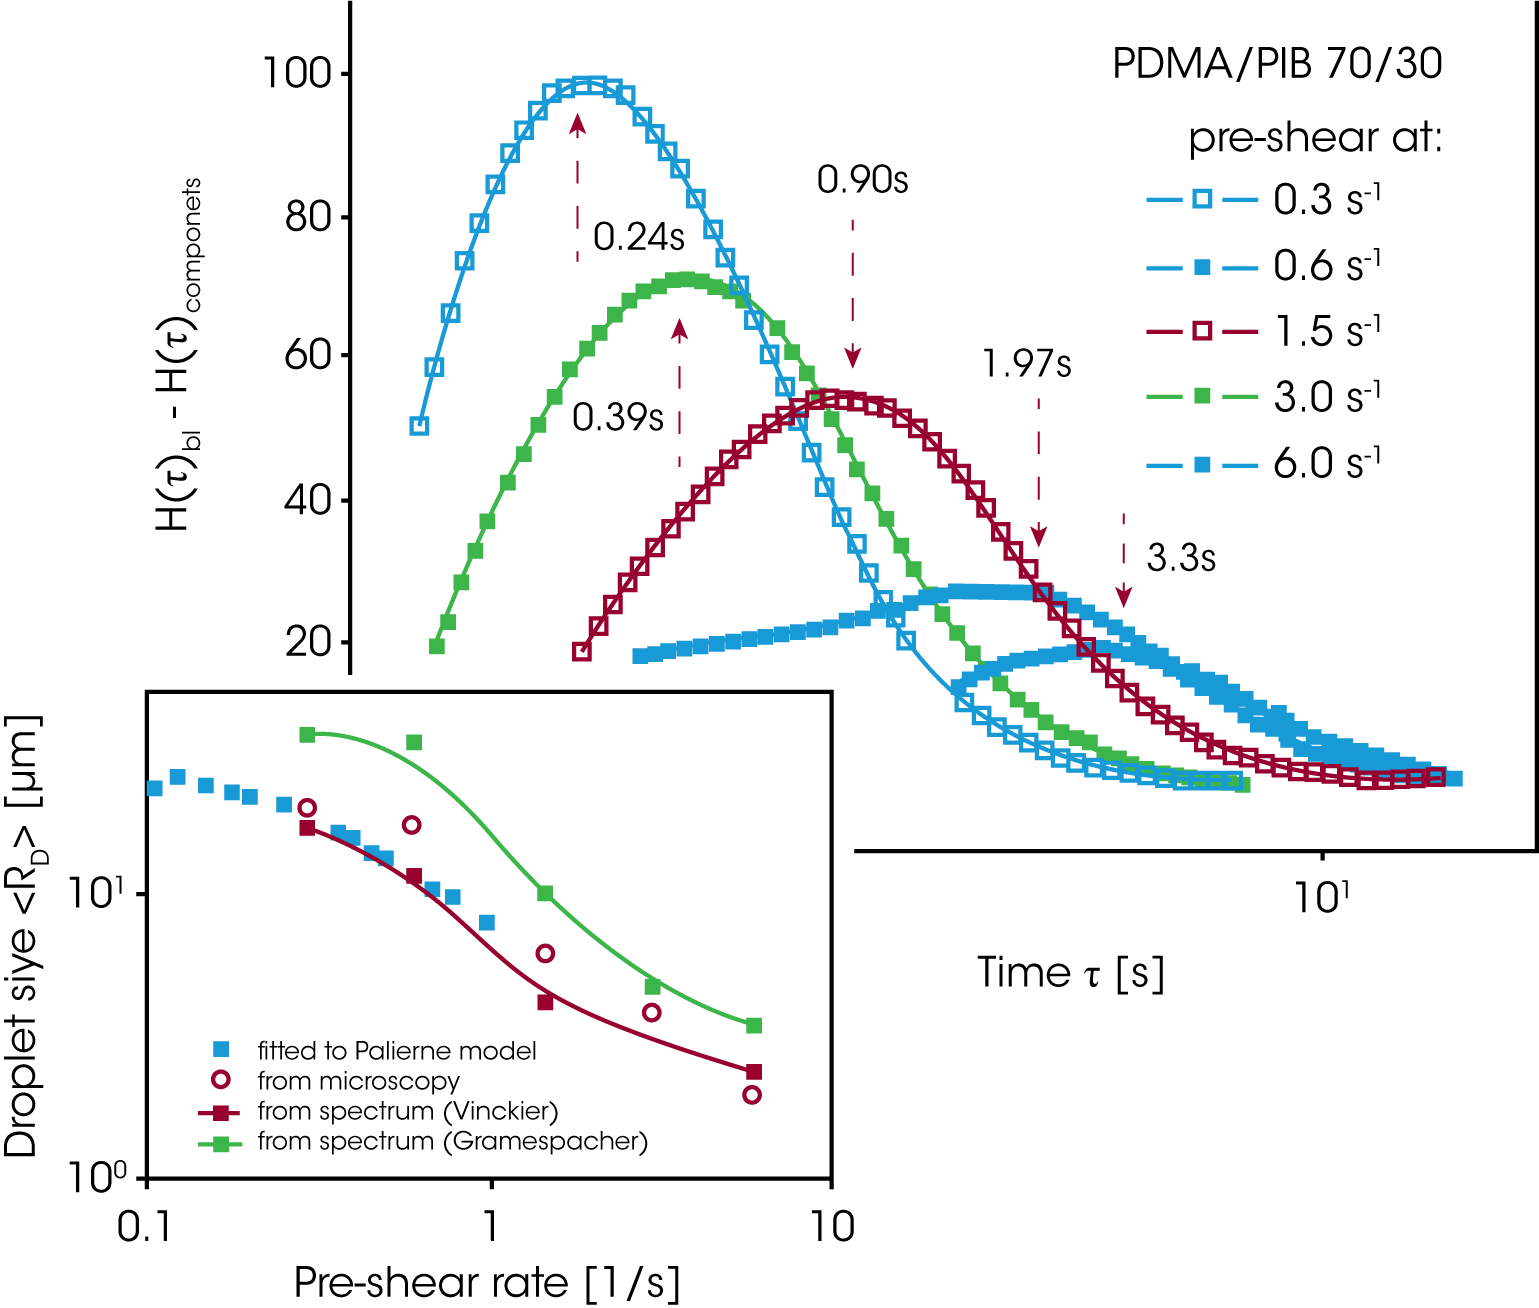
Vinckier et al. /13/ have studied the immiscible blend of PDMS and PIB (70/30) in oscillation as a function of pre-shear conditions. In figure 14, the dynamic modulus G’ at low frequency has a maximum at the lowest shear rates for the additional phase relaxation. Under these conditions the dispersed PIB droplets are large and the interface can store a lot of mechanical energy. With increasing pre-shear rate the elastic contributions decrease; this has to be interpreted as a break-up of the particles. Palierne /14/ proposed a emulsion model which is an extension of the Choi & Schowalter model to viscoelastic fluids. Graebling /15/ derived following expression for the average particle size:

Figure 15 shows the excess relaxation spectrum extracted from the oscillation data in figure 14. In order to emphasize the effect of the phase relaxation, the contributions for the component relaxations have been subtracted, assuming a linear mixing rule. The average droplet size shown in figure 15 is calculated from the droplet relaxation time (peak values) using equation 14. The drop size obtained decreases by one order of magnitude due to droplet break-up.
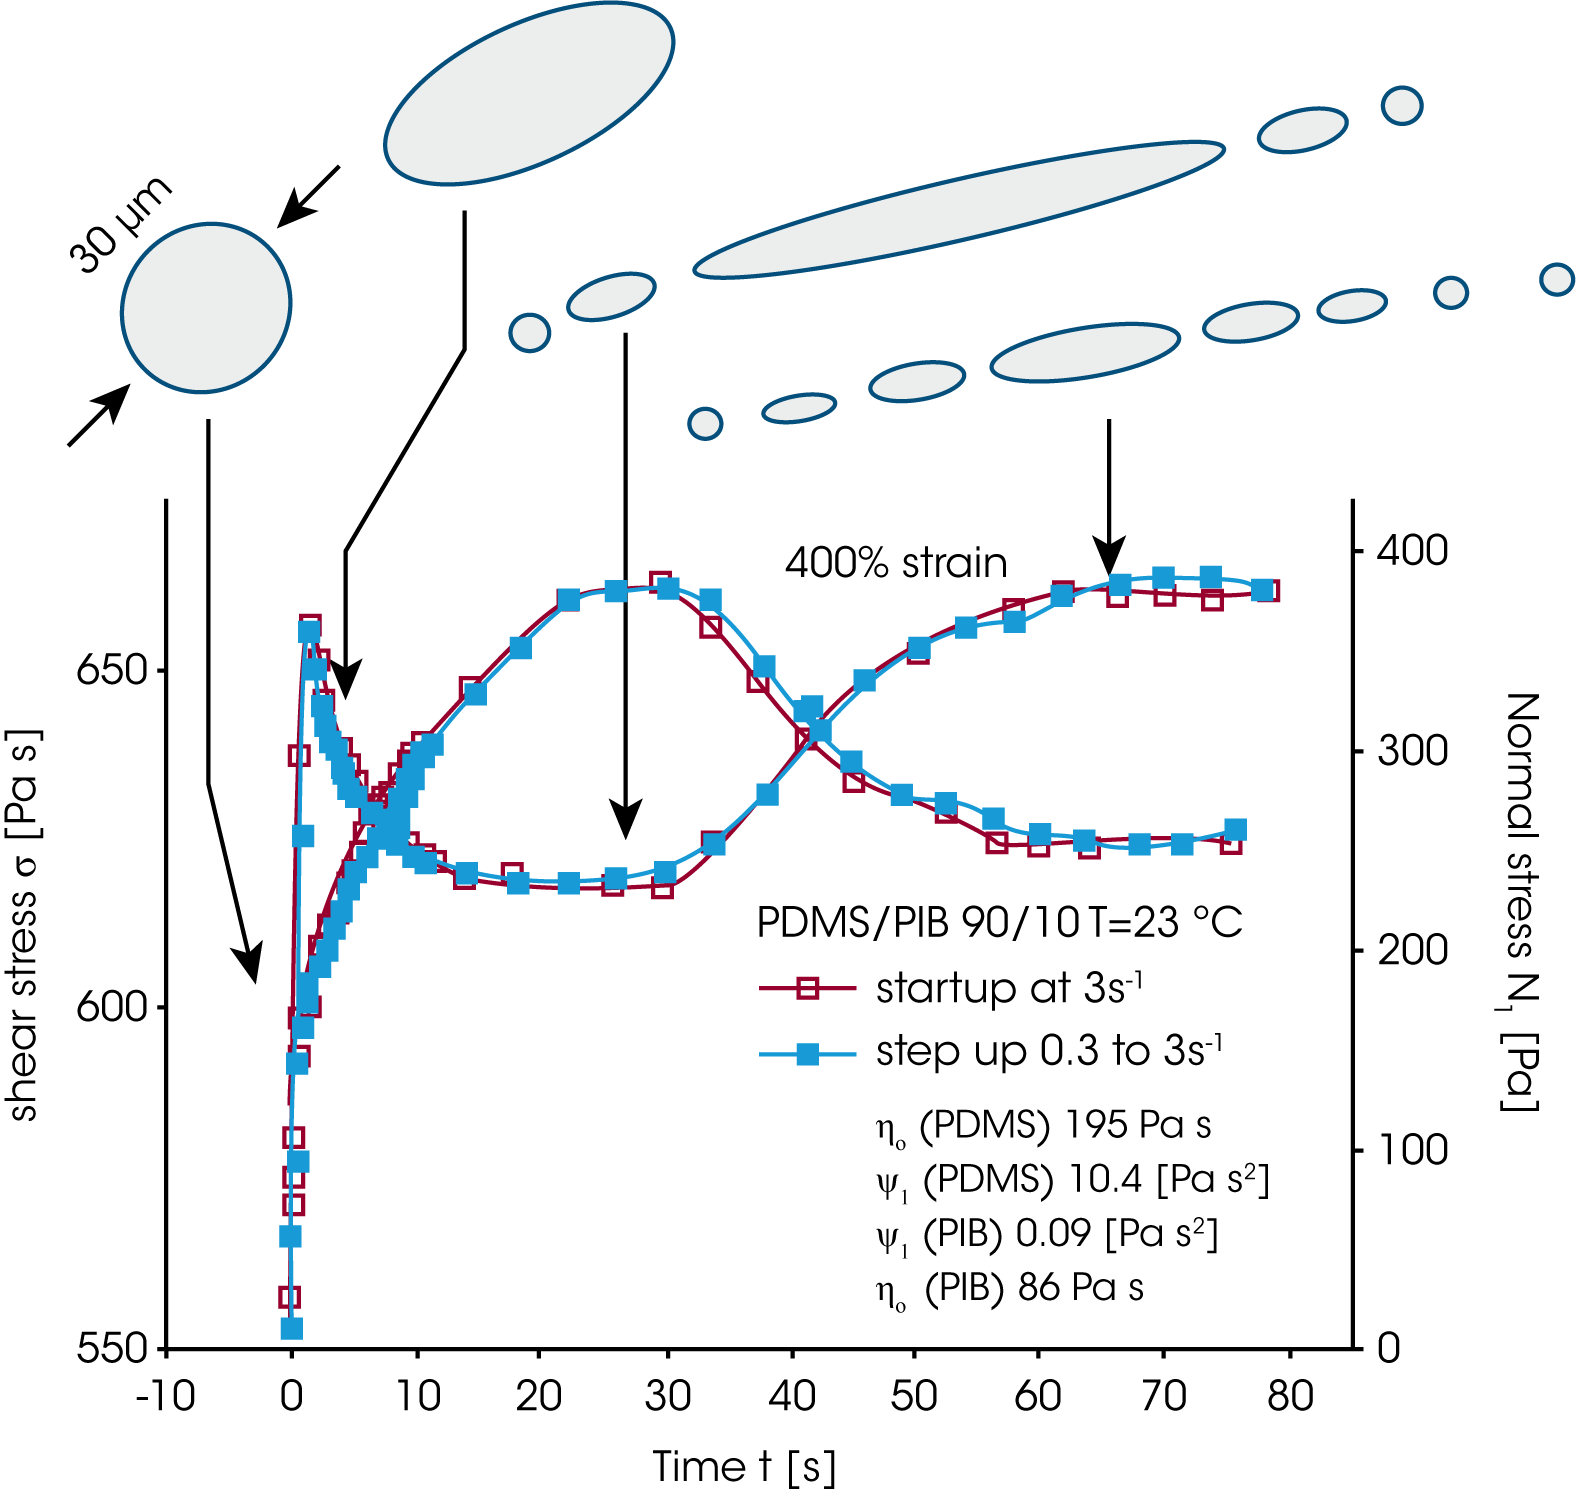
In order to follow the droplet break-up in real time, Vinckier et al. /16/ measured the transient viscosity and normal stress in start up and step up experiments (figure 16). In a start up or step up experiment, the viscosity first goes through a maximum, then decreases to a minimum to reach a higher steady state value again. Similar the normal stress shows an overshoot followed by a steady state. Starting from a spherical shape, the dispersed droplets are elongated, the viscosity decreases (less flow resistance), but the elasticity increases due to energy storage in the interface. At the maximum of the normal stress, the droplets start to break up, the elasticity now decreases, however the viscosity, due to the increase of small spherical droplets increases again. The steady state is a dynamic equilibrium state with an average droplet size.
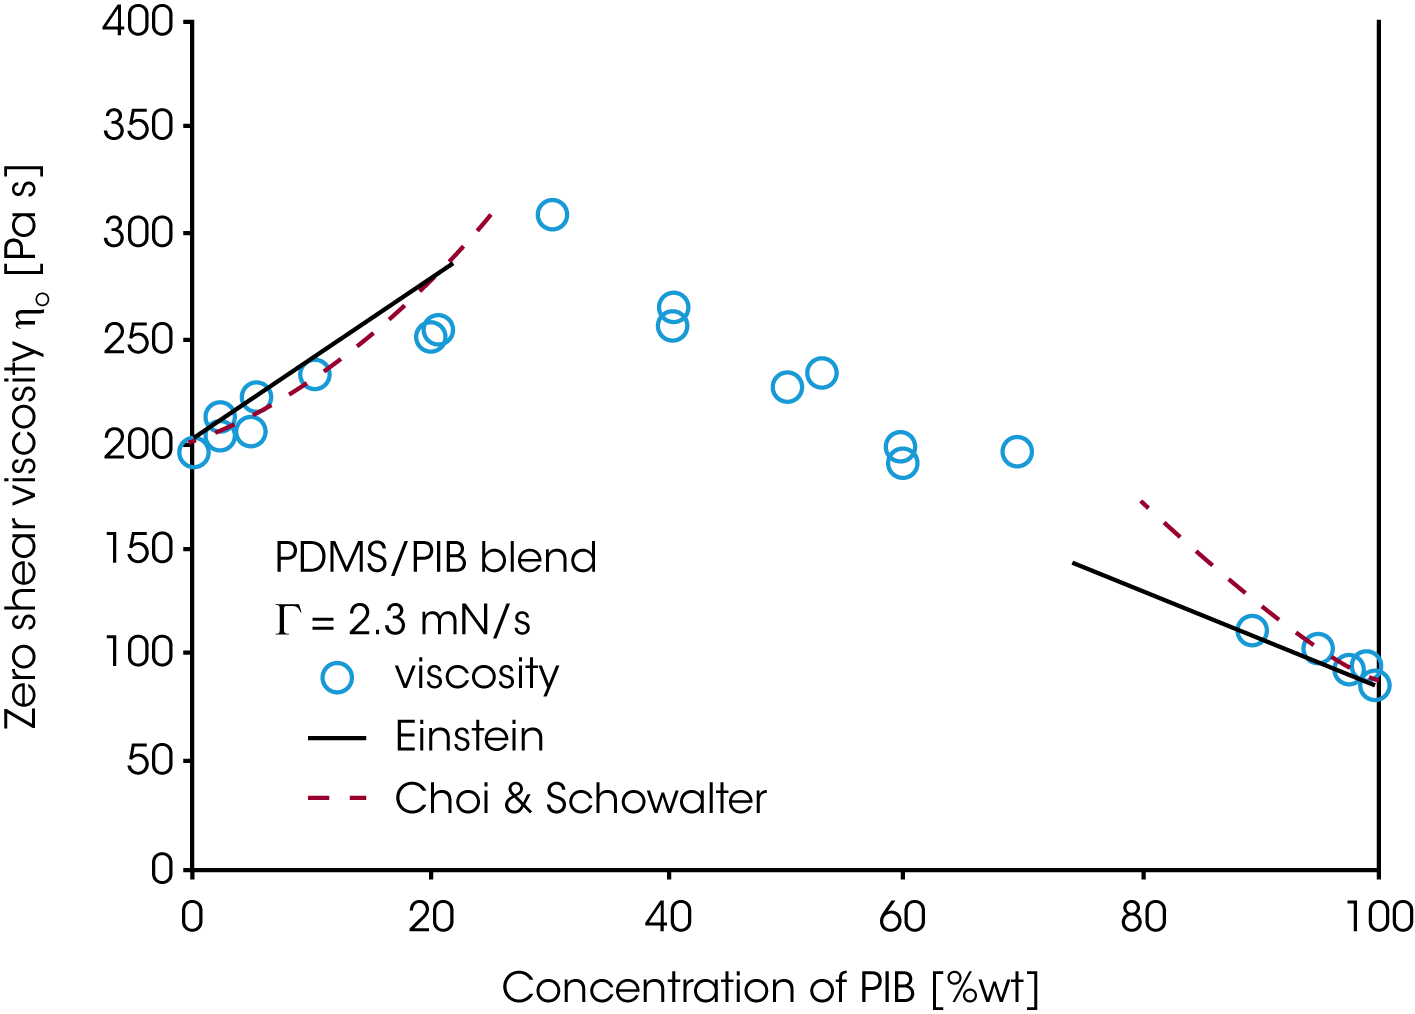
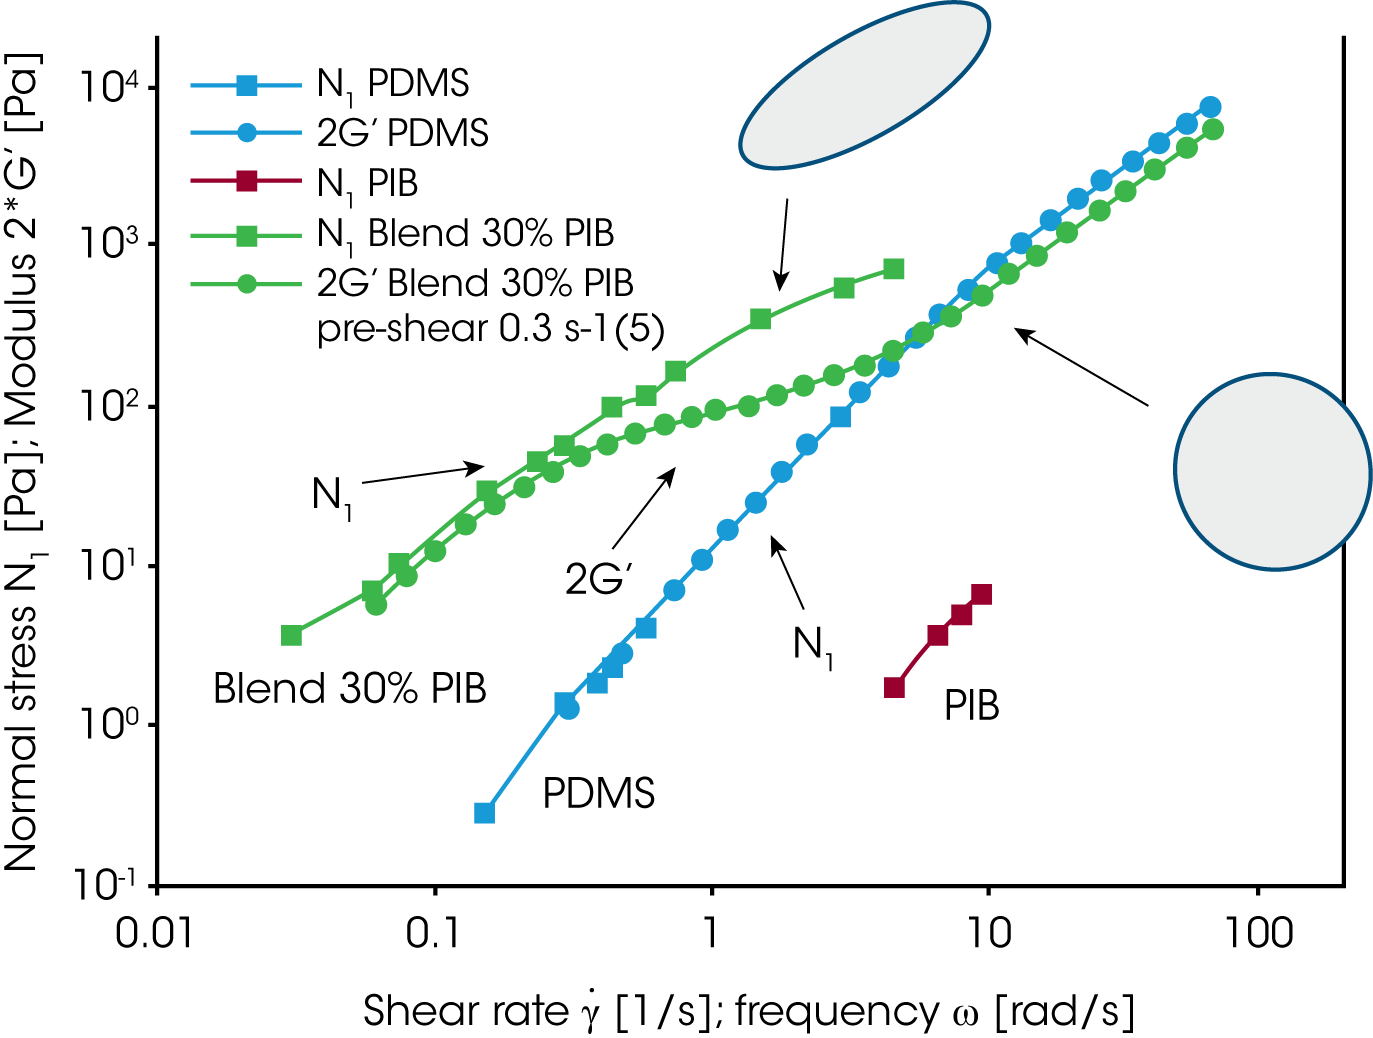
Since the rheology depends on the morphology and the morphology itself depends on the applied flow conditions, the mixing law for the viscosity and elasticity of immiscible blends is very complex. For the PDMS/PIB blend, the zero shear viscosity is shown as a function of the concentration of PIB (figure 17). Only the conditions at low loadings of either PDMS or PIB can be described approximately by the Choi & Schowalter model /11/. The behavior in the region of high volume fraction of both components is dominated by the morphology and none of the existing models apply. Figure 18 summarizes the results obtained on the PDMS/PIB blend. The normal stress N1 and two times the storage modulus G’ are plotted vs. shear rate or frequency. At low frequency i.e. low shear rate, oscillation and transient data for the elasticity (2G‘ and N1) of the blend superpose. Note, that the values for the pure components are significantly lower then for the blend. At low rate, the morphology in the transient experiment is only slightly disturbed by the flow and the large size droplets remains spherical. With increasing shear rate, the droplets are deformed and break down eventually. The normal stress remains high with increasing deformation as mechanical energy is stored in the interface. In oscillation measurements, the long relaxation times associated with the phase relaxation do not respond to the high frequency probing. G’ of the blend decreases with frequency and reaches a value slightly lower then the value of the pure component of the continuous phase. This result is due to a dilution effect of a small amount of the dispersed phase.
Conclusion
Mixing rules are important to predict the behavior of multi-component polymer systems. The modified mixing rule from Tsenglou and Des Cloizeaux has become an important analytical tool to determine molecular weight distributions of homologous polymers. The rheological properties of miscible heterogeneous polymer systems are much more difficult to predict, nevertheless recent developments provided a better understanding of these systems. In immiscible polymer systems, the morphology often dominates the rheological behavior. The rheology of these systems is more difficult to predict, especially as the morphology is also strongly influenced by the flow history itself.
References
- W.M. Prest Jr. Polymer J. 4, 2 (1973), 163
- C. Tsenoglou, New Trends in Physics and Physical Chemistry of Polymers, 375 (1989)
- J.C. Haley, et al. Macromolecules 36, 6142 (2003)
- J. Des Cloizeaux, Macromolecules 23, 3992 (1990)
- W.H. Tuminello presented SOR, Oct 1999
- T.P. Lodge, T.C.McLeish, Macromolecules 33, 5378 (2000)
- R. J. Composto, E. J. Kramer, and D. M. White, Macromolecules 25, 4167 (1992)
- S. Wu, J.Polym.Sci.Part B Polym.Phys. 25, 2511 (1987)
- C. Friedrich, et al. J.Rheol. 93, 1411 (1995)
- A. Einstein, A. Ann Phys. 19, 289 (1906), 24, 591 (1911)
- S.J. Choi, W.R. Schowalter Phys.Fluids 18, 420 (1975)(1975)
- Gramespacher et al. J.Rheol. 36(6) 1127 (1992)
- Vinckier et al. J.Rheol. 42(3), 705 (1997)
- J.F. Palierne, Rheol. Acta 29, 204 (1990)
- D.Graebling et al. European Polymer Journal, 30(3), 301 (1994)
- Vinckier et al. J.Rheol. 40(4), 613 (1996)
Acknowledgement
Click here to download the printable version of this application note.

