Keywords: Polymers, Polyethylene, DSC, Modulated DSC
TA474
Problem
The blending of two or more polymers is becoming a common method for developing new materials for demanding applications such as impact-resistant parts and packaging films. Since the ultimate properties of blends can be significantly affected by what polymers are present, as well as by small changes in the blend composition, suppliers of these materials are interested in rapid tests which provide verification that the correct polymers and amount of each polymer are present in the blend. Differential scanning calorimetry (DSC) has proven to be an effective technique for characterizing blends such as polyethylene/polypropylene where the crystalline melting endotherms or other transitions (e.g., glass transition) associated with the polymer components are sufficiently separated to allow identification and/or quantitation. However, many blends do not exhibit this convenient separation and thus are difficult to accurately evaluate by conventional DSC.
Solution
DSC is a technique which measures the total heat flow into and out of a material as a function of temperature and/or time. Hence, DSC measures the sum of all thermal events occurring in the material. Modulated DSCTM (MDSC), on the other hand, is a new technique which subjects a material to a linear heating method which has a superimposed sinusoidal temperature oscillation (modulation) resulting in a cyclic heating profile.
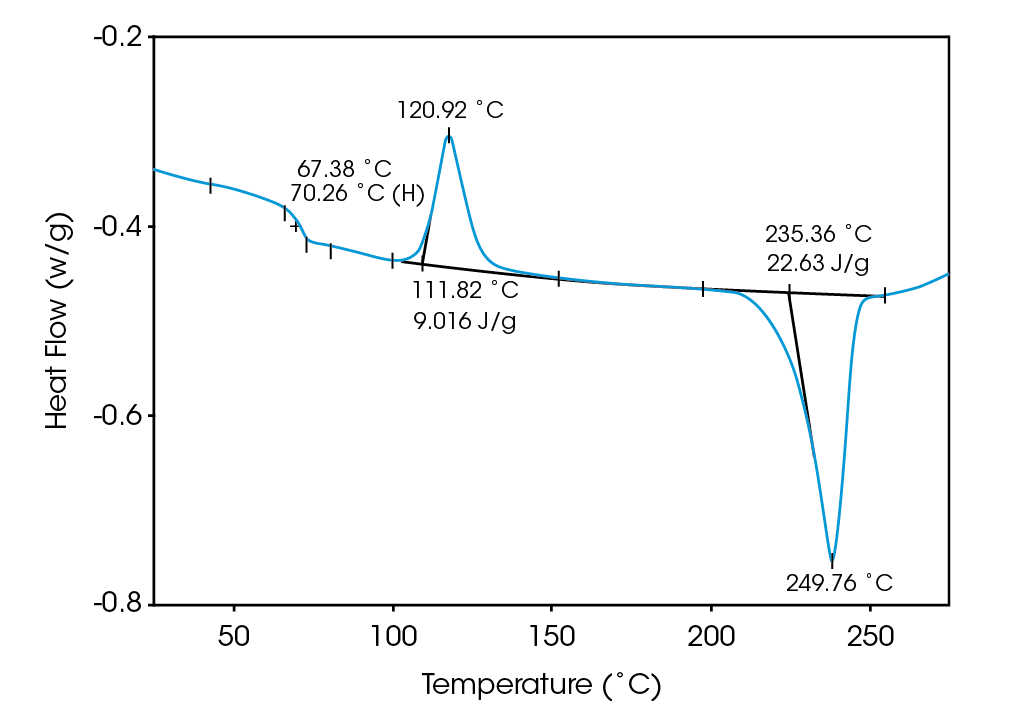
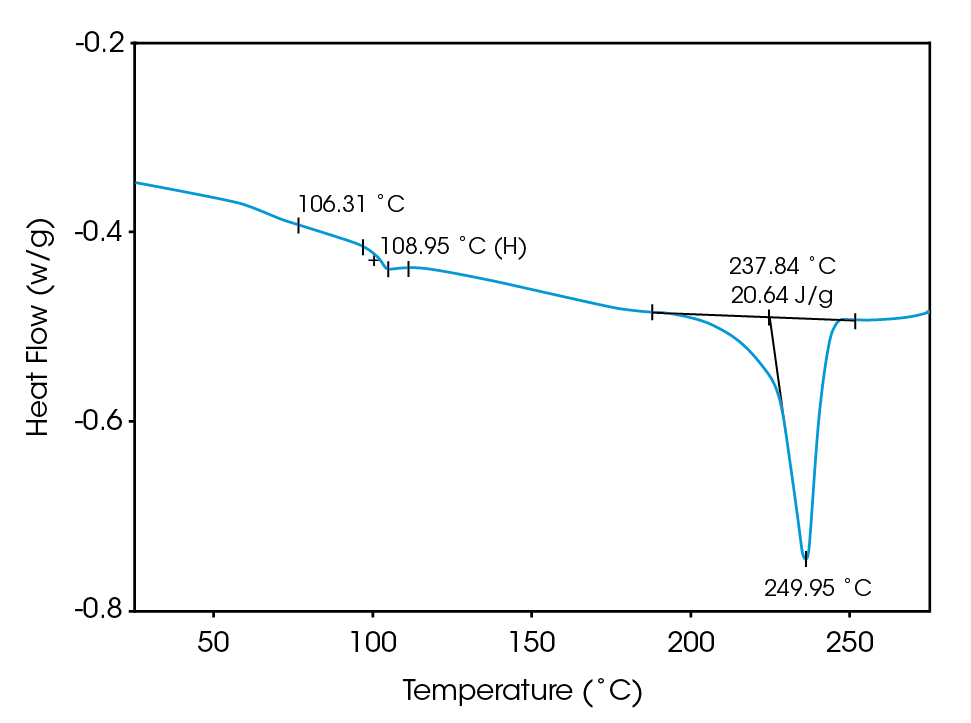
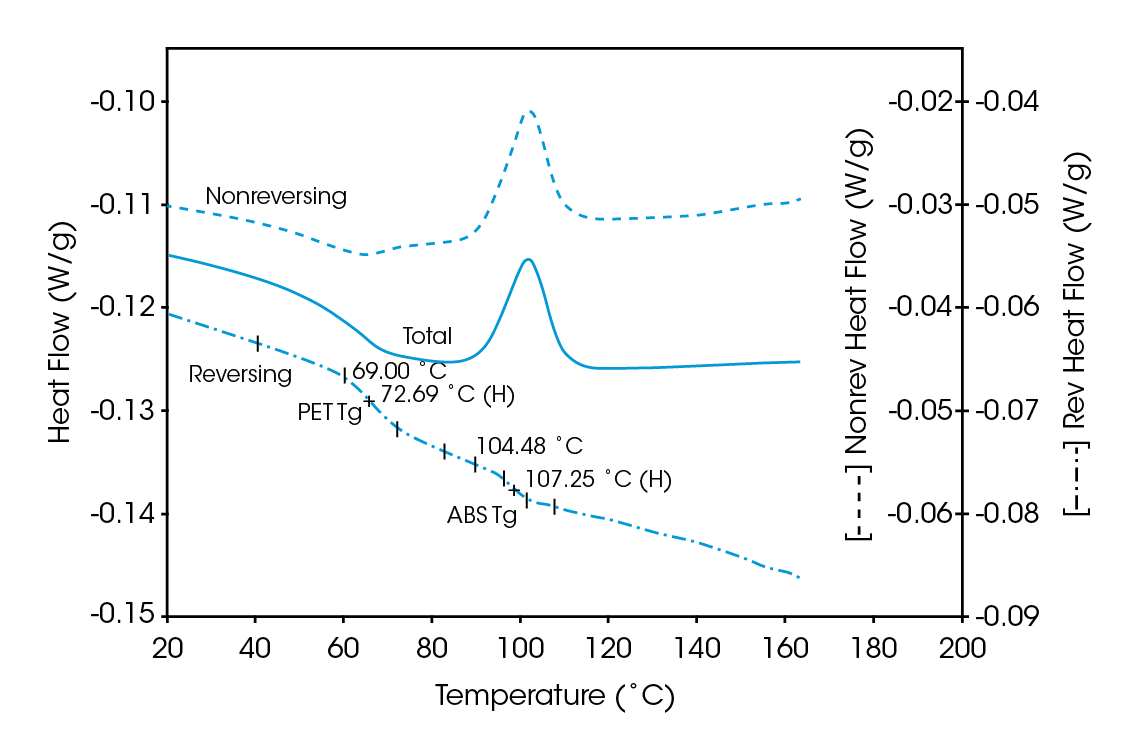
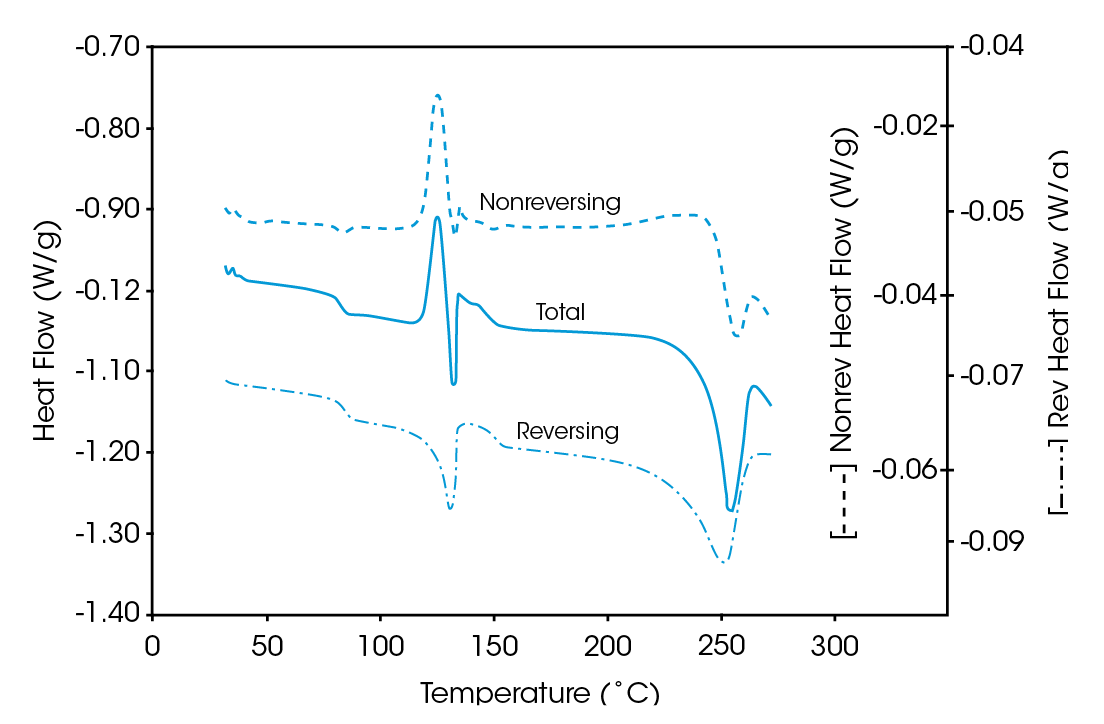
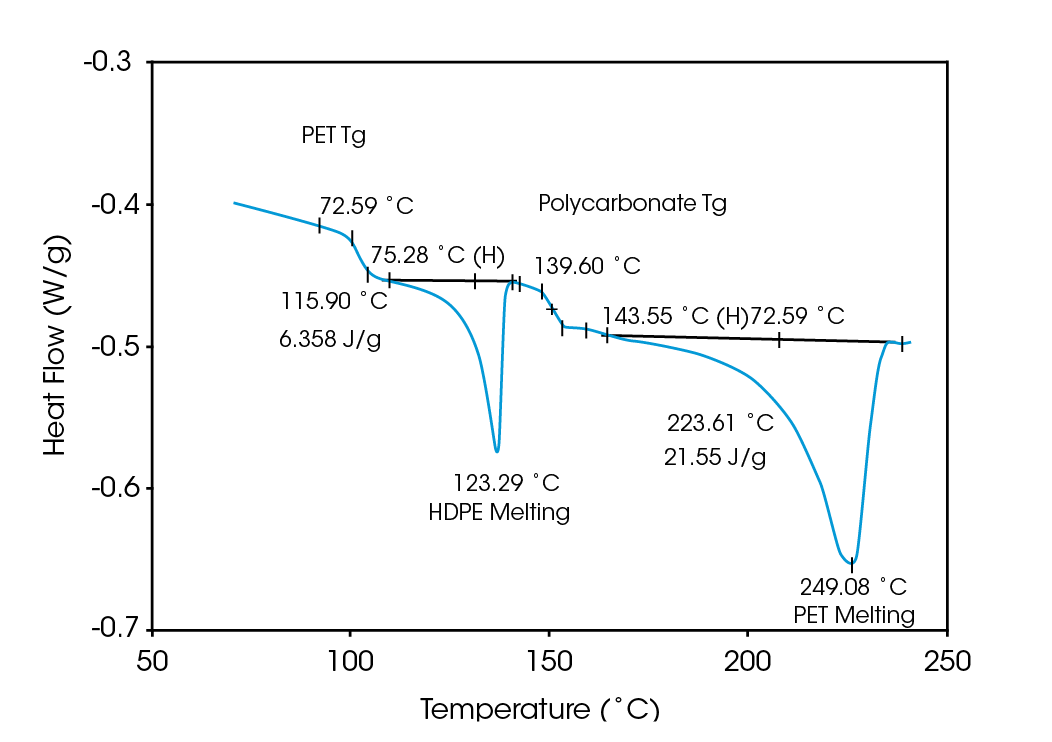
Deconvolution of the resultant heat flow profile during this cyclic heating provides not only the “total” heat flow obtained from DSC, but also separates that “total” heat flow into its heat capacity-related (reversing) and kinetic (nonreversing) components. It is this separation aspect which allows MDSCTM to more completely evaluate polymer blend compositions. Figure 1, for example, shows the conventional DSC (total heat flow) result for an as received polymer blend containing polyethylene terephthalate (PET) and acrylonitrile-butadiene-styrene (ABS). Three transitions indicative of the glass transition, cold crystallization, and crystalline melting of the PET are seen at 67 ˚C, 112 ˚C, and 235 ˚C respectively. However, no apparent ABS transitions are observed. Upon reheating, after cooling at a controlled rate (10 ˚C/minute), the DSC result changes (Figure 2). Now only two transitions are observed – a glass transition at 106˚C and a crystalline melt at 238 ˚C. Explanation of these changes on reheating, particularly the apparent shift in the glass transition temperature, is difficult based on only these results. The MDSCTM results for the “as received” material shown in Figure 3 resolve these interpretation issues. Phenomena such as glass transitions and melting are predominately reversing under MDSC, while cold crystallization is nonreversing. Hence, separation of the total heat flow into its reversing and nonreversing components separates overlapping thermal events with different behavior. The nonreversing curve in this case shows only the exotherm associated with the PET cold crystallization . The reversing curve shows three transitions – the glass transition (69 ˚C) and crystalline melting associated with PET [this melting is not shown in Figure 3 since it’s outside the temperature range chosen], as well as a second glass transition (at 105 ˚C) associated with the ABS. In DSC, this latter glass transition is hidden under the PET cold crystallization peak and only becomes visible on reheating after a less amorphous PET phase is produced. Figures 4 and 5 show another example of the improved interpretation provided by MDSCTM. The total heat flow (Figure 4) is the DSC result for a blend believed to contain PET, polycarbonate (PC) and polyethylene (PE). Obviously, interpretation of this curve is not straightforward.
The MDSC results (reversing and nonreversing heat flow in Figures 4 & 5), on the other hand, again facilitate interpretation. The total heat flow curve shows a glass transition, an overlapping group of transitions at 110 – 140 ˚C, and a crystalline melt. Separation of the total heat flow into its reversing and nonreversing components allows the following transitions to be resolved and assigned.
| Curve | Transition | Assignment |
|---|---|---|
| Reversing | Glass Transition (73 ˚C) | PET |
| Melt (116 ˚C) | PE | |
| Glass Transition (140 ˚C) | PC | |
| Melt (224 ˚C) | PET | |
| Nonreversing | Relaxation (75 ˚C) | PET |
| Cold Crystallization (120 ˚C) | PET |
Click here to download the printable version of this application note.

