Keywords: rheology, dielectric, rheo-dielectric, polymers, chain relaxation, shear stress
RH142
Abstract
Rheology and dielectric spectroscopy are often used separately to investigate the viscoelastic and dynamic properties of materials, e.g. polymers. In rheology, the material is disturbed by a mechanical field, whereas in dielectric spectroscopy an electrical field is applied. Therefore, the sample must have a permanent or chargeinduced dipole moment to interact with the applied electrical field. The response of the material to these perturbations provides information about the viscoelastic properties and dynamics, or charge transport in the sample. Hence, coupling these two methods makes it possible to study the effect of the shear stress on the dynamics, and the orientation of the material. Additionally, it allows the investigation of electrorheological fluids that change their viscoelastic properties as a function of the applied field. This application note intends to provide an overview of the numerous applications and possibilities of the coupled Rheo-Dielectric.
Introduction
Dielectric analysis is the study of the mobility of dipoles or ions in a material. The mobility of these can be measured by determining the impedance of a capacitor filled with the sample. This gives insight to many physical and chemical structure properties of materials over a wide frequency range. By coupling a dielectric analyzer with a rheometer, samples can be investigated over a much wider frequency range than with a rheometer alone. Additionally, the combined measurement allows for the investigation of structural changes in the sample caused by a rheological deformation. The basics of the test method and the setup are discussed, as well as some of the applications that can be gained with such a coupled device.
Background
Dielectric analysis
Dielectric analysis (DEA) is a very powerful technique for characterizing materials with dipolar relaxation processes. This is particularly useful for characterizing phase transitions, as a change in structure can restrict the freedom of orientation of dipole moments and the mobility of free ions. In general, transport processes in solids, especially in complex, structured polymers, depend strongly on their morphology as well as on the influences of physical variables [1,2]. Dielectric analysis explores the electric charge distribution and change with respect to time respective frequency of electrical dipole moments in a material after applying a sinusoidal voltage via two plate-plate electrodes (electrical capacitor) [3]. The resulting oscillating electrical field in the capacitor causes an oscillating polarization field through the sample. This results in a phase-shifted current to the applied voltage, which is in analogy to the phase-shifted stress to the strain in oscillatory shear-rheology. In the complex notation, the phase shift is described by the complex impedance Z*(ω), which allows for the calculation of the complex dielectric function via Equation 1:
Equation 1
ε*(ω) = ε’(ω) – iε’’(ω) = (iωC0Z*(ω))−1
Where
ε* is the complex permittivity
ε’ is the real part of the permittivity
ε” is the imaginary part of the permittivity
ω is the angular frequency of the applied electric field
C0 is the vacuum capacitance
Z*(ω) is the complex impedance
The fundamental mathematics for mechanical and dielectric spectroscopy are very similar [2]. As electric currents consist of an active current (real part) and a blind current (imaginary part), the dielectric function (ε*) also consists of a real (ε’) and an imaginary (ε”) part. The complex permittivity ε* describes the dielectric behavior of the material and contains information about molecular transport and relaxation processes by monitoring the translation of charged ions and the rotation of electric dipoles existing in the material. In general, transport processes in solids, especially in complex structured polymers, depend on their internal morphology as well as on the influence of important physical properties. The dielectric function ε* depends on several variables such as the temperature, frequency, and applied mechanical loads including pressure and tensile stresses. One of the advantages of dielectric analysis is that it provides an enormous measurable frequency range from 10−2 Hz to typically 107 Hz.
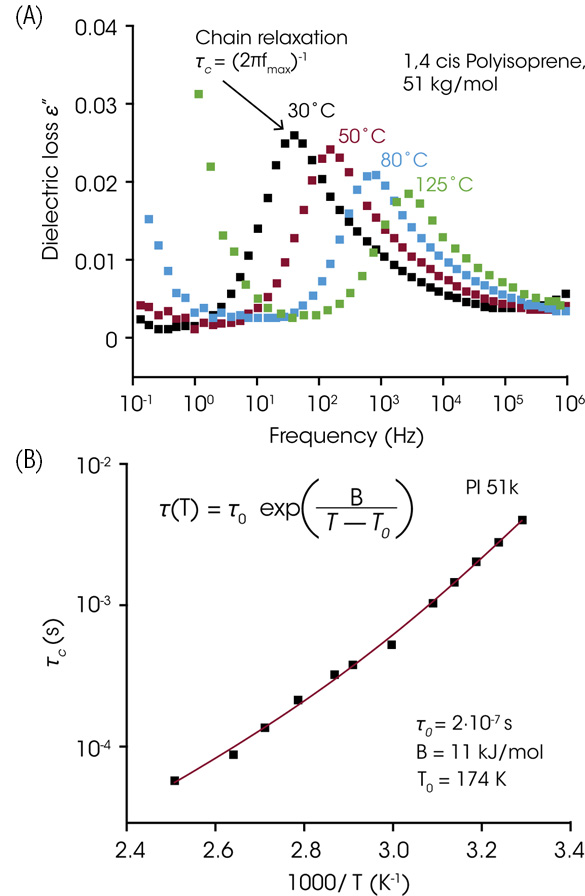
Figure 1 illustrates the influence of the sample temperature on the dielectric loss function for a polyisoprene (PI) model sample with a molecular weight (Mw) of 51 Kg/mol. The PI has a molecular dipole that is parallel to the chain backbone so that the end-to-end fluctuation of the PI chains results in the slowest dielectric relaxation within the molecule. The temperature and frequency dependence of the dielectric loss ε’’ for PI sample has a maximum from which the characteristic relaxation time τc can be obtained. For large polymers, this relaxation process corresponds to the reptation motion of the entire chain caused by dipole components parallel to the backbone. At higher temperatures, the molecular mobility of linear homopolymers increases. Figure 1A displays the corresponding chain relaxation in the dielectric loss as a function of temperature. The dielectric chain relaxation represents, in this specific case, the reptation motion for the PI chains. Figure 1B shows the temperature dependence of the chain relaxation times.
Combining Rheology and Dielectric Analysis
Rheology is the study of the relationship between mechanical deformation and stress of materials. In this context, materials often refers to “soft matter” or “complex fluids”. These complex fluids possess mechanical properties that are intermediate between ordinary liquids and solids, such as polymer melts and solutions, block copolymers, biological macromolecules, polyelectrolytes, surfactants, suspensions, emulsions and beyond [4].
From an experimental point of view, deformation can generally be divided into two categories: (1) shear flow and (2) extensional (or elongational) flow. These two characteristic flows may be thought of as the classical flow used in rheological measurements. Shear flow tests can be further subdivided into steady and unsteady shear test. From steady shear tests, well-defined material functions, i.e., viscosity, can be measured. In unsteady shear tests, there are several kinds of test methods, including shear stress growth, shear stress decay, shear creep, step shear strain, dynamic oscillatory and shear tests. Among unsteady shear flow tests, dynamic oscillatory shear tests are a well-known characterization method to investigate viscoelastic properties of complex fluids. Dynamic oscillatory shear tests are performed by subjecting a material to a sinusoidal shear deformation and measuring the resulting mechanical response as a function of time. Oscillatory shear γ (t) input is very similar to oscillatory electric field input: (γ (t) =γ0 sin ωt) for shear versus (E(t) = E0 sin ωt) for dielectric spectroscopy.
Oscillatory shear tests can be divided into two regimes. One regime is a linear viscoelastic response (small amplitude oscillatory shear, SAOS), and the second regime is nonlinear material response (large amplitude oscillatory shear, LAOS). As the applied amplitude (of strain or stress) is increased from small to large at a fixed frequency, a transition between the linear and nonlinear regimes can appear [5]. The viscoelastic response is quantified by two material functions, namely, the elastic storage modulus G’(ω) and the viscous loss modulus G”(ω). In the linear regime, the strain amplitude is sufficiently small that both viscoelastic moduli are independent of the strain amplitude and the oscillatory stress response is a phase-shifted sinusoidal. The strain amplitudes used in linear oscillatory shear tests are generally very small, often on the order of γ0 ≈ 10−2 – 10−1 for homopolymer melts and polymer solutions. For some dispersed systems (emulsions, suspensions, and polymer nanocomposite) or block copolymer solutions, the linear regime is limited to even smaller strain amplitudes, γ0 < 10−2. With increasing strain amplitude, the nonlinear regime can appear beyond SAOS. In the nonlinear regime, the storage or loss moduli are a function of strain amplitude [G’(γ0) and G”(γ0)] and the resulting periodic stress waveform becomes distorted and deviates from a sinusoidal wave. This nonlinear regime becomes apparent at larger strain amplitudes; therefore, the nonlinear dynamic test is typically referred to as large amplitude oscillatory shear (LAOS) test [6].
Experimental
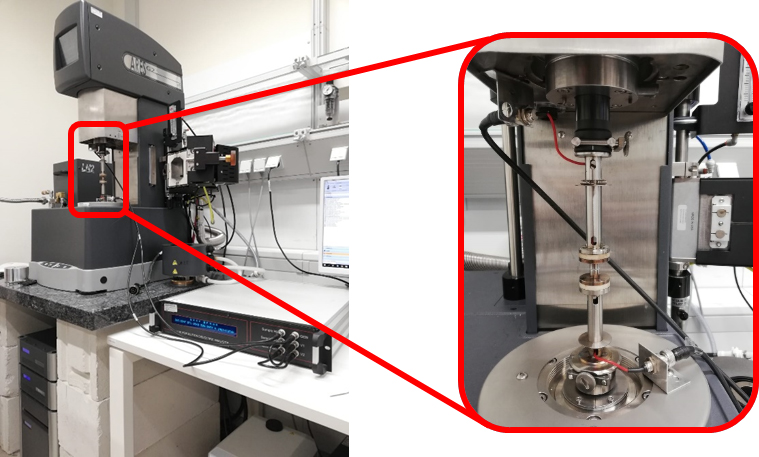
The Rheo-Dielectric setup consists of a TA Instruments™ ARES-G2 Rheometer and ALPHA-Analyzer (Novocontrol), shown in Figure 2.
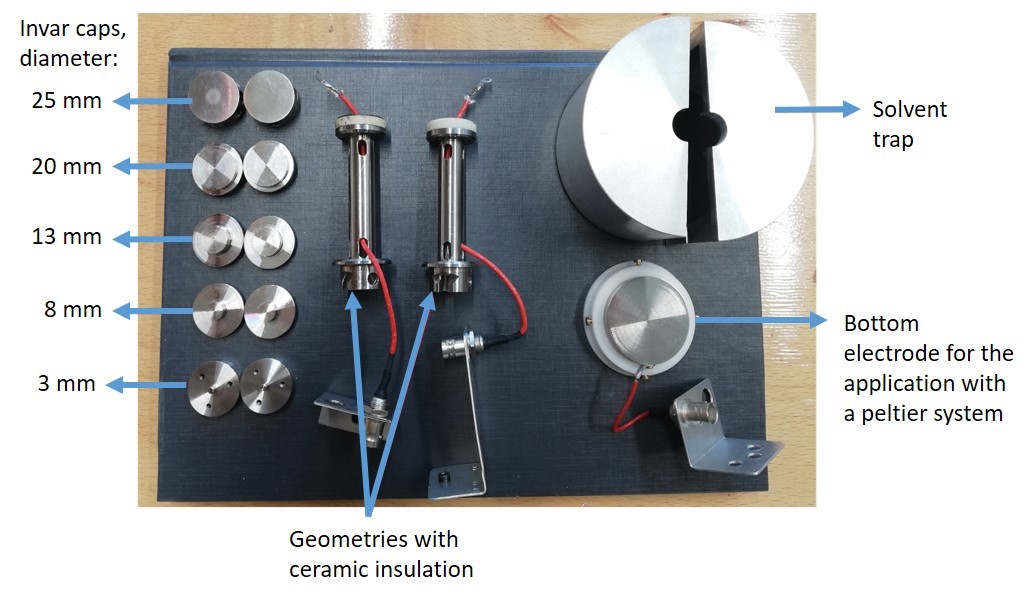
The geometries are custom-made and consist of a shaft provided with a ceramic insulation, on which electrodes with different diameters can be mounted, as shown in Figure 2 and Figure 3. The electrodes are connected to the dielectric spectrometer via BNC cables. During the measurement, the temperature can be controlled with the ARES-G2 Forced Convection Oven (FCO), but a temperature of 200 °C must not be exceeded because of the connecting cables. Another possibility for temperature regulation is using a bottom electrode that can be mounted on an Advanced Peltier System (APS). The modular system provides great flexibility so that a wide range of materials from solid to liquid can be measured.
Results and Discussion
Independent measurement of rheology and dielectric spectroscopy on one instrument — Observe structural changes caused by mechanical deformation
One advantage of Rheo-Dielectrics is that both methods can be used simultaneously without affecting each other such as when applied in the linear domain for polymers.
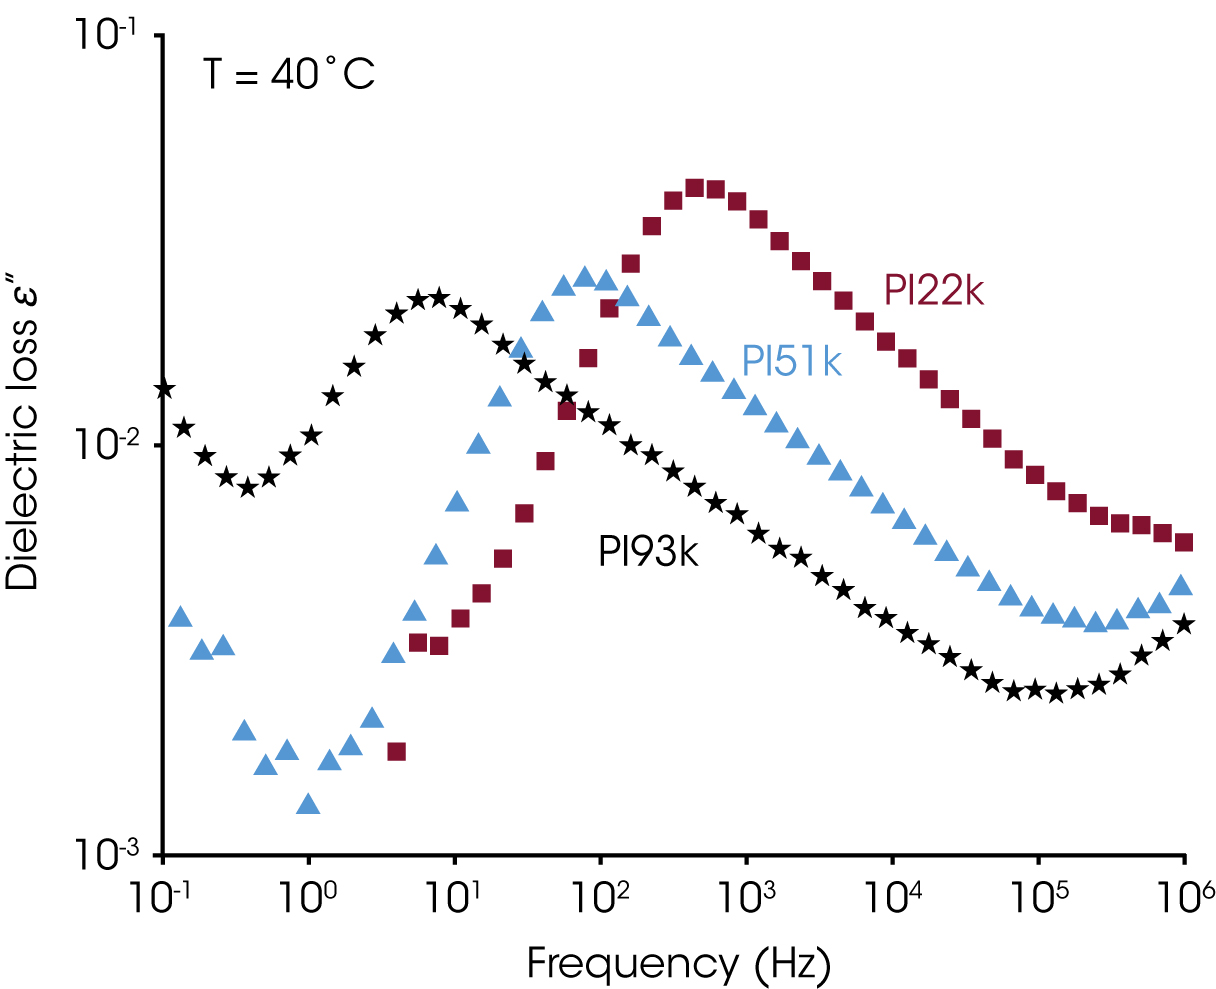
While the simultaneous application of both methods saves a lot of time, this system also offers the possibility to study the effect of the shear stress on the dynamics, and the orientation of the material. The described system was for example used to investigate the global polymer chain motion of polyisoprene (PI), that is a Stockmayer Type A polymer [7], shown in Figure 4. It was found that the dielectric normal mode changes significantly with an increasing molecular weight while the shape of the relaxation process stayed the same. A factor of 4 in molecular weight shifts the maximum in ε’’ by a factor of 43.4 ~ 100 as predicted by reptation theory.
The dielectric chain relaxation of PI was used to investigate the shear-induced alignment process. Meins et al. showed that the anisotropic diffusion of the confined PI chains during and after the alignment allowed following the shear-alignment process using dielectric spectroscopy. The measurement of the dielectric loss ε’’(t) can also be correlated with the non-linear mechanical parameter I3/1 as determined via Fourier-transform rheology [8].
In a next step the transient Rheo-Dielectric measurements on cis-1,4-PI with a molecular weight of Mw = 108 kg/mol were performed in order to monitor the rheological strain-perturbation and stress-response simultaneously with the dielectric response.
A deeper understanding of the interplay between non-linear rheology and dielectric properties is acquired using transient measurements. Here, the rheological excitation frequency is significantly lower than the dielectric frequency and dielectric integration time, respectively, allowing insights into the intracycle changes of the dielectric properties. Such a test is first performed on worm-like micelles in a Coquette geometry by Cho et al. [9]. Recent results, shown in Figure 5, indicate that these measurements can also be performed on PI sample in a plate-plate geometry.
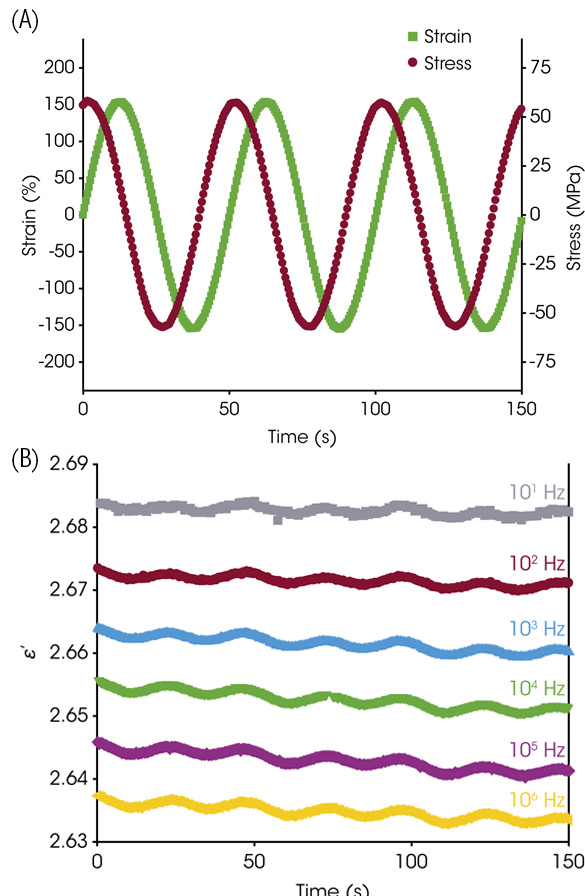
Figure 5. Transient Rheo-Dielectric measurements at -5 °C on cis-1,4-PI with a molecular weight of Mw = 108 kg/mol. (A) Waveform of the rheological strain-perturbation and stress-response at a frequency of 0.02 Hz. (B) Time dependence of the dielectric response for frequencies much higher than the rheological excitation.
Conclusions
The results described here give a first impression of the manifold possibilities offered by coupled Rheo-Dielectric. Besides a simultaneous measurement and the investigation of the alignment of block copolymers and nematic crystals, further possible applications exist. An example might be the investigation of the influence of nonlinear rheology on suspensions, or the in-situ monitoring of reactions, e.g. the gelation in ceramic processing [10].
References
- Nair K.M.; Guo R.; Bhalla A.S; Suvorov D.; Hirano S-I.; Advances in Dielectric Materials and Electronic Devices. Book Series: Ceramic Transactions Series, Online ISBN: 9781118408162 (2006).
- Kremer F.; Schönhals A.; Broadband Dielectric Spectroscopy. Springer Berlin, Heidelberg, DOIhttps://doi.org/10.1007/978-3-642-56120-7.
- Meins, T.; Dingenouts, N.; Kübel, J.; Wilhelm, M. In Situ Rheodielectric, ex Situ 2D-SAXS, and Fourier Transform Rheology Investigations of the Shear-Induced Alignment of Poly(styrene-b-1,4-isoprene) Diblock Copolymer Melts. Macromolecules 2012, 45 (17), 7206–7219.
- Yang, J.; Melton, M.; Sun, R.; Yang, W.; Cheng, S. Decoupling the Polymer Dynamics and the Nanoparticle Network Dynamics of Polymer Nanocomposites through Dielectric Spectroscopy and Rheology. J. Phys.: Condens. Matter 2020, 53 (1), 302–311.
- Sangoro, J. R.; Iacob, C.; Agapov, A. L.; Wang, Y.; Berdzinski, S.; Rexhausen, H.; Strehmel, V.; Friedrich, C.; Sokolov, A. P.; Kremer, F. Decoupling of ionic conductivity from structural dynamics in polymerized ionic liquids. Soft matter 2014, 10 (20), 3536–3540.
- K. Hyun, C.O. Klein, M. Wilhelm, K.S. Cho, J.G. Nam, K.H. Ahn, S.J. Lee, R.H. Ewoldt, G.H. McKinley; A review of nonlinear oscillatory shear tests: Analysis and application of large amplitude oscillatory shear (LAOS) Prog. Polym. Sci. 36 1697-1753 (2011).
- Stockmayer, W. H. Dielectric dispersion in solutions of flexible polymers. Pure Appl. Chem 1967, 15 (3-4), 539–554.
- T. Meins, N. Dingenouts, J. Kübel, M. Wilhelm; In Situ Rheodielectric, ex Situ 2D-SAXS, and Fourier Transform Rheology Investigations of the Shear-Induced Alignment of Poly(styrene-b-1,4-isoprene) Diblock Copolymer Mellts, Macromolecules 45 7206-7219 (2012).
- Cho, N.; Shi, J., Murphy, R., Riley, J.; Rogers, S.; Richards, J. Extracting microscopic insight from transient dielectric measurements during large amplitude oscillatory shear. Soft Matter, 2023, 19, 9379-9388.
- Kedzierska-Sar, A.; Starzonek, S.; Kukielski, M.; Falkowski, P.; Rzoska, S. J.; Szafran, M. Gelcasting of Al2O3–W composites: Broadband dielectric spectroscopy and rheological studies of tungsten influence on polymerisation kinetics. Ceramics International 2019, 45 (12), 15237–15243.
Acknowledgement
For more information or to request a product quote, please visit www.tainstruments.com to locate your local sales representative..
This paper was written by Dr. Roxana Figuli and MSc. Tobias Schwan Ph.D. at Karlsruhe Institute of Technology (KIT), Institute for Chemical Technology and Polymer Chemistry
TA Instruments is a trademark of Waters Technologies Corporation.
Click here to download the printable version of this application note.

