Keywords: Thermomechanical Analysis, CTE, Dielectric Materials, Printed Wire Boards (PWB)
TA356
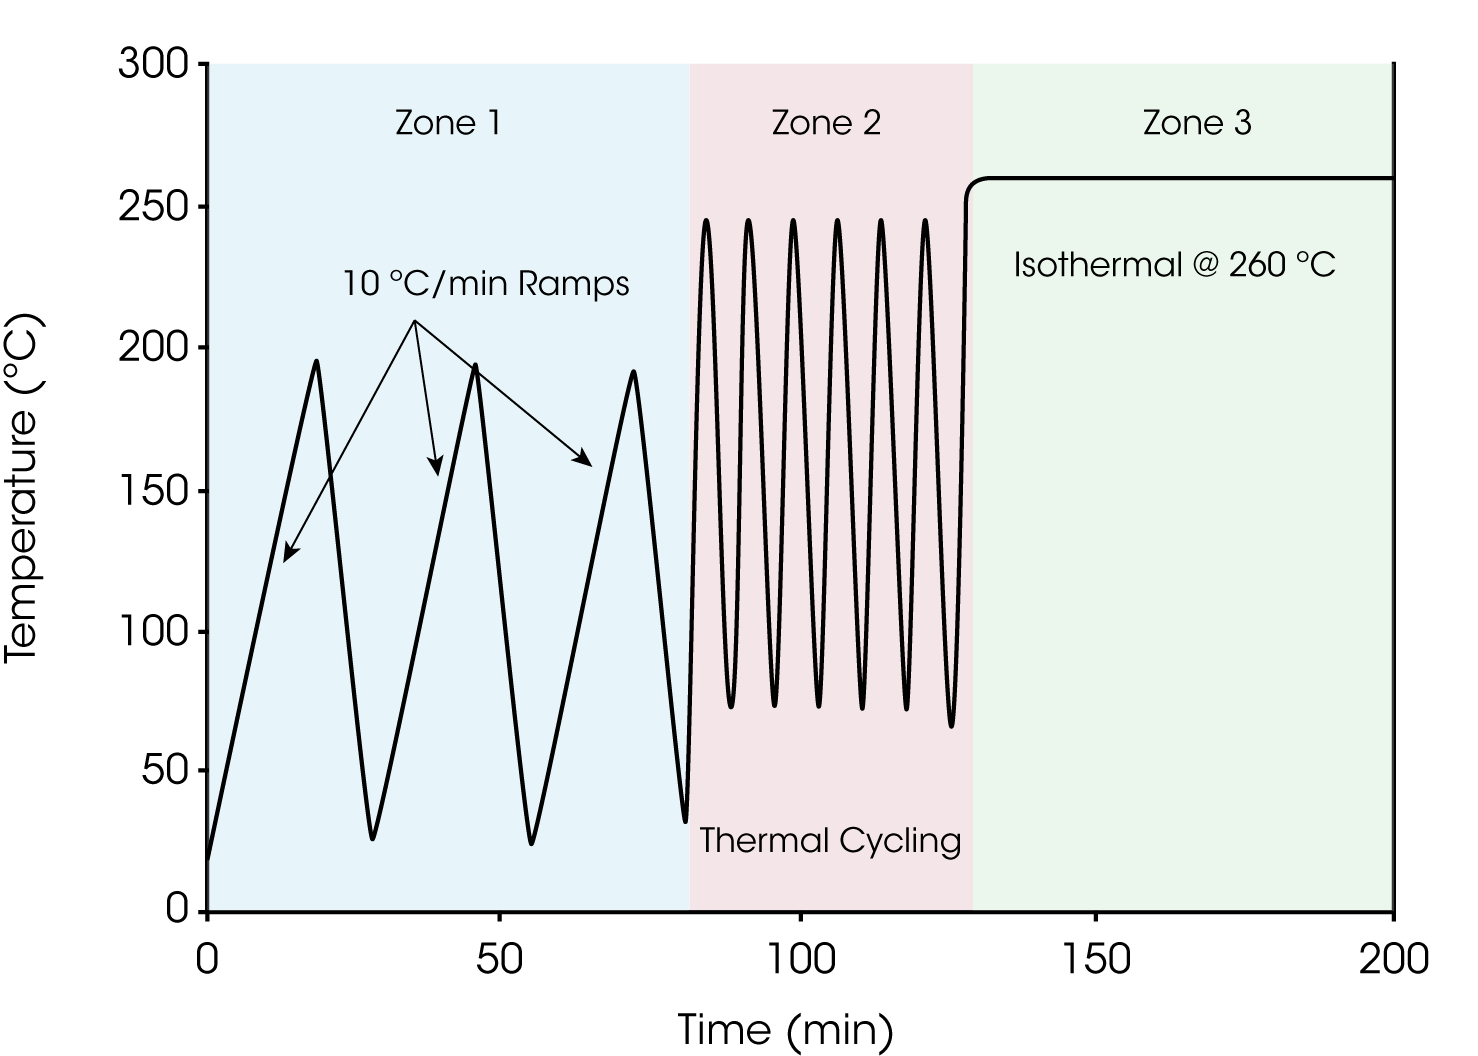
A TMA (thermomechanical analysis) test protocol has been developed that produces practical data for the comparison of different dielectric materials and their effects on performance, based on industry standard tests. This method is a combination of standard thermal protocols that PWB Inc. has developed to determine Tg, CTE, thermal stress cycles and time to delamination, after an assembly and rework simulation. This is achieved by using various thermal cycles, ramp rates, and hold times. The protocol has three distinct parts or zones. In the Zone 1 the test emulates the thermal profile of IPC TM650 – 2.4.24.5 (Glass Transition Temperature and Thermal Expansion of Materials Used in High Density Interconnection (HDI) and Microvias). Zone 2 simulates the thermal excursion associated with lead-free assembly and rework. Zone 3 is similar to the T260 protocol established in IPC 2.4.24.1 Time to Delamination (TMA Method) using the faster ramp rate of 100 °C/min. The three zones are illustrated in Figure 1.
Sample Preparation – Although clad and unclad “c” stage dielectric may be used; this test is typically preformed on samples of fabricated printed wire boards (PWB), with the copper ground planes extending throughout the sample. The sample is cut to approximately 6mm by 6mm. The sample is prepared in a manner to preserve the integrity of the dielectric material. The sample is placed on the stage, oriented to measure z-axis expansion (out of plane with internal glass fibers) of the board.
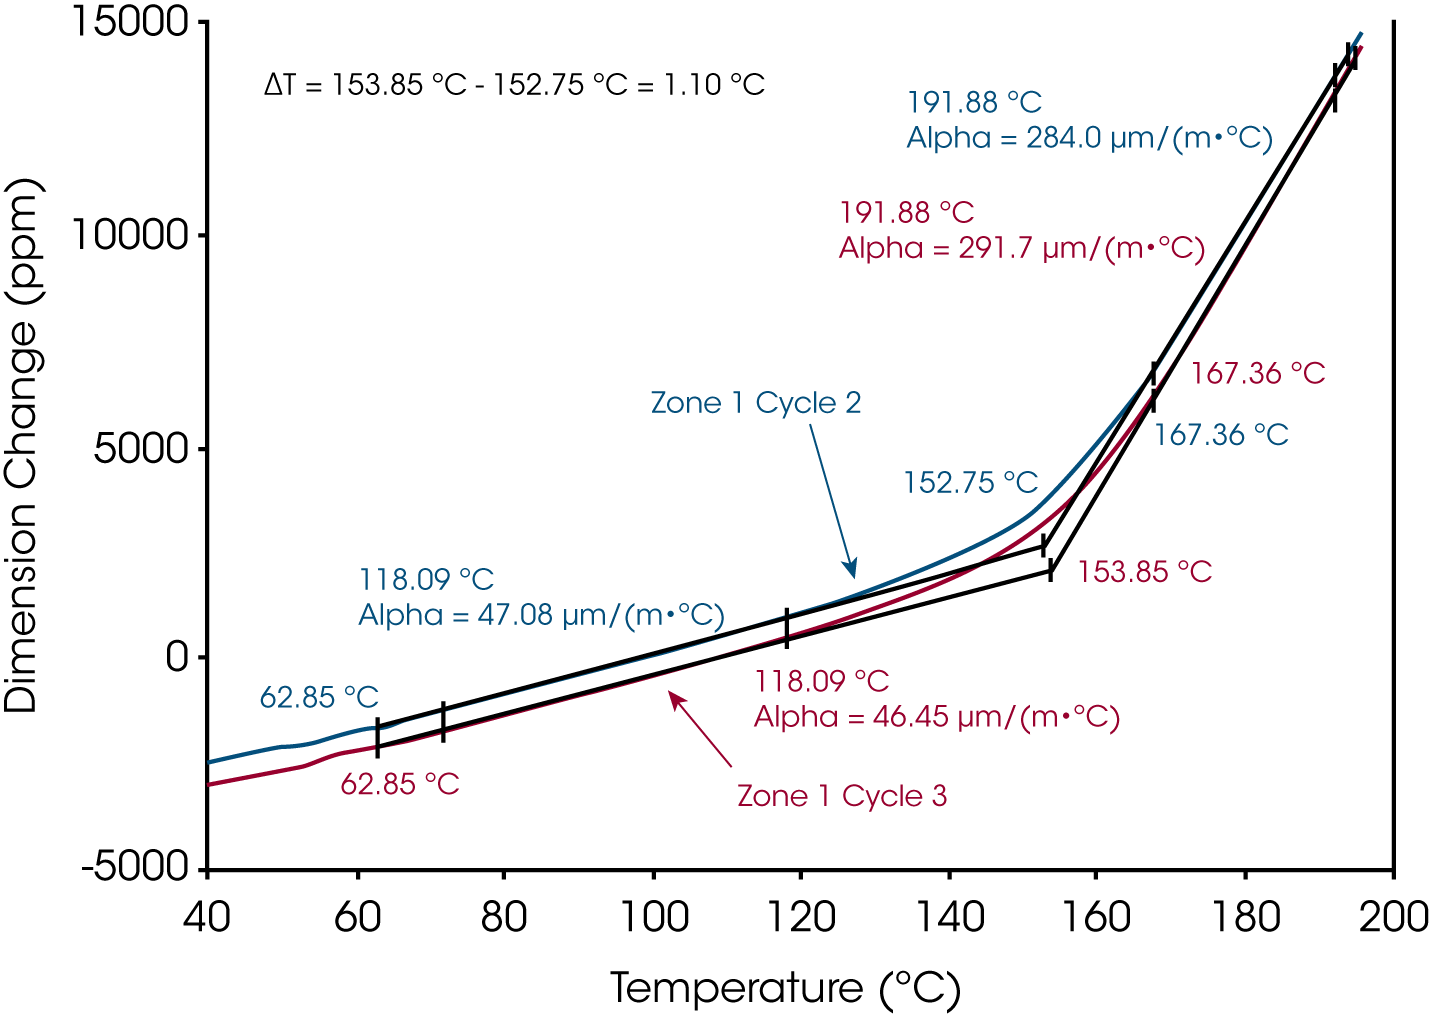
Zone 1 – This initial section has several functions; the primary objectives are to de-stress the sample and remove thermal history before the first glass transition (Tg) and coefficient of thermal expansion (CTE) measurement. The sample is cycled three times from ambient to 200 °C at a heating rate of 10 °C/min., and cooling rate of 20 °C/min. A surface probe is used with the pressure set to .05 N. The shape of the thermal expansion over time is noted for cycle 1. The CTE and Tg are measured on the 2nd and 3rd cycles. In TMA data, the Tg is detected as a change in the slope of the dimension change. The extrapolated onset temperature of this change is measured as the Tg. CTE is measured as the slope of the data before and after Tg in each case. Delta Tg is determined as changes in Tg between cycles 2 and 3. Representative data from this zone are included in Figure 2.
The CTE of the sample is a reflection of the strain that the board experiences in the end-use environment. The CTE is a combination of the various components including copper, glass, and epoxy. With higher copper layer counts, the CTE is expected to be reduced. With high resin constructions the CTE is increased. The Tg of the material is independent of the construction of the PWB. A delta Tg that is negative may reflect material that is degrading during thermal cycling. A delta Tg that is positive may suggest material is curing during thermal cycling. A delta Tg greater than ± 5°C is considered significant.


Zone 2 – This zone functions as a “mechanical” evaluation as the materials are stressed to traditional or lead-free assembly/rework temperatures. It is expected that coupons which have poor physical adhesion between layers of dielectric or between the dielectric and copper might fail during this portion of the test. Outgassing, due to volatiles or entrapped water, should be complete by the end of this zone. Six thermal cycles emulate the non-linear ramp rates that are used in assembly to the elevated temperature of 260 °C. The thermal excursions of Zones 1 and 2 may have an effect of ageing or, in some cases, curing the epoxy system, depending on how the materials were stored and how the PWB was processed by the fabricator. The six steps in the thermal profile in this zone are delineated in Table 1, and the programmed thermal method is given below.
Table 1. Overview of Cyclic TMA Protocol
| Zone | Pre | Zone 1 | Zone 2 | Zone 3 | ||||||||
|---|---|---|---|---|---|---|---|---|---|---|---|---|
| Cycles | 1 | 3 | 6 | 1 | ||||||||
| Ramp Rate | 10 | 10 | 20 | 181 | 98 | 73 | 49 | 38 | 100 | 100 | 5 | 20 |
| Temperature | 22 | 200 | 22 | 100 | 160 | 200 | 230 | 260 | 22 | 255 | 260 | 22 |
| Isothermal Time (min) | 1 | 0 | 1 | 0 | 0 | 0 | 0 | 0 | 2 | 0 | 90 | End |
TMA Thermal Method TA Advantage Software
- Force 0.05 N
- Data storage Off
- Equilibrate at 22.00 °C
- Isothermal for 1.00 min
- Data storage On
- Ramp 10.00 °C/min to 200.00 °C
- Mark end of cycle
- Ramp 20.00 °C/min to 22.00 °C
- Mark end of cycle
- Repeat segment 6 for 2 times
- Ramp 181.00 °C/min to 100.00 °C
- Ramp 98.00 °C/min to 160.00 °C
- Ramp 73.00 °C/min to 200.00 °C
- Ramp 49.00 °C/min to 230.00 °C
- Ramp 38.00 °C/min to 260.00 °C
- Mark end of cycle
- Ramp 100.00 °C/min to 22.00 °C
- Mark end of cycle
- Isothermal for 2.00 min
- Repeat segment 11 for 5 times
- Ramp 100.00 °C/min to 255.00 °C
- Ramp 5.00 °C/min to 260.00 °C
- Isothermal for 90.00 min
- Mark end of cycle
- Data storage Off
- Ramp 20.00 °C/min to 22.00 °C
Zone 2 is the assembly and rework simulation. As there are many different thermal profiles used in assembly the profile given is an exact replication of the thermal profile achieved when coupons are preconditioned used the methods described in IPC TM 650 (IPC 2.6.26 Current Induced Thermal Cycle Test) with the exception of achieving 260 °C instead of 150 °C. Using this thermal excursion profile assures that this protocol is directly related to reliability testing results. Failure in this zone has been attributed to a mechanical failure similar to adhesive delamination. Trapped volatiles, outgassing, or poor adhesion between laminated layers, (copper or dielectric), may result in delamination in this zone.
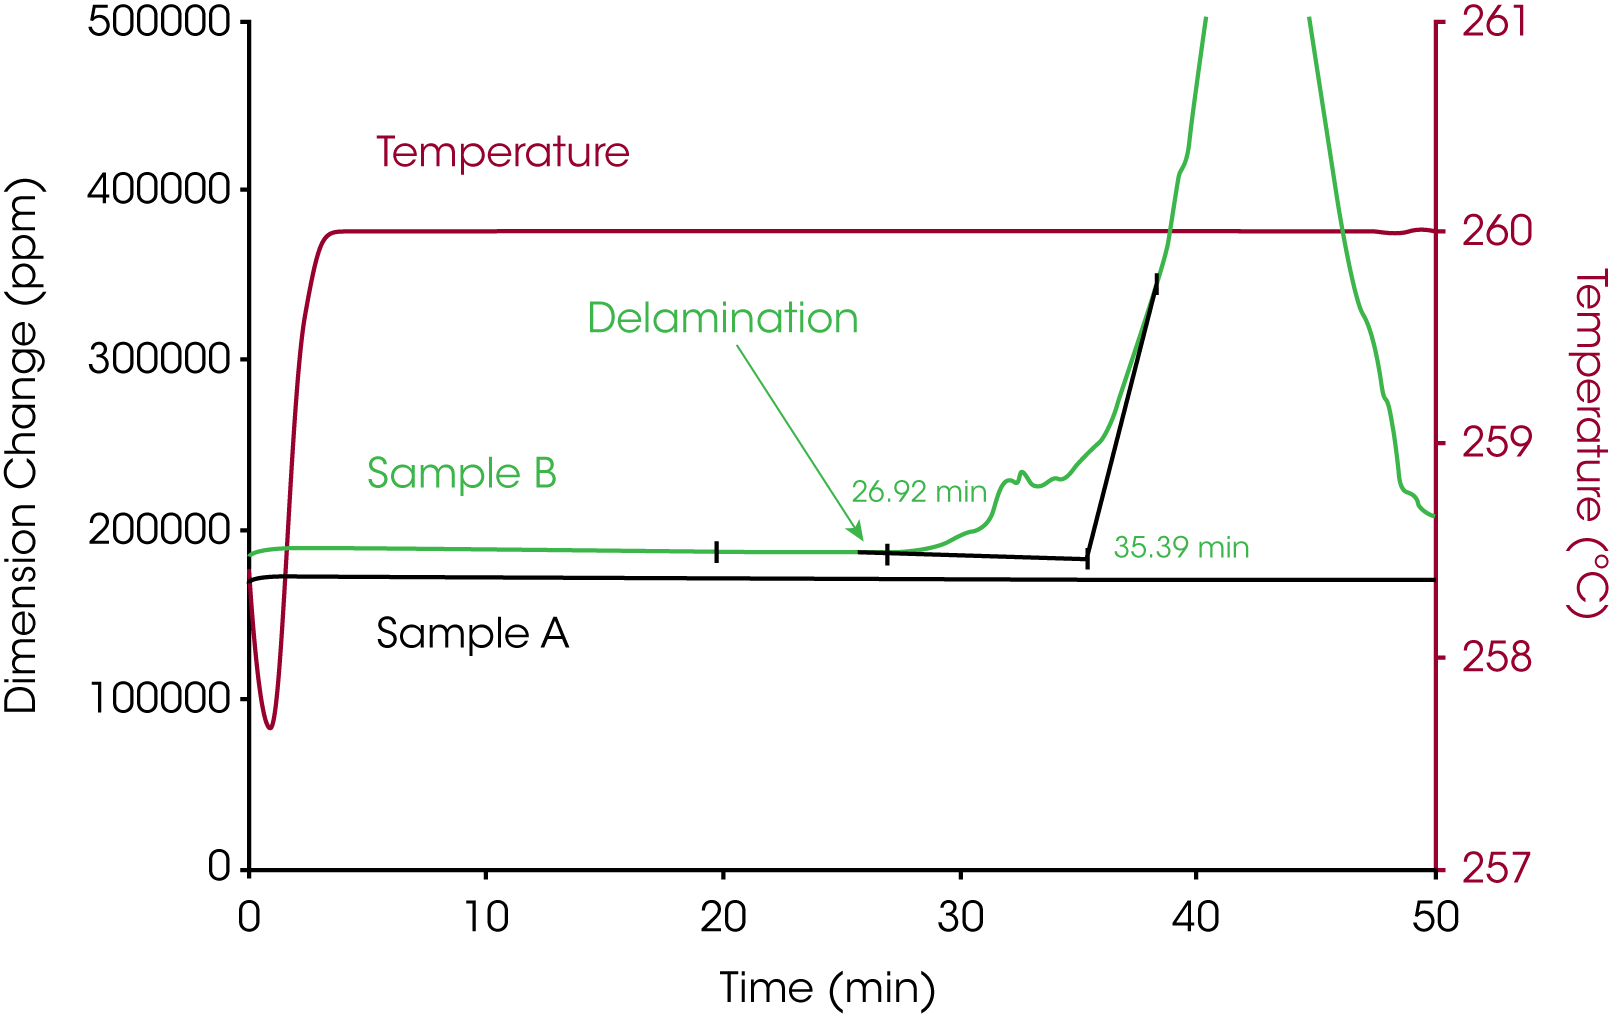
Zone 3 – Zone 3 is analogous to the existing T260 test specified in IPC – 650 – 2.4.24, Time to Delamination (TMA Method) with the ramp rate of 100 °C/minute and a maximum hold time of 90 minutes. Held at 260 °C, the epoxy component of the PWB tends to darken and may carbonize, if left for an extended period. It is believed that chemical decomposition is the dominant failure mode in this zone and that delamination at these temperatures is due to chemical rather than mechanical degradation. The rapid heating rate (100 °C/min) assures that the sample is not degrading during the thermal ramp to 260 °C. Because the sample size is small and there is usually copper present, thermal gradients are minimized. (T260 times to delamination at the slower temperature ramp of 20 °C/minute have been noted to be shorter than T260 time to delamination obtained from the faster ramp rate of 100 °C/minute.)
Figure 3 contains a comparison of the Zone 3 data for two different samples. The dimensional change of Sample A is stable during the 260 °C isothermal duration, indicating both chemical and physical stability. However, delamination of Sample B is evidenced from the rapid expansion commencing at about 27 min.

No standards have been established as to how long a material should resist delamination after achieving the isotherm in Zone 3. It has been noted that a material which fails before 10 minutes at 260 °C tends to perform poorly when subjected to reliability testing (IPC 2.6.26 Current Induced Thermal Cycle Test). It should further be noted that the reliability failure mode may be delamination, but early onset barrel cracks also appear in the plated-through-holes (PTHs). Failures in this zone frequently appear to relate to material degradation of the epoxy system, and appear to be less of a mechanical-based failure. Material ageing is evident, cross links are breaking in the epoxy, and cohesive delamination is observed. This delamination is not limited to the interfaces between laminated layers. Cracks may traverse the “C” and “B” stage boundaries.
In summary, the cyclic TMA test is an effective measure of the thermal stresses, (both physical and chemical) which the dielectric material undergoes during processing, and while complementing the industry standard tests and methods, provides additional information not obtainable by alternative protocols.
Acknowledgement
Paul Reid, Program Coordinator PWB Interconnect Solutions, Inc. Nepean, Ontario Canada, K2H 9C1 paul.reid@pwbcorp.com
Click here to download the printable version of this application note.

