Keywords: Sorption Analyzer, Discovery SA, Wood, Humidity
TA451
Introduction
Building and construction materials are required to be mechanically and structurally stable throughout the lifespan of structures. Wood and lumber are essential natural resources and versatile materials used in building and construction applications. The mechanical properties of wood are significantly affected by moisture content.[1] Wood is a porous and fibrous structural material that can absorb moisture from the atmosphere. Depending on the humidity and climate conditions, the moisture content of wood can change over time which can impact structural and mechanical integrity. Therefore, it is necessary to understand the water sorption behavior in wood.
Sorption analysis measures the moisture sorption behavior of a material.[2] The Discovery SA measures the weight change of a sample under controlled temperature and relative humidity (%RH) conditions. Temperature or %RH is held constant while the other parameter is changed either stepwise or continuously during a test. Stepwise changes of %RH will often see an instantaneous change of the weight and further equilibration to a stable weight over time. The time needed for equilibration depends on the temperature, %RH step and characteristic sorption kinetics of the material. Stepwise %RH sorption analysis provides the total amount of water content at equilibrium at a given %RH and the kinetics of the uptake. This can be important information for determining diffusion coefficients of water into a sample material.[3] The stepwise %RH sorption analysis at constant temperature is established as a quasi-standard method.
Experimental
The TA Instruments Discovery SA was used to determine the moisture adsorption and desorption behavior of three different types of wood samples. The wood was dried prior to the %RH step analysis by holding the samples at 0 %RH for multiple hours or until weight stabilization at 25 ºC. Drying under high temperature or vacuum is avoided because those conditions can change the structure of the material and hence change the sorption behavior. All the samples were analyzed isothermally at 25 ºC with humidity step up from 0%RH to 90%RH and then step-down humidity to 0%RH with 10%RH intervals during both absorption and desorption. A stabilization criterion was set to abort the current humidity step. When weight change stabilized within 0.01% with a 10-minute interval the test moved to the next %RH step of the method. The stabilization criterion helps reduce the total experimental time, while maintaining the accuracy of the results.
Results and Discussion
Sorption Behavior of Wood
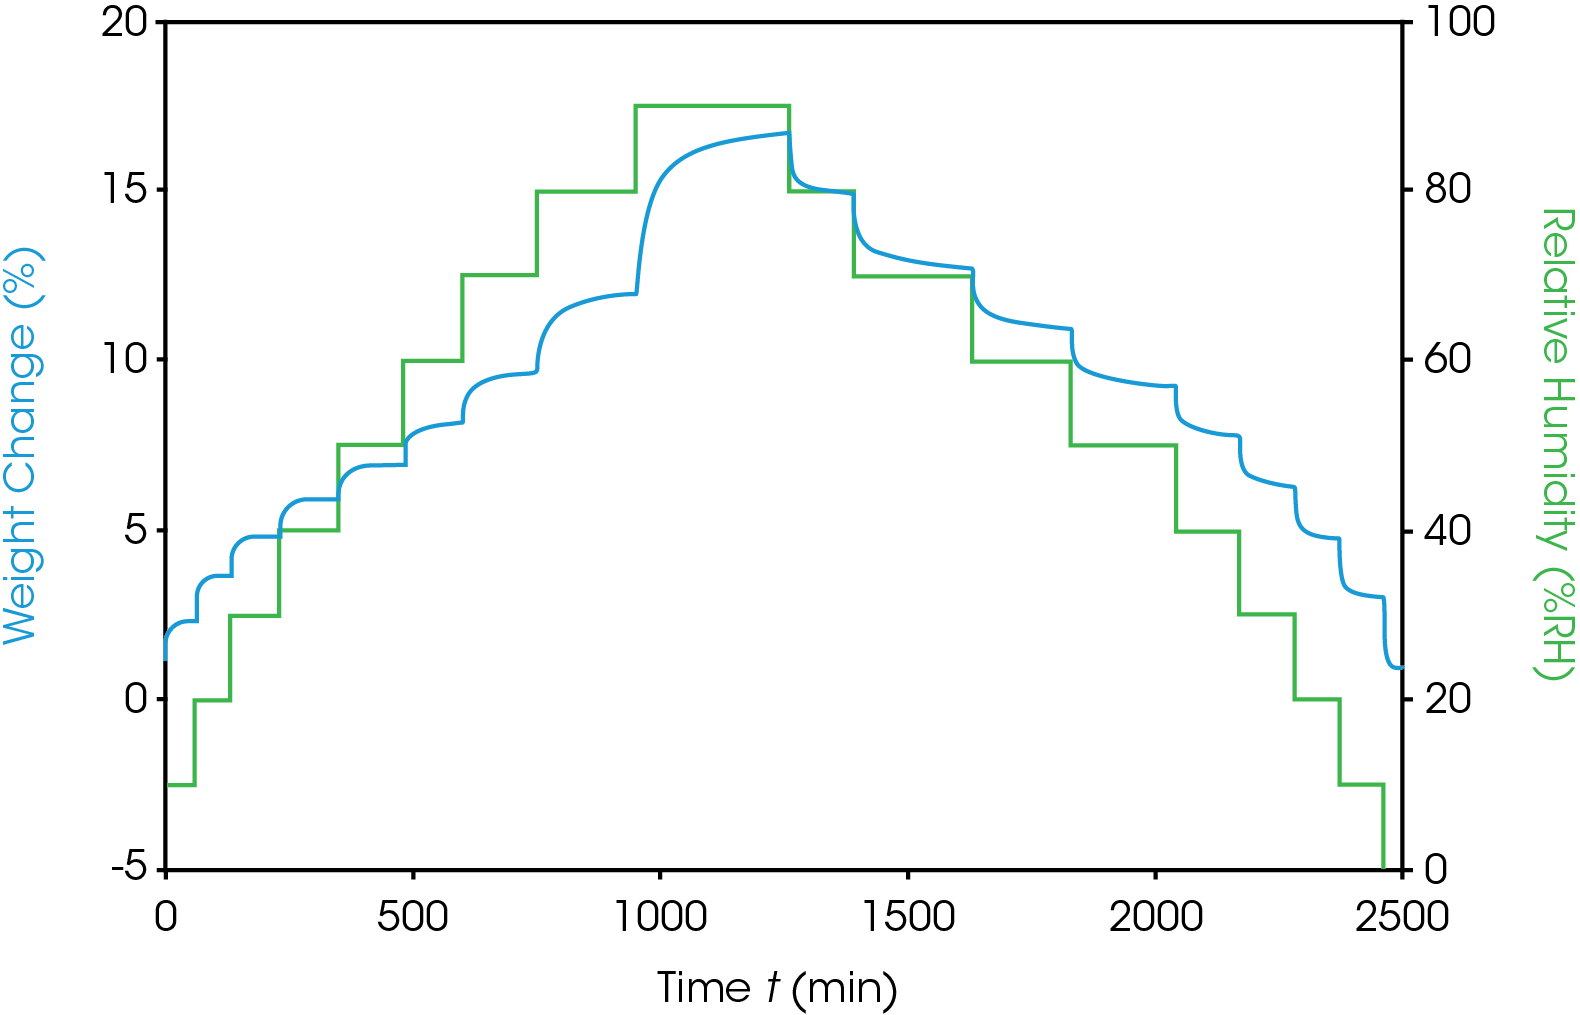
To study humidity impact on the wood materials, moisture sorption analysis with the humidity (%RH) step experiment over a broad range at constant temperature were performed. Moisture sorption analysis was performed three wood samples with a humidity (%RH) step experiment at a constant temperature. Figure 1 shows the raw data for the humidity step experiment for Wood 1. The green curve shows the humidity steps, while the blue curve shows percent weight change which occurs as the humidity changes. The sample weight increased with the rising %RH steps (adsorption) and weight decreased with the falling of the %RH steps (desorption). At a constant temperature, the time required to reach equilibrium depends on the relative humidity of the specific step. Higher humidities required longer time to reach equilibrium.
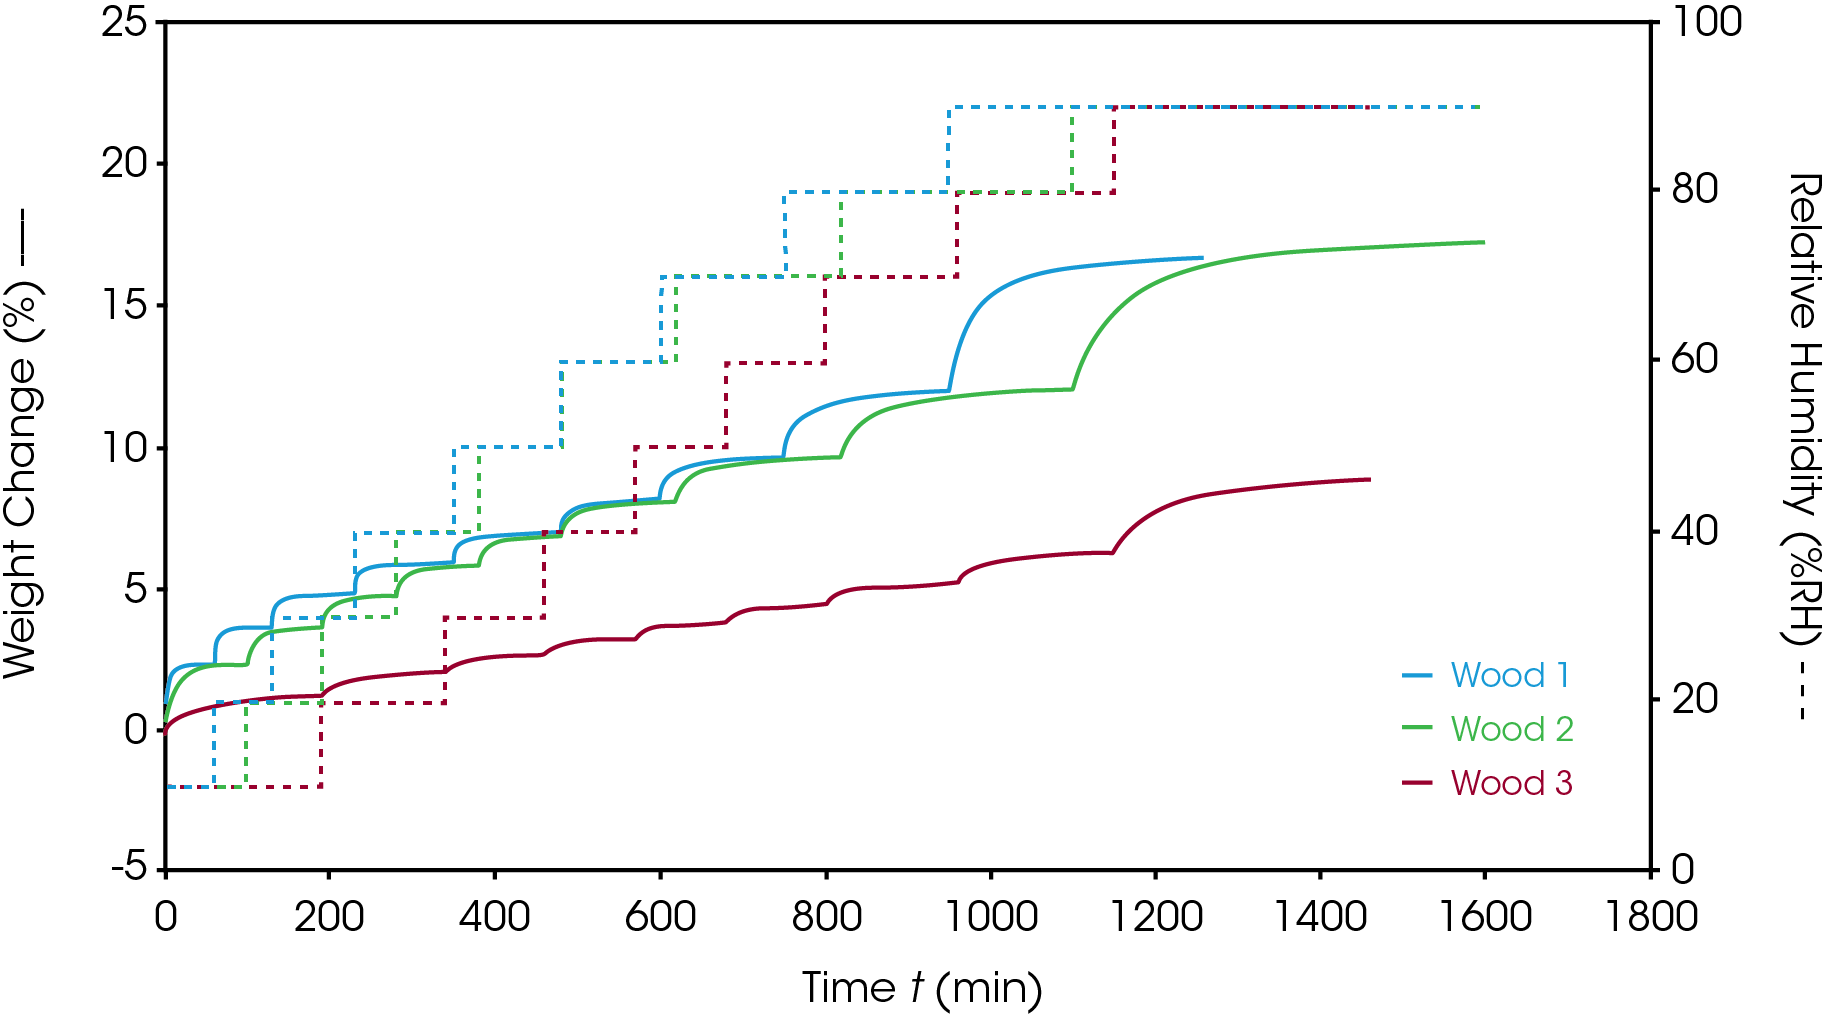
Three types of wood: Wood 1 (softwood), Wood 2 (hardwood) and Wood 3 (laminate) were analyzed for their sorption behaviors. The overlay of the Stepwise %RH sorption analysis is shown in Figure 2. All 3 samples were run with same sorption/desorption method. The time required to reach equilibrium at each %RH step is characteristic of the sorption kinetics of each sample. Wood 1 showed a faster sorption kinetics compared to Wood 2. Regardless, the equilibrium water content was similar in both samples. Wood 3 contains a laminate layer which reduces the amount of moisture sorption, and which resulted in significantly lower water absorbed compared to Wood 1 and 2. The equilibrium weight change can also be extracted from the data as the final value at the end of each %RH step. The equilibrium weight changes of the 3 wood samples are listed in Table 1. It is observed that Wood 3 has nearly half the weight change of Wood 1 and Wood 2 at equilibrium.


Table 1. Equilibrium Weight Change at Each %RH Step
| Weight Change % | |||
|---|---|---|---|
| Relative Humidity %RH | Wood 1 | Wood 2 | Wood 3 |
| 0 | 0.0 | 0.0 | 0.0 |
| 10 | 2.3 | 2.3 | 1.3 |
| 20 | 3.7 | 3.6 | 2.1 |
| 30 | 4.8 | 4.8 | 2.7 |
| 40 | 5.9 | 5.8 | 3.3 |
| 50 | 7.0 | 6.9 | 3.8 |
| 60 | 8.2 | 8.1 | 4.4 |
| 70 | 9.7 | 9.7 | 5.2 |
| 80 | 12.0 | 12.0 | 6.3 |
| 90 | 16.7 | 17.3 | 8.9 |
Sorption Isotherm of Wood
A sorption isotherm can be generated by plotting the equilibrium weight change shown in Table 1 against %RH. A sorption isotherm is a good way to present the data when studying moisture-sample interactions. The shapes of the sorption isotherms can be related to different sorption behaviors.[4] TRIOS software can generate the sorption isotherm automatically with the file transformation feature. An analysist will want to make sure that the samples reach equilibrium at the end of each humidity step before generating a sorption isotherm.
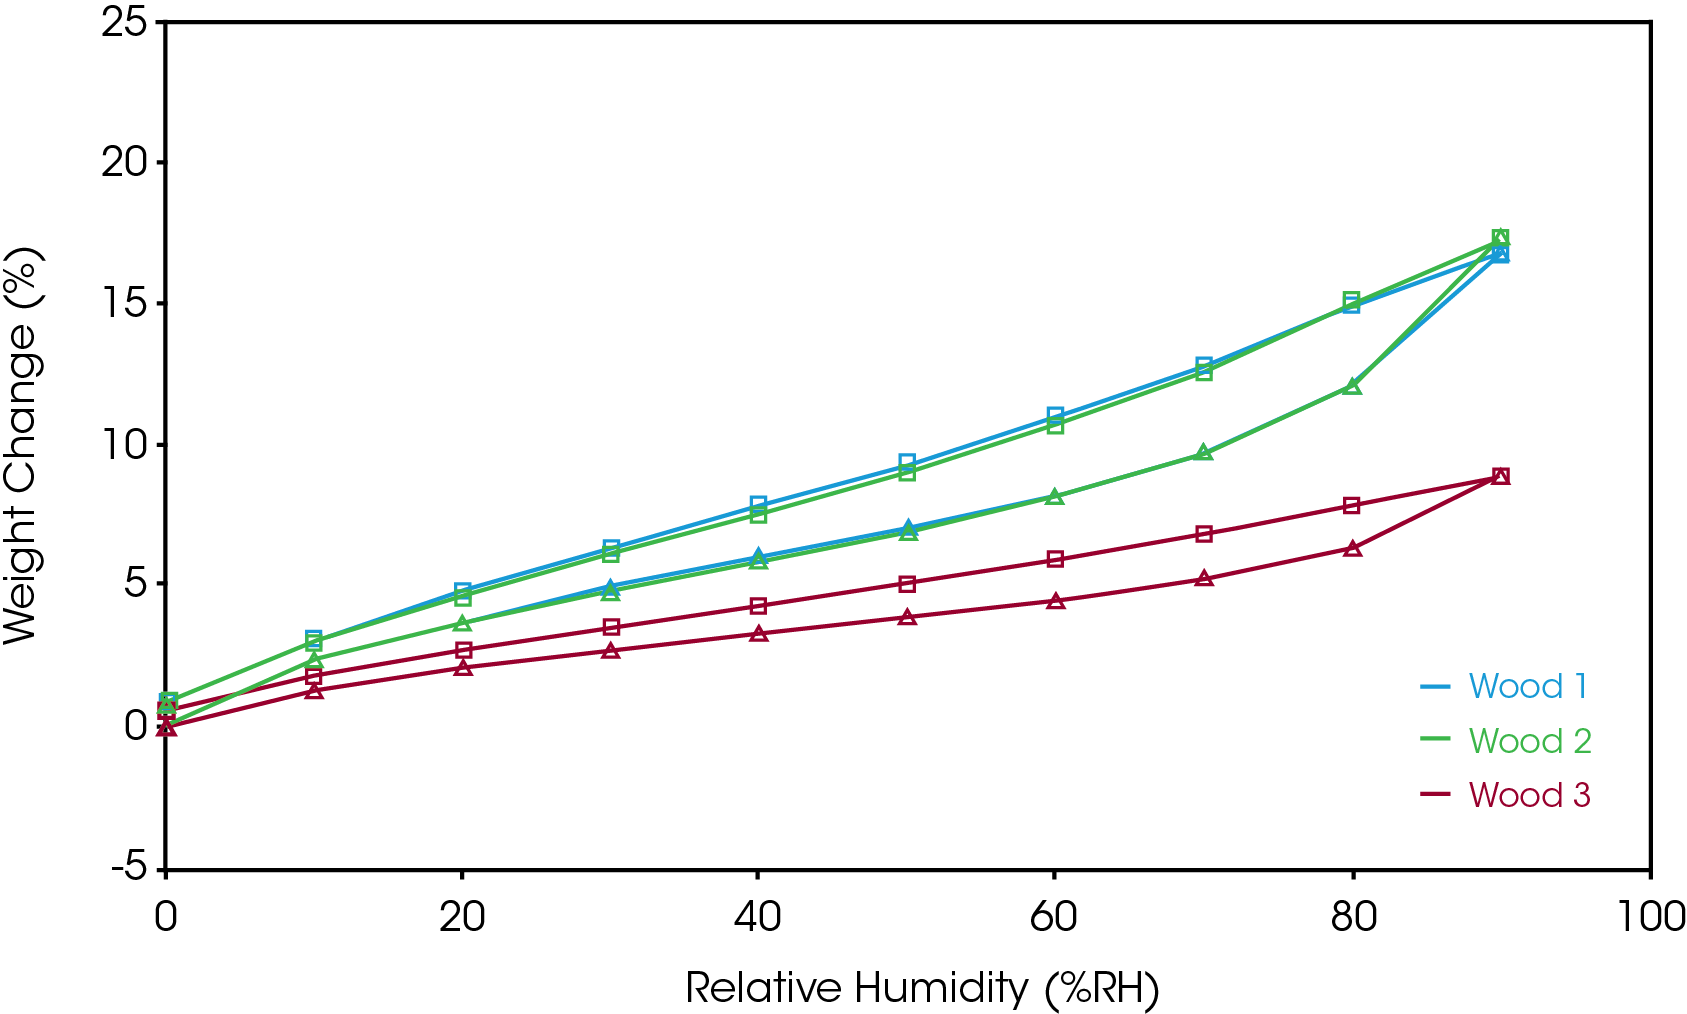
Figure 3 shows the sorption isotherms of the wood samples during both adsorption and desorption. Wood 1 and 2 show an overlap in their sorption isotherm data despite the different sorption kinetics observed in Figure 2. The wood samples show Type II adsorption with hysteresis. This means the sorption isotherm generated from adsorption may not necessarily be the same as the desorption isotherm. Equilibrium moisture content of desorption is often higher than the adsorption for a given %RH at constant temperature. The difference in moisture content between adsorption and desorption results in moisture sorption hysteresis. The hysteresis results from sample-moisture interaction or material change.

Conclusion
Sorption analysis is an important analytical tool for the characterization of wood or any construction materials where the impact of humidity is important to material performance. The Discovery SA from TA Instruments is able to measure accurate moisture absorption and desorption over varied levels of relative humidity. The time required to reach equilibrium is characteristic of a material’s sorption kinetics. A sorption isotherms can be easily generated to understand the water content at equilibrium conditions. Both sorption isotherm and sorption kinetics should be used for construction materials characterization.
References
- Gerhards, C.C. Effect of Moisture Content and Temperature on the Mechanical Properties of Wood: An Analysis of Immediate Effects. Wood and Fiber, 14(1), 1982, pp 4-36
- Hassel, R. L. Moisture Sorption Analysis of Pharmaceuticals. TA Instruments Applications Notes TA 329A
- Thybring, E., Glass, S. V., and Zelinka, S. L. Kinetics of Water Vapor Sorption in Wood Cell Walls: State of the Art and Research Needs Forests 2019, 10(8), 704
- Brunauer, S. The adsoption of Gases and Vapors Vol 1. Oxford University Press, 1943.
- Engelund, E.T.; Thygesen, L.G.; Svensson, S.; Hill, C.A.S. A critical discussion of the physics of wood-water interactions. Wood Sci. Technol. 2013, 47, 141–161
Acknowledgement
This note was contributed by Hang Kuen Lau, Ph.D., TA Instruments.
Click here to download the printable version of this application note.

