Safety Evaluation of Lithium-ion Battery Cathode and Anode Materials Using Differential Scanning Calorimetry

Abstract

Thermal runaway in lithium-ion batteries is a critical safety concern. It can occur when electrode materials undergo exothermic reactions that cause rising temperatures and accelerated reaction kinetics. It is known that the state-of-charge of a battery can impact the onset temperature, mechanism, and energy release of reactions. Differential scanning calorimetry can be used to evaluate the thermal stability of cathode and anode materials at various states-of-charge. The onset temperature of reactions, as well as peak reaction temperature and energy released, can be determined by scanning materials across a range of temperatures using differential scanning calorimetry (DSC). In this note, a lithium nickel manganese cobalt (NMC) cathode and graphite anode are evaluated, finding higher reaction energy in the cathode, and increasing thermal stability with decreasing state-of-charge.

Introduction

Lithium-ion batteries (LIB) are widely used in a variety of applications due to favorable properties such as high energy density. Battery management systems are required, however, due to safety concerns with LIB. When a battery is overcharged, exposed to high temperatures, or short circuited, thermal runaway can occur. Reaching a critical temperature results in exothermic reactions that cause the temperature to continue to rise, which only accelerates the reaction kinetics. Catastrophic degradation occurs during thermal runaway, leading to toxic gases and battery ignition.

It has been established that the state-of-charge (SOC) of a LIB directly impacts thermal runaway. Differences in the SOC change the thermal configuration of the battery cell, and the thermal hazard is reduced in batteries with lower SOC since the reduction in charge lowers the potential energy release [1] [2]. The materials used in the battery also affect thermal runaway and understanding the onset temperatures of thermal runaway for various formulations and SOC is important in thermal management design and prevention of thermal runaway.

Differential scanning calorimetry can be used to measure the heat flow of electrode materials. Scanning across a range of temperatures allows detection of exothermic reactions that may lead to thermal runaway. The impact of SOC of materials on the onset temperature and amount of energy released can be measured, making differential scanning calorimetry a useful tool in battery safety evaluation.

Experimental

Batteries at different states-of-charge were provided by NEI Corporation with an NMC811 cathode and graphite anode. Prior to testing, the battery was torn down and the electrode washed with dimethyl carbonate (DMC) to remove electrolytes. This step ensures that the measurements evaluate only the cathode and anode materials without capturing electrolyte degradation [3]. After drying the electrode, the active anode and cathode materials were removed from the current collector for testing. For comparison to the charged samples, as-received cathode and anode samples were also prepared using the same washing and drying procedure as the SOC samples.

A TA Instruments Differential Scanning Calorimeter (DSC) was used to measure the heat flow of the electrode materials. Samples of approximately 5 mg were loaded into the new high temperature high pressure pan (P/N 900803.901) and ramped at 5 °C/min up to 450 °C. The onset temperature, heat of reaction (enthalpy), and peak temperature were analyzed using TRIOS software.

Results and Discussions

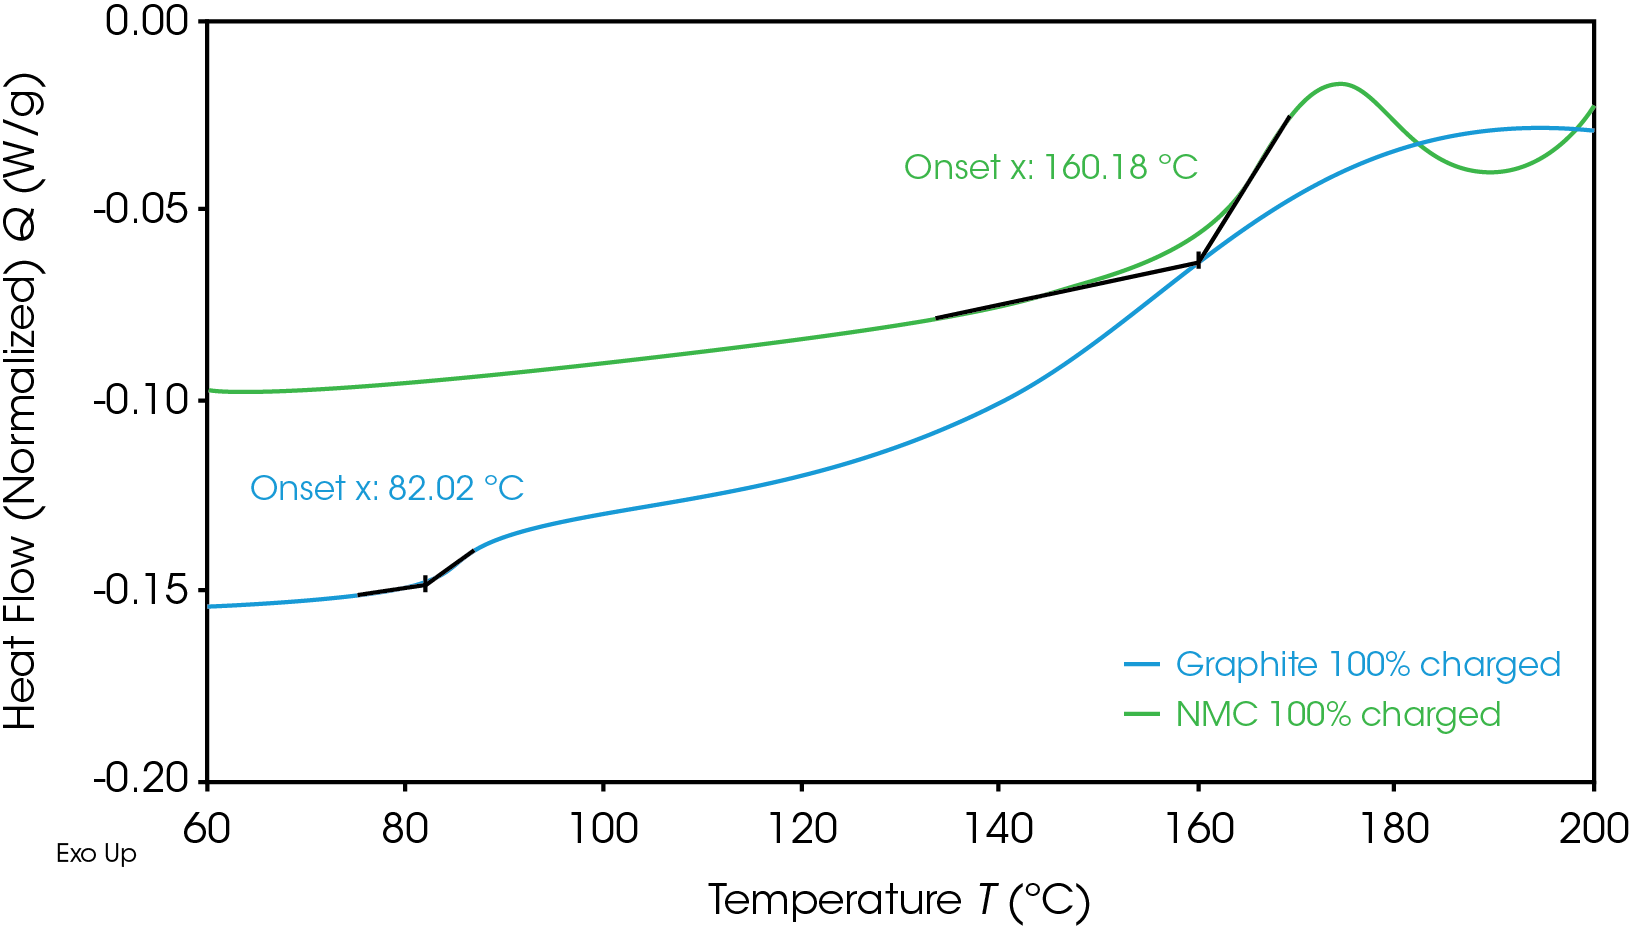
Onset temperatures for the fully charged NMC cathode and graphite anode are shown in Figure 1. The first onset temperature, which is the first exothermic shift observed in the baseline, is often related to the initial decomposition of the solid electrolyte interphase (SEI) layer, which can then lead to undesirable exothermic reactions. The anode has a lower onset temperature of 82 °C, which is typical for common graphite anodes. Graphite anodes often show initial decomposition of SEI between 80 °C and 120 °C [4].

Figure 1. Onset temperatures of NMC cathode and graphite anode at 100% SOC.

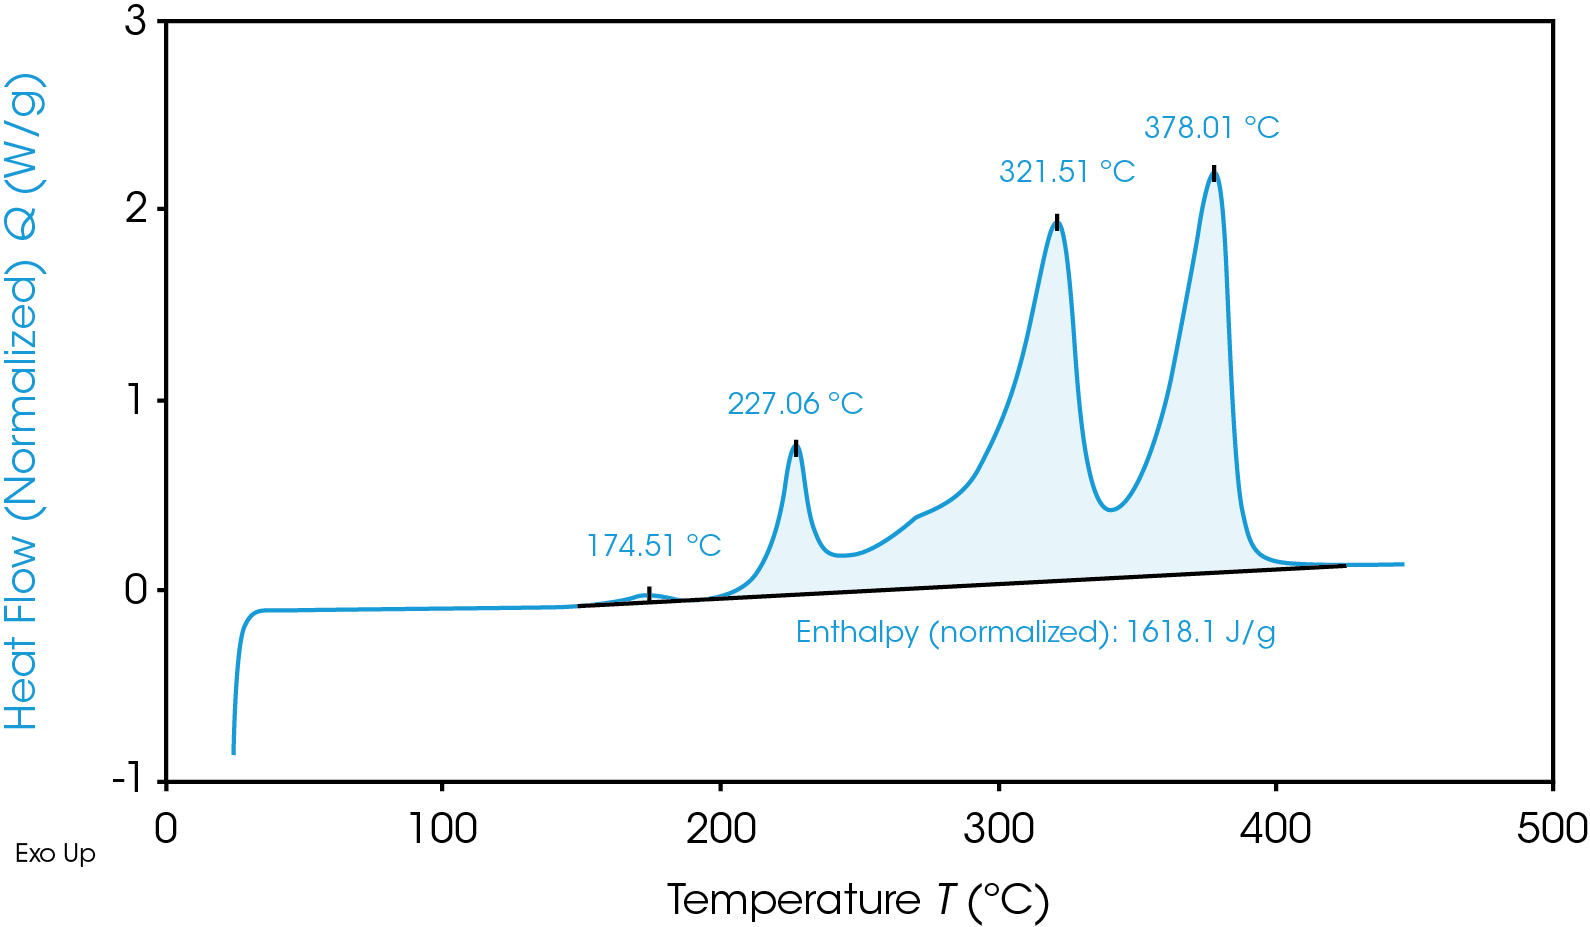
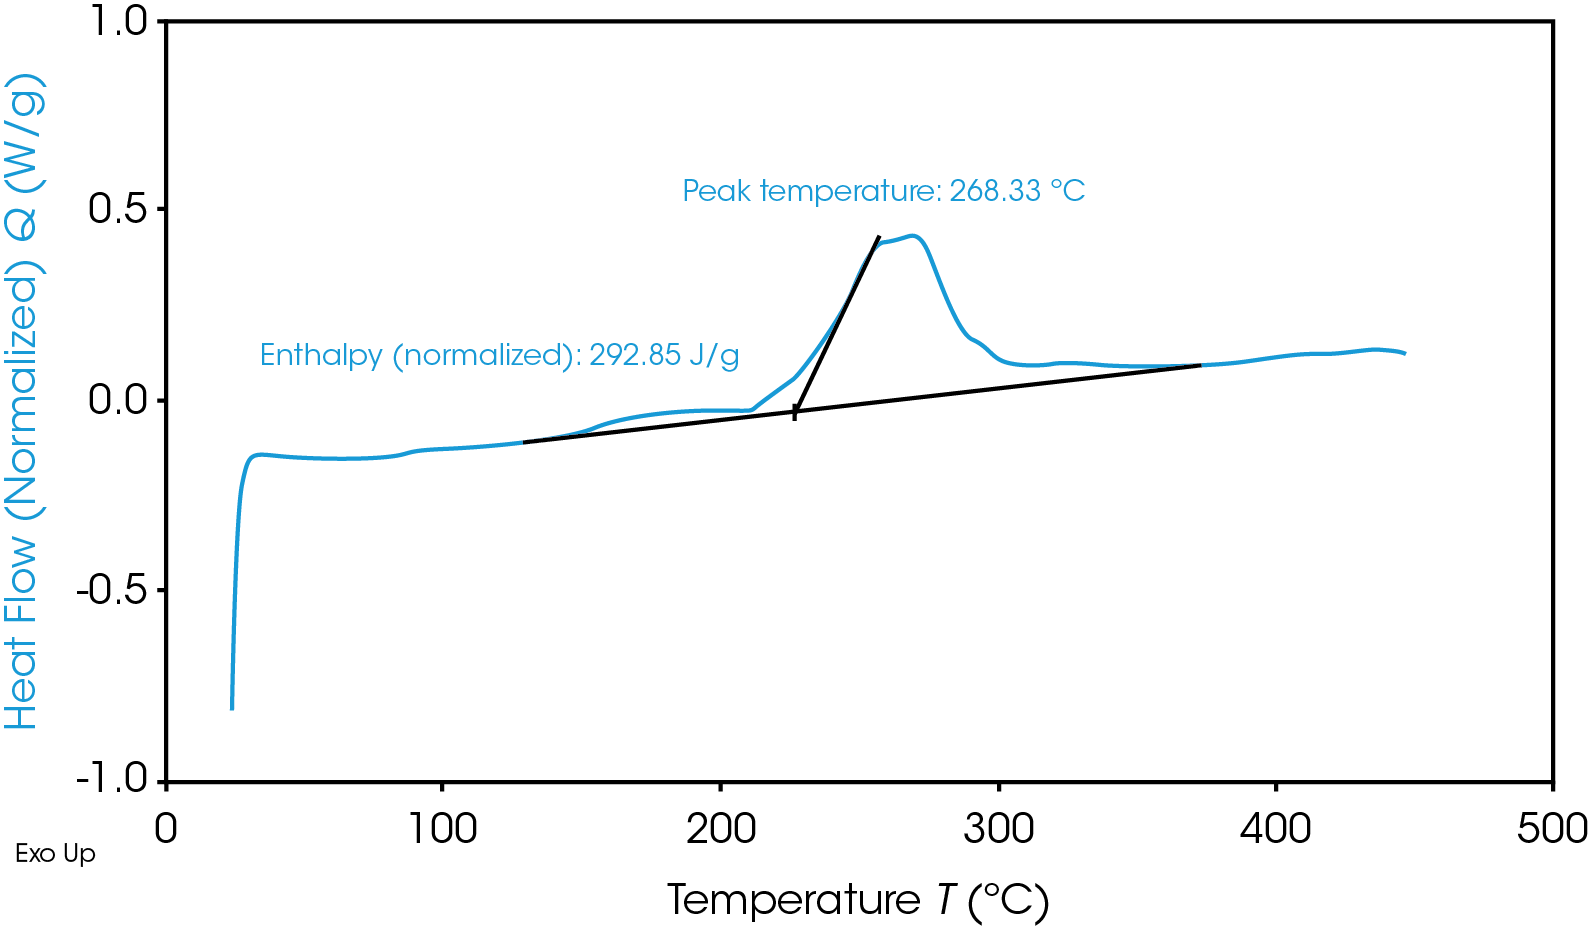
Despite having a lower onset temperature, the graphite anode is overall less energetic than the NMC cathode, as shown in Figure 2 by the smaller area under the graphite heat flow signal. This area is the enthalpy of reaction and can be calculated by integrating the heat flow signal curve. The 100% SOC NMC cathode has an enthalpy of 1618 J/g and the 100% SOC graphite anode enthalpy is 345 J/g. The 100% SOC NMC cathode experiences more energetic exothermic reactions than the 100% SOC graphite anode. Exothermic reactions, related to the degradation of the cathode materials, occur at 227 °C, 321 °C, and 378 °C. Above 270 °C, NMC is known to become thermally unstable and release oxygen [5]; the peaks at 321 °C and 378 °C may be related to this thermal instability. The fully charged graphite anode has a much smaller exothermic reaction at 268 °C. The higher energy release of the cathode reactions is more likely to cause thermal runaway and propagation across batteries.

Figure 2. Heat flow signal of the NMC cathode
Figure 2. Heat flow signal of the NMC cathode (left) and graphite anode (right) at 100% SOC.
graphite anode (bottom) at 100% SOC.

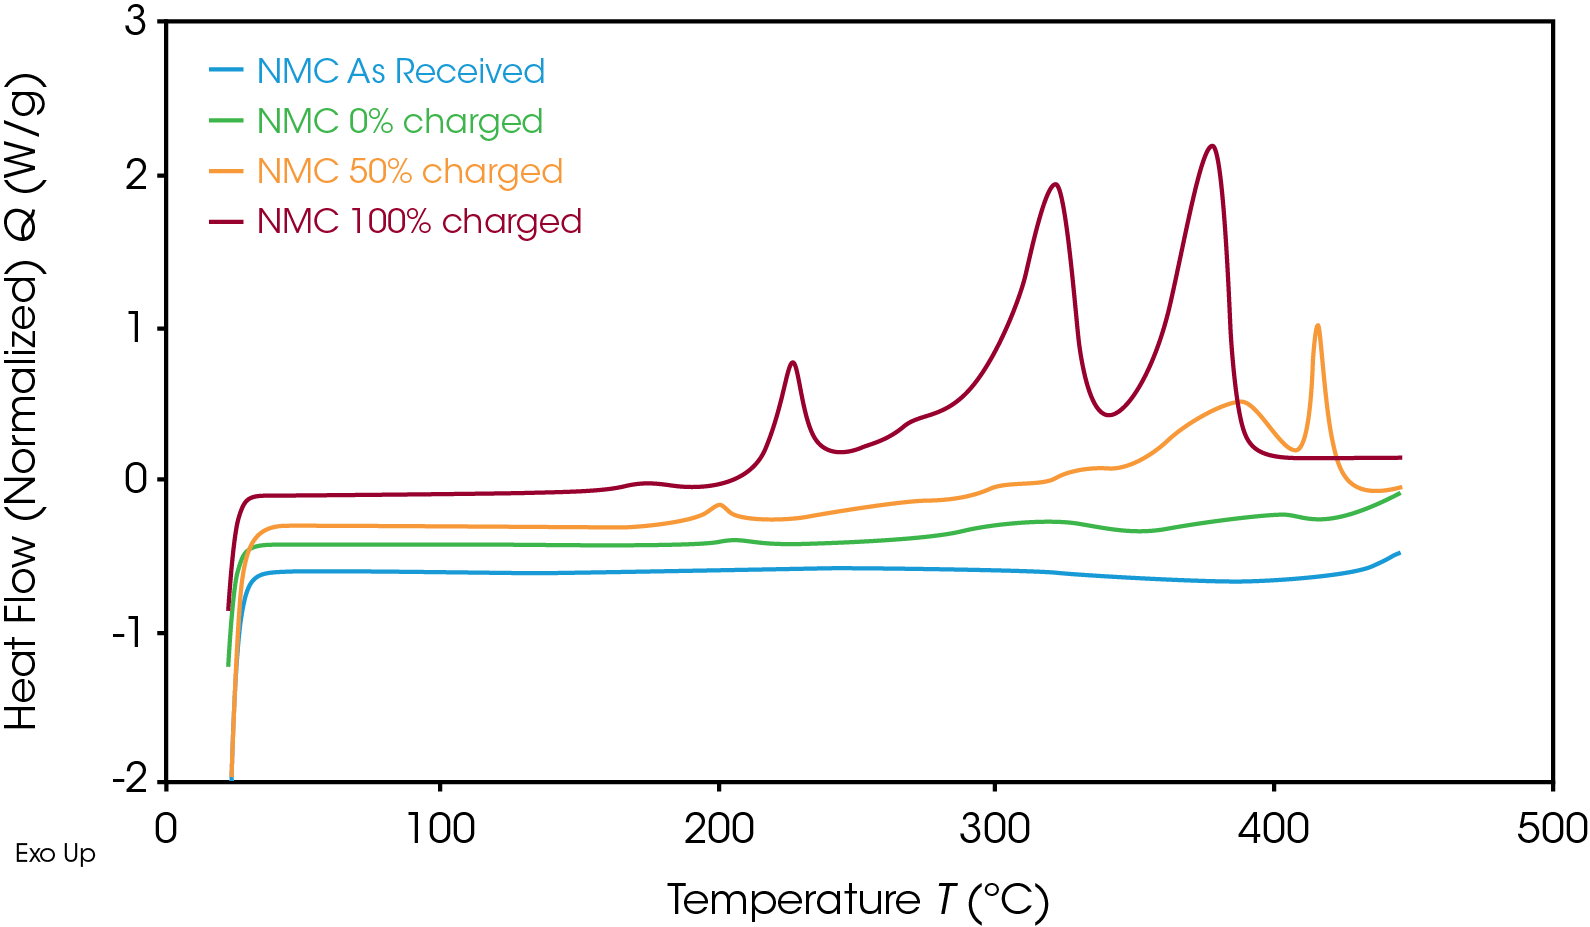
The heat flow signal of the NMC cathode at various SOC is shown in Figure 3. As the SOC decreased, the thermal stability increased. At 50% SOC, the main exothermic event peak shifted from 378 °C to a higher temperature of 416 °C and released less energy than at 100% SOC. The uncharged cathode material experienced no exothermic reactions.

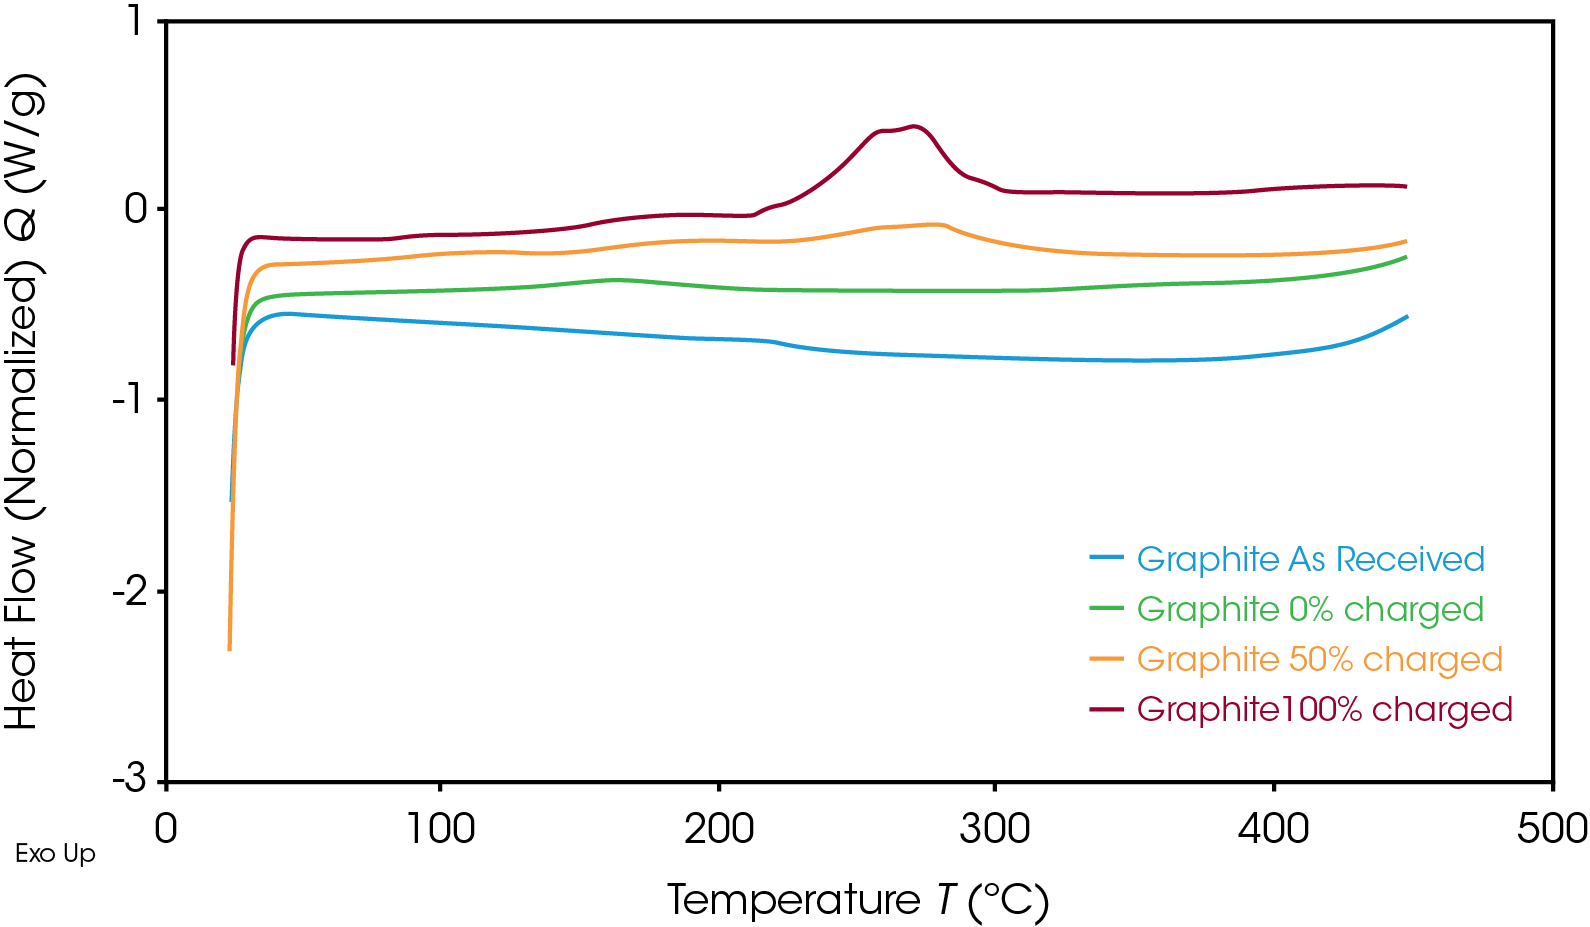
As expected, the anode followed the same trend, as shown in Figure 4. Once the SOC of the anode decreased, the corresponding heat flow also decreased. The exothermic reaction released less energy at 50% SOC than at 100% SOC. The enthalpy per unit mass for both materials at various SOC is shown in Table 1.

Table 1. Enthalpy of reactions at various SOC for the NMC cathode and graphite anode

Enthalpy (J/g) NMC Cathode Graphite Anode
0% SOC 72.1 49.8
50% SOC 625 216
100% SOC 1618 345
Figure 3. Overlay of heat flow signal for the NMC cathode as received and at 100%, 50%, 0% SOC.
Figure 4. Overlap of the heat flow signal for the graphite anode as received and at 100%, 50%, and 0% SOC.

When uncharged, the enthalpy of reaction for the graphite anode and NMC cathode is similar. For this battery, however, the energy released in the charged graphite anode is significantly lower than that of the charged NMC cathode, showing that the cathode has a higher risk of causing thermal runaway. The fully charged cathode releases more than three times the energy of the fully charged anode for this battery; this energy release is more likely to drive reactions in the battery that lead to thermal runaway. It is important that both electrodes be studied to determine which materials have the higher risk factors and what temperatures need to be avoided. The fully charged battery must remain below onset temperature to avoid unsafe degradation and thermal instability. The DSC results help to design thermal management systems through understanding the safety parameters of the battery materials.

Conclusions

DSC can be used for safety analysis of electrode materials regarding thermal runaway. The temperature of reactions that may lead to thermal runaway can be determined, as well as the amount of energy released during the degradation reactions. Electrodes of different SOC (100%, 50%, 0%) were analyzed, with the 100% SOC NMC cathode showing the highest risk for thermal runaway and propagation across batteries. When the SOC decreased to 50%, the NMC became more thermally stable, with the exothermic reaction shifting to a higher temperature. The graphite anode, while following the same trend with regards to SOC, released significantly less energy than the cathode.

References

  1. L. Torres-Castro, A. Kurzawski, J. Hewson and J. Lamb, “Passive mitgation of cascading propagation in multi-cell lithium ion batteries,” Journal of the Electrochemical Society, vol. 167, no. 9, 2020.
  2. A. W. Golubkov, S. Scheikl, R. Planteu, G. Voitic, H. Wiltsche, C. Stangl, G. Fauler, A. Thaler and V. Hacker, “Thermal runaway of commercial 18650 Li-ion batteries with LFP and NCA cathodes- impact of state of charge and overcharge,” RSC Advances, vol. 5, pp. 57171-57186, 2015.
  3. Z. Zhang, D. Fouchard and J. R. Rea, “Differential scanning calorimetry material studies: implications for the safety of lithium-ion cells,” Journal of Power Sources, vol. 70, pp. 16-20, 1998.
  4. X. Feng, M. Ouyang, X. Liu, L. Lu, Y. Xia and X. He, “Thermal runaway mechanism of lithium ion battery for electric vehicles :A review,” Energy Storage Materials, vol. 10, pp. 246-267, 2018.
  5. K. Kim, D. Kam, C. C. Nguyen, S.-W. Song and R. Kostecki, “Study on the Dominant Film-Forming Site Among Components of Li(Ni1/3Co1/3Mn1/3)O2 Cathode in Li-ion Batteries,” Bulletin of the Korean Chemical Society, vol. 32, no. 8, 2011.

Acknowledgement

This note was a collaboration between NEI Corporation (Somerset, New Jersey) and TA Instruments. It was written by Jennifer Vail, PhD and Hang Lau, PhD, New Market Development Scientific Lead at TA Instruments.

Click here to download the printable version of this application note.

Contact us to learn more about our instrumentation and how it can benefit your research.

[ult_buttons btn_title=”Contact Us” btn_link=”url:https%3A%2F%2Fwww.tainstruments.com%2Fsales-contact%2F” btn_align=”ubtn-center” btn_size=”ubtn-small” btn_title_color=”#ffffff” btn_bg_color=”#0092dd” btn_bg_color_hover=”#0092dd” btn_title_color_hover=”#ffffff” icon_size=”32″ btn_icon_pos=”ubtn-sep-icon-at-left” btn_border_style=”solid” btn_color_border=”#0092dd” btn_color_border_hover=”#0092dd” btn_border_size=”1″ btn_radius=”3″ btn_font_style=”font-weight:bold;” btn_font_size=”desktop:16px;”]