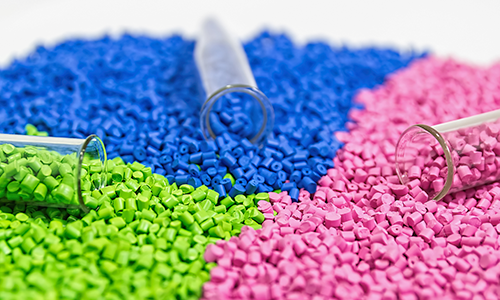
Los aditivos poliméricos aumentan las propiedades de la resina y añaden valor adaptándola para aplicaciones específicas. Los piensos y masterbatchers combinan las resinas netas con una mezcla adecuada de estabilizadores, compatibilizadores, antioxidantes o colorantes para producir formulaciones listas para procesar. Los convertidores pueden procesar directamente estos compuestos preformulados; como opción, los masterbatches concentrados constituyen una opción flexible y económica para dispensar aditivos, ya que fluyen con la resina base durante el procesamiento.
Los fabricantes de aditivos, piensos y masterbatches utilizan la caracterización de polímeros para entender en profundidad las propiedades de la resina entrante, evaluar cómo la modifican los aditivos y garantizar que sus clientes puedan procesarlas correctamente.
Instrumentos y parámetros de prueba
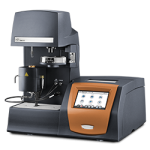
Calorímetros diferenciales de barrido (DSC)
Transición de fase
- Temperatura de fusión (Tm)
- Calor de fusión
- Transición vítrea (Tg)
- Cristalinidad
Estabilidad térmica
- Tiempo de inducción de oxidación (OIT)
- Tiempo de inicio de oxidación (OOT)
Analizadores termogravimétricos (TGA)
Estabilidad térmica
- Temperatura de descomposición
Determinación de la composición
- Contenido volátil o solvente
- Contenido de relleno (residuo)
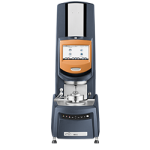
Procesabilidad
- Curva de flujo de viscosidad
- Viscosidad de corte cero
- Propiedades viscoelásticas (módulo de almacenamiento, módulo de pérdida)
- Módulo y frecuencia del punto de cruce
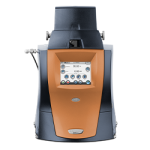
Análisis mecánico dinámico (DMA)
Propiedades mecánicas de los materiales
- Módulo de almacenamiento, módulo de pérdida, tan Δ
Ejemplos de aplicación – caracterización de polímeros y procesamiento
En un nivel básico, los pasos clave del procesamiento termoplástico pueden descomponerse en 3 procesos fundamentales:
- Calor para fusionar / ablandar la resina
- Deformarse para lograr la forma definitiva
- Enfriar el producto y liberar
Estos tres pasos son aplicables a todas las técnicas de procesamiento de polímeros, desde el moldeo por inyección y la extrusión hasta la termoformación y el moldeo de láminas por soplado, aunque varíen los detalles de los parámetros de producción. En este punto, analizamos más de cerca las cuestiones clave que suelen surgir en cada etapa del procesamiento de polímeros y que ilustran las respuestas con los conocimientos que nos brindan las técnicas de caracterización de polímeros.
¿Cuál es la temperatura de procesamiento de esta resina?
Entender las temperaturas a las que se ablandan y funden los polímeros es una propiedad material fundamental y pertinente para el procesamiento de polímeros. Como uno de los primeros pasos en los procesos de extrusión, moldeo por inyección y moldeo en láminas por soplado, se calientan los pellets a una temperatura superior al punto de fusión; para la termoformación y el moldeo por soplado, se la calienta por encima de su temperatura de transición vítrea para ablandarla, pero sin fundirla por completo. Esta transformación de un pellet de resina sólida (estado de energía inferior) a un pellet ablandado o totalmente fundido (estado de energía superior) exige el aporte de energía y puede medirse por calorimetría diferencial de barrido (DSC).
En un ensayo de DSC, se monitorea el flujo de calor de la muestra a medida que se incrementa la temperatura a un ritmo constante. Las transiciones térmicas, como la fusión y la transición vítrea se presentan como eventos endotérmicos, en los que el material absorbe calor al moverse hacia el estado de energía superior. Los resultados también revelan información acerca de la morfología del polímero, con diferencias claras entre los estados amorfo y semicristalino. Durante el primer ciclo de calentamiento del ensayo de DSC, los materiales amorfos pueden exhibir una gran transición vítrea sin fusión, mientras que los polímeros semicristalinos tienen un pico de fusión agudo y bien definido. Dado que las temperaturas de transiciones vítreas y de fusión son únicas de cada polímero, puede usarse esta información para evaluar rápidamente la calidad de la materia prima entrante, antes de procesar.
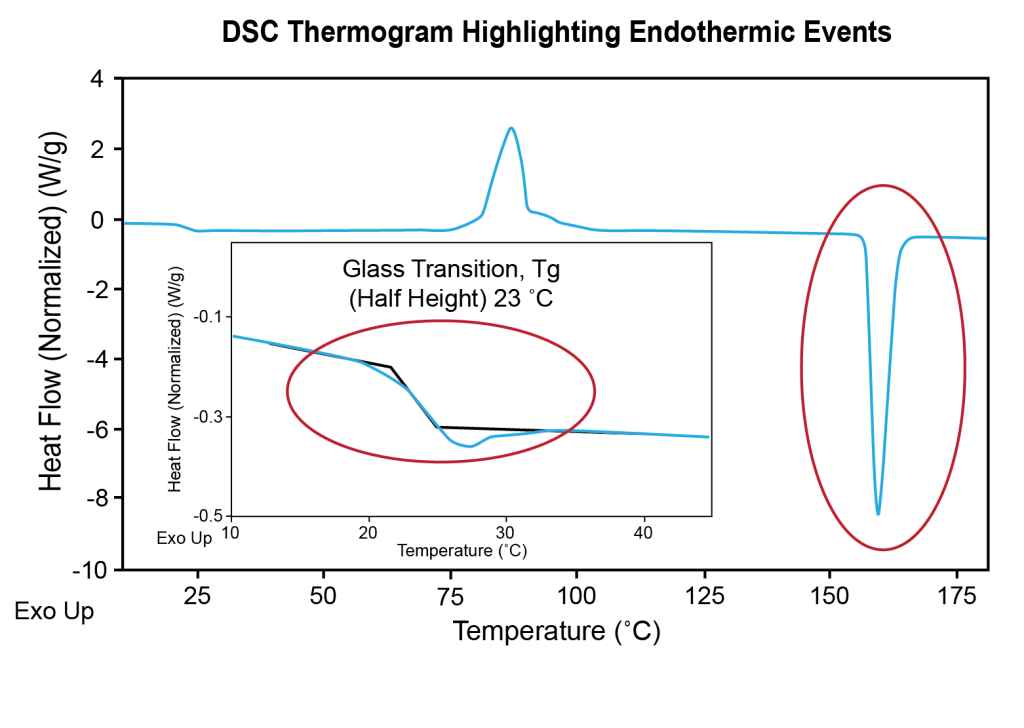
Responda estas preguntas con los resultados de la DSC:
- Evaluación de la materia prima: ¿Es un polímero neto o una mezcla? ¿La resina A del proveedor puede reemplazarse con otra resina de menor costo del proveedor B?
- Procesamiento: ¿Cuánta energía térmica se necesita para fundir por completo los pellets de resina?
- Después de procesar: ¿Hay una historia térmica después de procesar en contraposición al tal cual se recibe? (1º versus 2º calor)
- Reciclado de final de la vida útil: ¿Este lote de PCR (resina postconsumidor) tiene una contaminación significativa de otros polímeros?
¿Qué estabilidad tiene la resina durante el procesamiento y utilización final?
Suelen añadirse estabilizadores y otros aditivos a las resinas para evitar la degradación de los efectos ambientales que se encuentran durante las condiciones de procesamiento y uso final. Entre estos aditivos se incluyen los antioxidantes, eliminadores de oxígeno, estabilizantes de calor y luz UV o productos ignífugos para garantizar que se mantengan las propiedades esperadas del polímero durante el procesamiento y la vida útil del producto. Los estabilizadores son inherentemente de sacrificio y se consumen en forma gradual cuando se exponen a altas temperaturas o a la luz UV; cuando el estabilizador se consume por completo, las propiedades del polímero comienzan a degradarse rápidamente.
El desempeño de los estabilizadores puede evaluarse mediante el análisis de tiempo de inducción de oxidación (OIT) en el DSC. En esta prueba isotérmica, el gas de purga del DSC cambia de nitrógeno a oxígeno, lo que brinda un entorno en el que se consume el estabilizador. Al comienzo de la degradación del polímero, la señal de flujo de calor comienza a aumentar y el tiempo se señala como OIT.
Los aumentos de temperatura en el DSC también pueden usarse para medir el tiempo de inicio de oxidación (OOT), una medida relacionada de la estabilidad del polímero. Pueden realizarse los análisis de OIT y OOT mediante DSC a alta presión, lo que reduce el tiempo al acelerar el consumo de estabilizador.
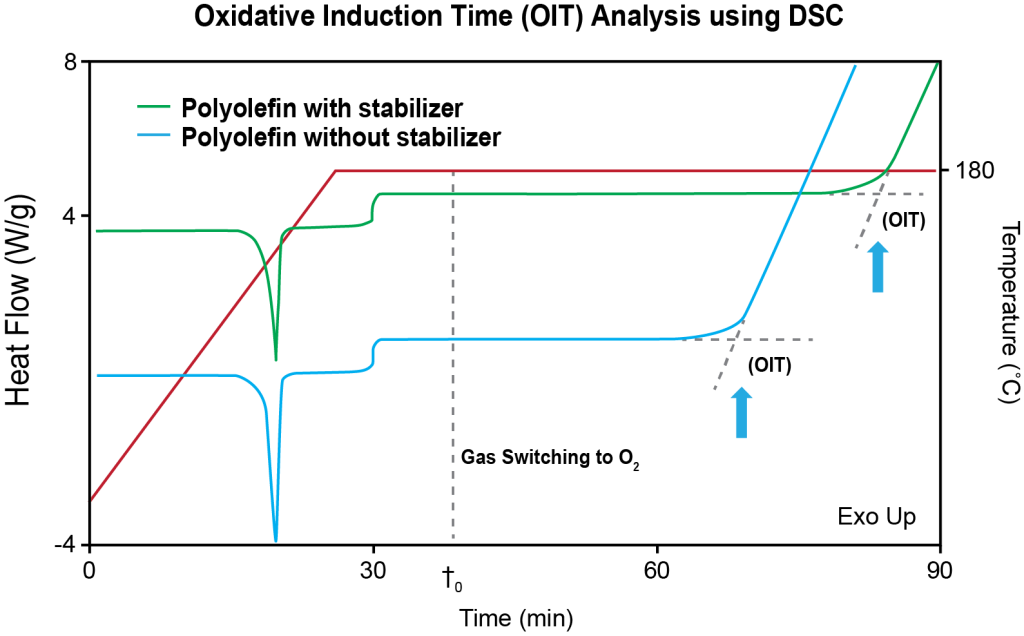
Responda estas preguntas con los resultados de OIT y OOT de la DSC:
- Evaluación de la materia prima: ¿Es posible procesar estas resinas tal como se encuentran? ¿Se necesitan antioxidantes para lograr más estabilidad?
- Análisis de fallas: ¿Dividió el antioxidante a niveles suficientes para las condiciones de uso final?
- Reciclado de final de la vida útil: ¿Cuánto antioxidante se necesita para estabilizar y procesar este lote de PCR?
Notas de aplicación relacionadas:
¿Cómo fluye esta resina?
La viscosidad y la conducta viscoelástica de las fusiones del polímero desempeñan un papel importante para procesar polímeros con técnicas de moldeo por inyección y extrusión. En un nivel básico, la viscosidad representa la resistencia interna del material a la circulación: las resinas de mayor viscosidad circulan a menor velocidad y lleva más tiempo llenar el molde, lo que incrementa la duración del ciclo y da lugar a la posibilidad de fallas como disparos cortos. Como consecuencia, es fundamental medir y controlar de cerca la viscosidad de la resina, para garantizar la estabilidad del proceso y eliminar las variaciones entre lotes.
En el caso de las fusiones del polímero, el perfil de viscosidad depende de la velocidad de deformación, también conocida como velocidad de corte. A las altas velocidades de corte presentes en los procesos de extrusión y moldeo por inyección, la curva de viscosidad presenta un comportamiento pseudoplástico en la región de baja potencia. Cuando aumenta la velocidad de corte, se reduce la viscosidad. Esta dependencia de la velocidad de corte obedece a la distribución del peso molecular del polímero y el grado de ramificación.
Mientras que las altas velocidades de corte son pertinentes para las condiciones de procesamiento, las mediciones de viscosidad a bajas velocidades de corte son esenciales para revelar la estructura molecular de la resina. La viscosidad de corte cero en la primera meseta newtoniana se correlaciona directamente con el peso molecular de la resina y puede medirse con reómetros rotativos.
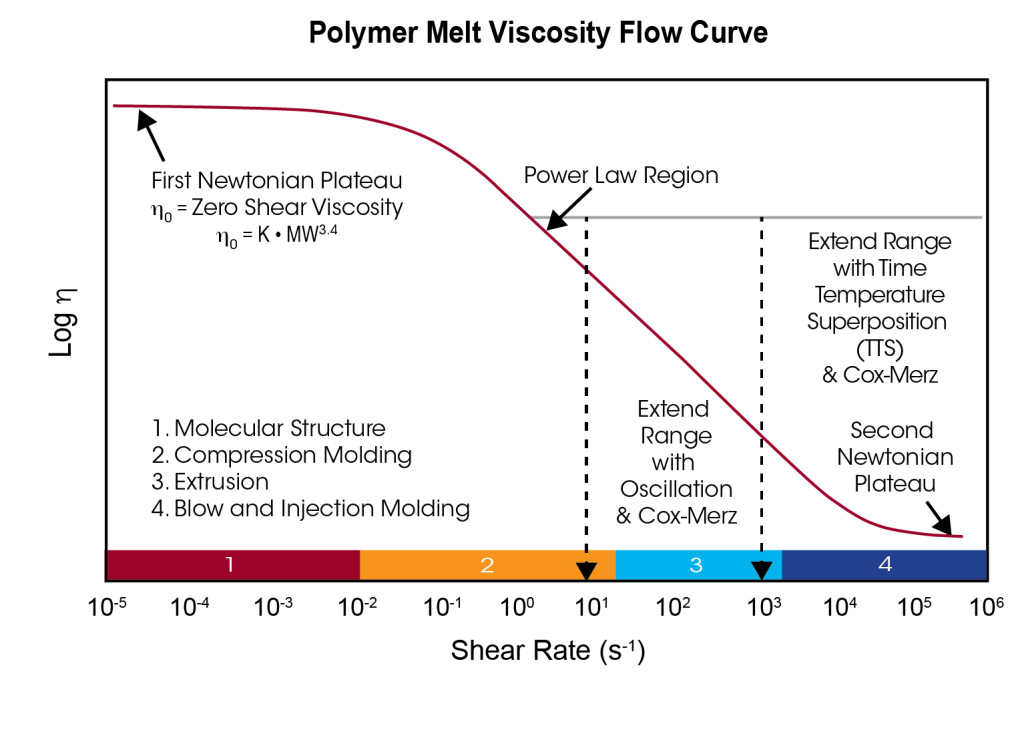
¿De qué manera se relaciona la viscoelasticidad con la distribución de peso molecular / peso molecular?
Los ensayos oscilatorios en reómetros rotativos brindan datos valiosos acerca de las propiedades viscoelásticas del polímero, sondeando la estructura del polímero mediante pequeñas deformaciones en toda una gama de escalas temporales. Los resultados arrojan el módulo de almacenamiento (G’), el módulo de pérdida (G”) y la viscosidad compleja (η*) del polímero como función de la frecuencia oscilatoria. Se los puede utilizar para entender mejor la dinámica de la relajación del polímero. Estos parámetros reciben una gran influencia del peso molecular, la distribución del peso molecular y la estructura de ramificación de cadena larga de la resina. En comparación con los indizadores del flujo de fusión o la reología capilar, el perfil viscoelástico de los ensayos de reología rotativa es especialmente sensible a la presencia de contaminación de alto peso molecular que puede ocasionar problemas de procesamiento.
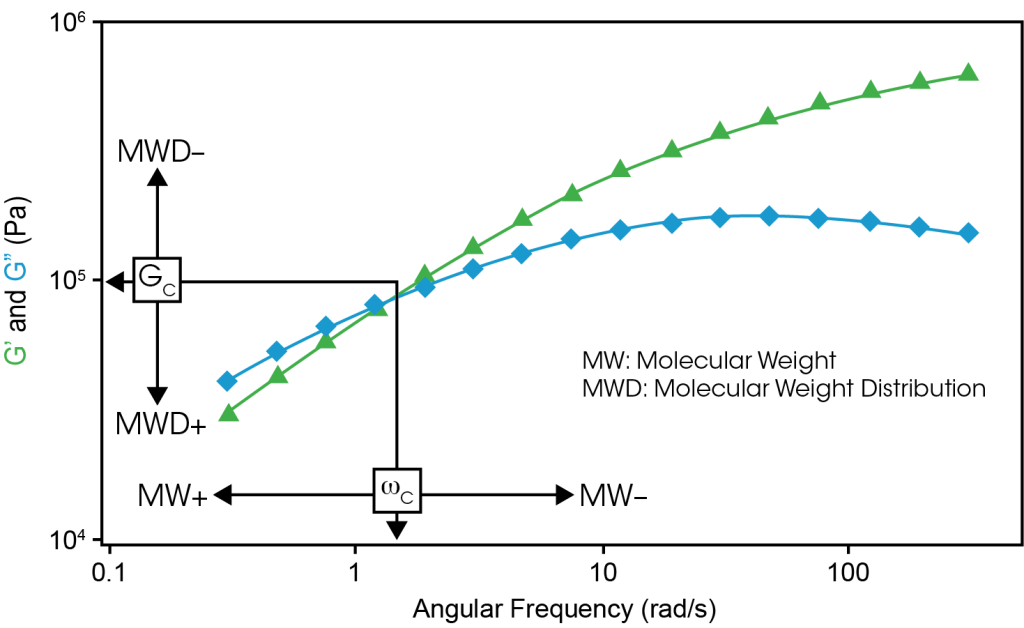
Responda las siguientes preguntas con las mediciones de viscosidad y viscoelásticas de su reómetro rotativo
- Evaluación de la materia prima: ¿Cómo se ve afectado el perfil viscoelástico por los cambios entre lotes en la distribución peso molecular / peso molecular de la resina?
- Procesabilidad: ¿La resina posee la viscosidad correcta a todas las velocidades de corte pertinentes para el proceso de fabricación?
- Final de la vida útil: Reciclado de final de la vida útil: ¿De qué manera la contaminación y la variación MW de la resina reciclada afectan el procesamiento?


