Rheological and Thermogravimetric Characterization on Battery Electrode Slurry to Optimize Manufacturing Process

Keywords: Battery, Electrode, Thermal analysis, TGA, Rheology, Slurry, Manufacturing, Quality Control

TA458

Abstract

Manufacturing electrodes for lithium-ion batteries is a complex, multistep process that can be optimized through the utilization of slurry analysis and characterization. Process optimization requires a thorough understanding of the mixing, coating, and drying conditions of the slurry. In this application note, a TA Discovery HR rotational rheometer facilitates coating optimization by measuring slurry viscosity over different shear rates that relate to coating speed. Drying kinetics are investigated with a Discovery TGA to yield the most cost-efficient condition. TGA is also employed to determine binder and additive contents for dry electrode quality control.

Introduction

Electrode quality directly contributes to the energy density and electrochemical performance in lithium-ion batteries (LIB). Electrode manufacturing is highly complex, involving mixing the cathode or anode active materials, binder/additive and solvent into a slurry coating on the metal collector, and then drying to remove solvent and calendaring (compacting) the electrode (1). It is essential to optimize electrode processing to obtain high quality electrodes and reduce cost of production (2) (3).

The coating and drying process significantly impacts the quality of the electrode, and thus the performance of the battery. The variable properties of the slurry material, such as aggregate size, shape of the particles, and age dependence, influence the slurry viscosity and coating behavior. If the viscosity of the slurry is too high, it can be difficult to pump and apply homogeneously. Lower viscosity is desirable for increasing coating speed but if viscosity is too low, it may cause dripping issues and result in variation in the coating thickness (2). Analyzing the flow behavior of slurry viscosity under different shear conditions can help optimize the performance of the coating process and is important to study the stability and processability of the electrode slurry.

Once the slurry has been coated on the collector, the solvent must be evaporated from the film. Electrode drying is a complicated process, with three competing physical processes: evaporation of the solvent, diffusion of the binder, and sedimentation of the particles (2). Varing the drying temperature or drying time will result in differences in electrode architecture and electrochemical performance. Drying in different temperatures and measuring the drying kinetics of the slurry material can determine the most efficient drying condition. Once the coating has dried, it is important to check the quality of the product through efficiently evaluating binder and additive contents.

This application note demonstrates a workflow process to optimize electrode coating by determining the ideal viscosity of the slurry coating and the best parameters for drying the electrode. Finally, quality of the resulting dry electrode is assessed through evaluation of the binder and additive contents. The sample used is an anode electrode, with active materials graphite, carbon black, Carboxymethyl Cellulose (CMC) and Styrene-Butadiene Rubber (SBR).

Application Benefits

  • Electrode slurry formulation, coating, and drying processes significantly impact quality in electrode manufacturing.
  • TA Instruments Discovery HR-30 rheometer can deliver a sensitive evaluation of slurry viscosity to guide selection of slurry processing conditions during battery electrode manufacturing.
  • The HR-30 rheometer measures the shear rate dependent slurry viscosity to optimize the coating process.
  • The Discovery TGA 5500 with sealed pan punch accurately and reliably measures the drying times of the slurry materials at different temperatures to optimize the drying process.
  • TGA measures the binder and additive contents to ensure uniform composition and provide quality control of electrode with Pass/Fail feature.

Experimental

The anode slurry and dry electrode were kindly provided by NEI Corporation. The slurry viscosity was measured using a TA Instruments Discovery HR-30 rheometer with the advanced Peltier temperature control system. A 40mm hard anodized aluminum parallel plate geometry was used with a testing gap set at 500 µm. Slurry viscosity was measured from shear rate range of 0.01 1/s to 1000 1/s.

Slurry drying kinetics and quality control of the dry electrode was performed on a TA Instruments Discovery 5500 under inert nitrogen purge gas. Drying is a kinetic process which is directly related to sample thickness and surface area, so it is critical to maintain the same sample volume and size for all the tests. A micropipette was used to enable precise loading of 20 µl of slurry sample loaded on TGA aluminum sealed pan for the drying studies. The sealed pan was used to prevent solvent evaporation. The sealed pan pouched open right before loading for TGA testing. The sample was heated to drying temperature and isothermal for 15 min. To determine the binder and additive content on dry electrode, the electrode sample was ramped 10 °C/min from room temperature to 1000 °C on a platinum pan.

Results and Discussion

Slurry Viscosity

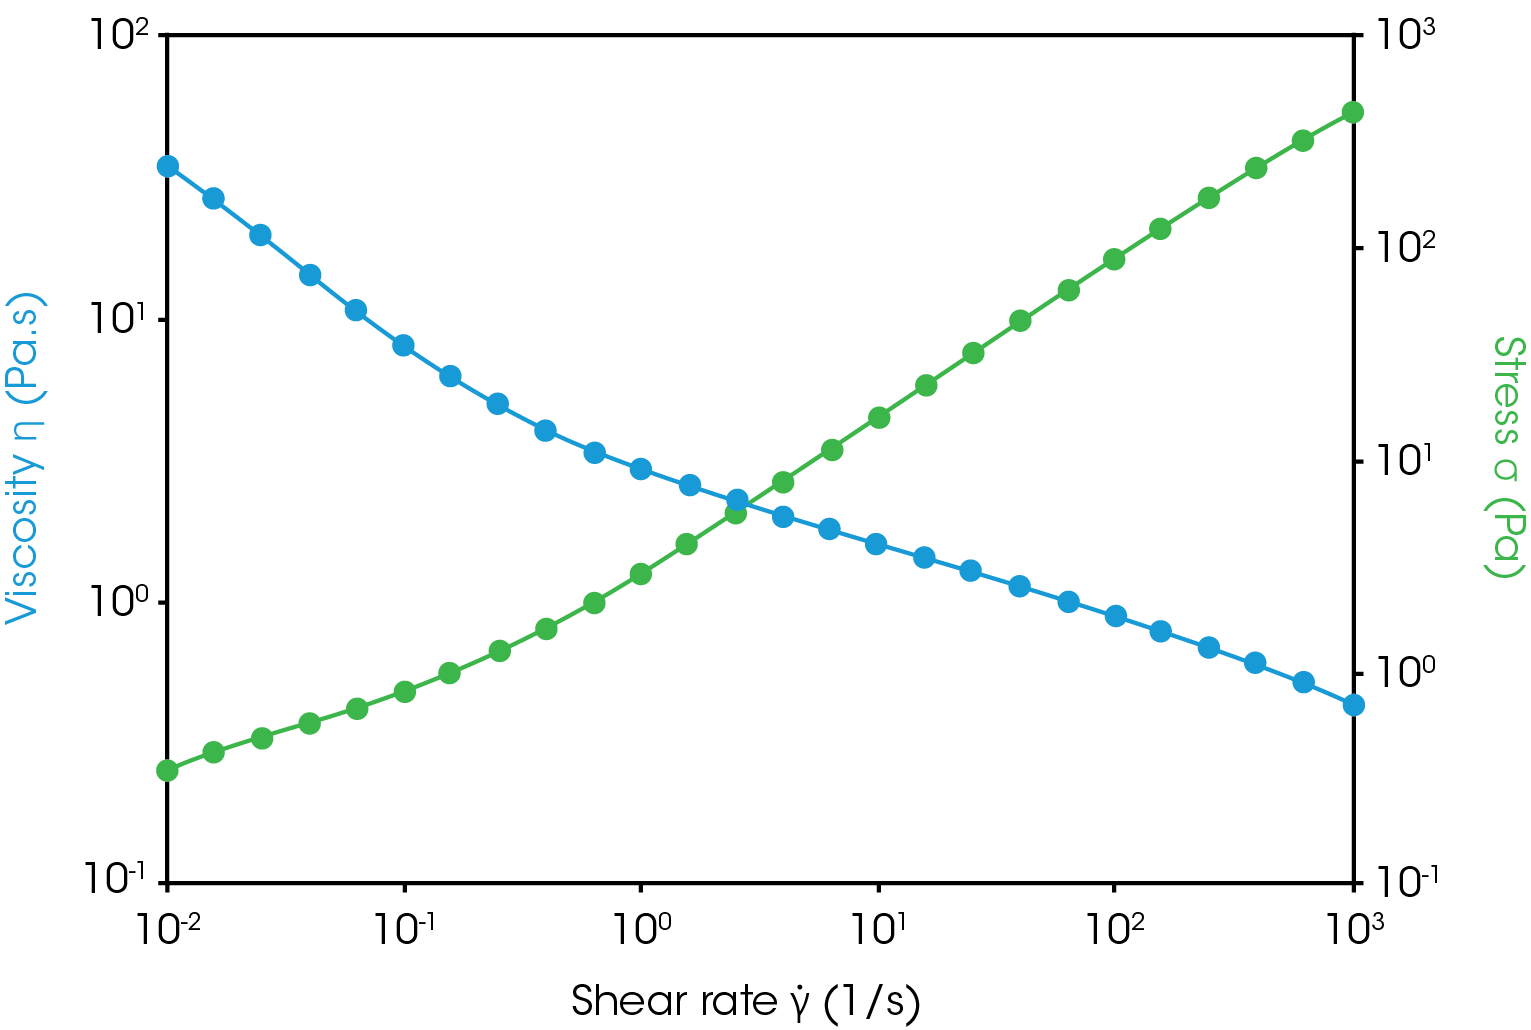
Understanding the formulation stability and flow behavior of the battery slurry is critically important for electrode manufacturing. Some manufacturers choose to use a low-end viscometer with single point analysis, which is not sufficient becasue it cannot fully reflect the flow property of the slurry. Two formulations may have the same viscosity at a single point shear rate, but they can have significant differences in their stability and coating performance. Slurries are shear thinning, its viscosity decreases with increasing shear rates. Figure 1 shows the rheological viscosity testing results of a battery anode slurry over a wide range of shear from 10-2 to 103 1/s, representative of the die slot coating process used in electrode manufacturing. The testing results indicate that this slurry exhibits shear thinning behavior. Table 1 shows the summary slurry viscosity over the shear rates, which provides important guidance to slurry formulation and the coating processing conditions. A good formulation should have a lower high-shear rate viscosity, which ensures an easy and homogeneous coating on the collector; while remaining a higher low-shear rate viscosity to ensure slurry stability (2).

Due to the correlation between shear rate and coating speed (2), these viscosity measurements can be used to guide slurry coating applications. Additionally, viscoelasticity and thixotropy can also measured by HR rheometer (4) to provide useful insights in electrode slurry structure and stability during the coating to further enhance the electrode quality (5). Further details of the viscoelasticity and thixotropy are discussed in the TA Application Note RH119.

Table 1. Summary of slurry viscosity at different shear rates

Shear Rate (1/s) Viscosity (Pa.s)
0.01 34.9
0.1 8.1
1 2.9
10 1.6
100 0.9
1000 0.4
Figure 1. The viscosity of anode slurry over a wide range of shear rate

Drying Time

Electrode formulation, coating thickness, drying temperature, and drying rate determine the electrode’s drying kinetics. Drying kinetics influence electrode microstructure and should be an important consideration when optimizing the drying process in electrode manufacturing (6). TGA provides a quick test to evaluate the time of the drying process and drying kinetics; the data provide information on drying temperatures and drying times that can guide toward the most cost-efficient drying process.

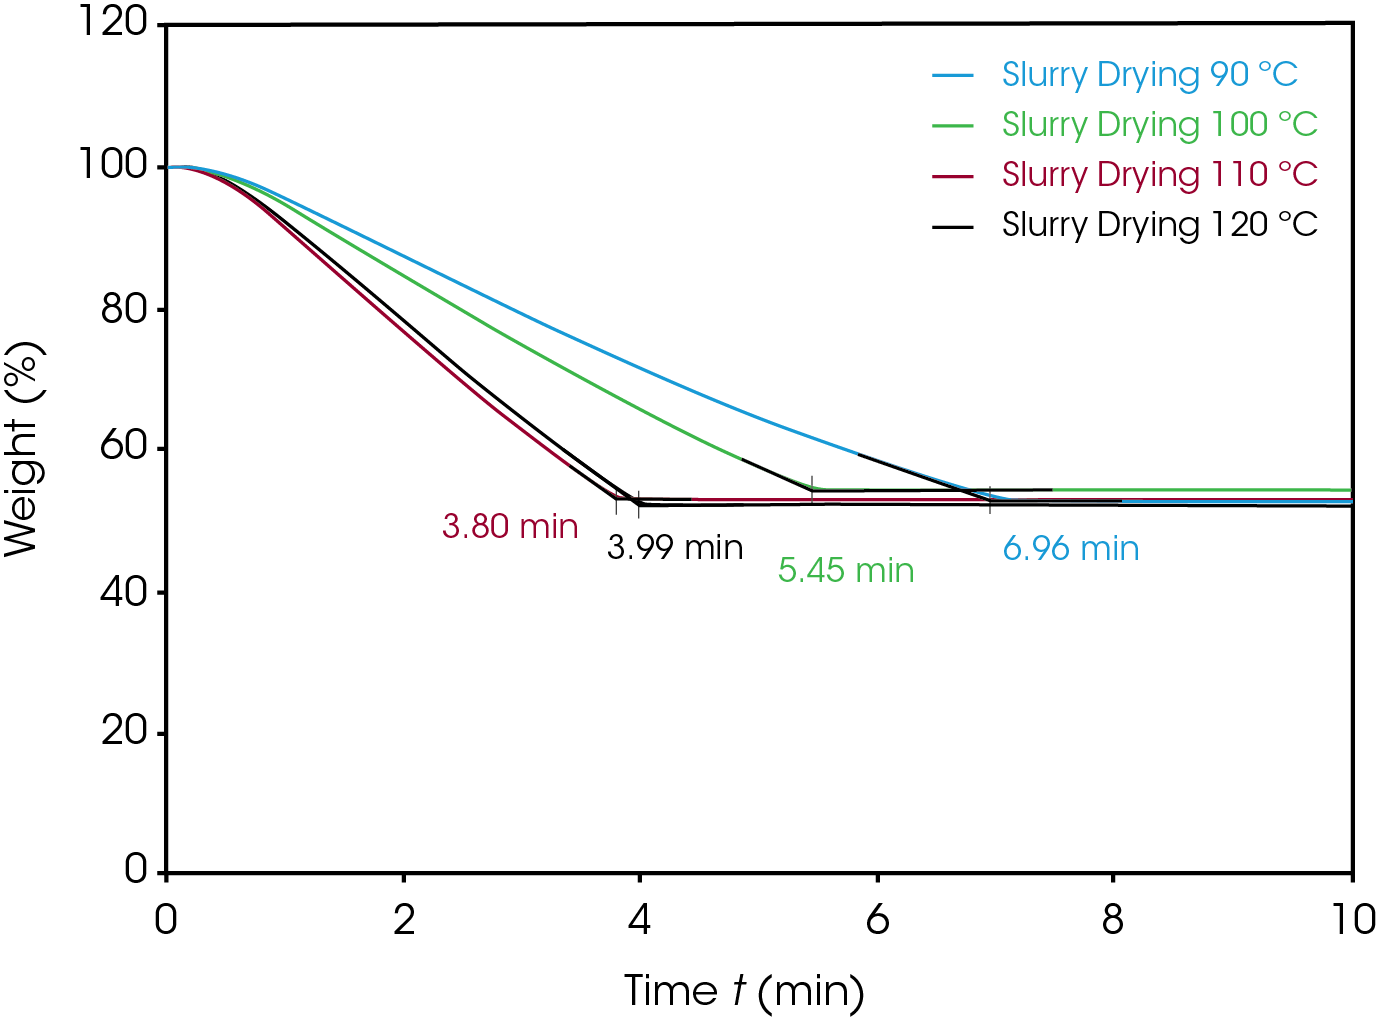
Figure 2 shows the drying time required for the slurry at different temperatures. Drying kinetics can also be determined from the data (7). Table 1 summarizes the minimum required drying time at different drying temperatures. The results show that the drying time can be reduced from 6.96 min at 90 °C to 3.80 min at a higher temperature of 120 °C.

Table 2. Minimum drying time at different drying temperature

Drying Temperature (°C) Drying Time (min)
90 6.96
100 5.45
110 3.99
120 3.80
Figure 2. Drying time of the electrode slurry

Binder and Additive Contents

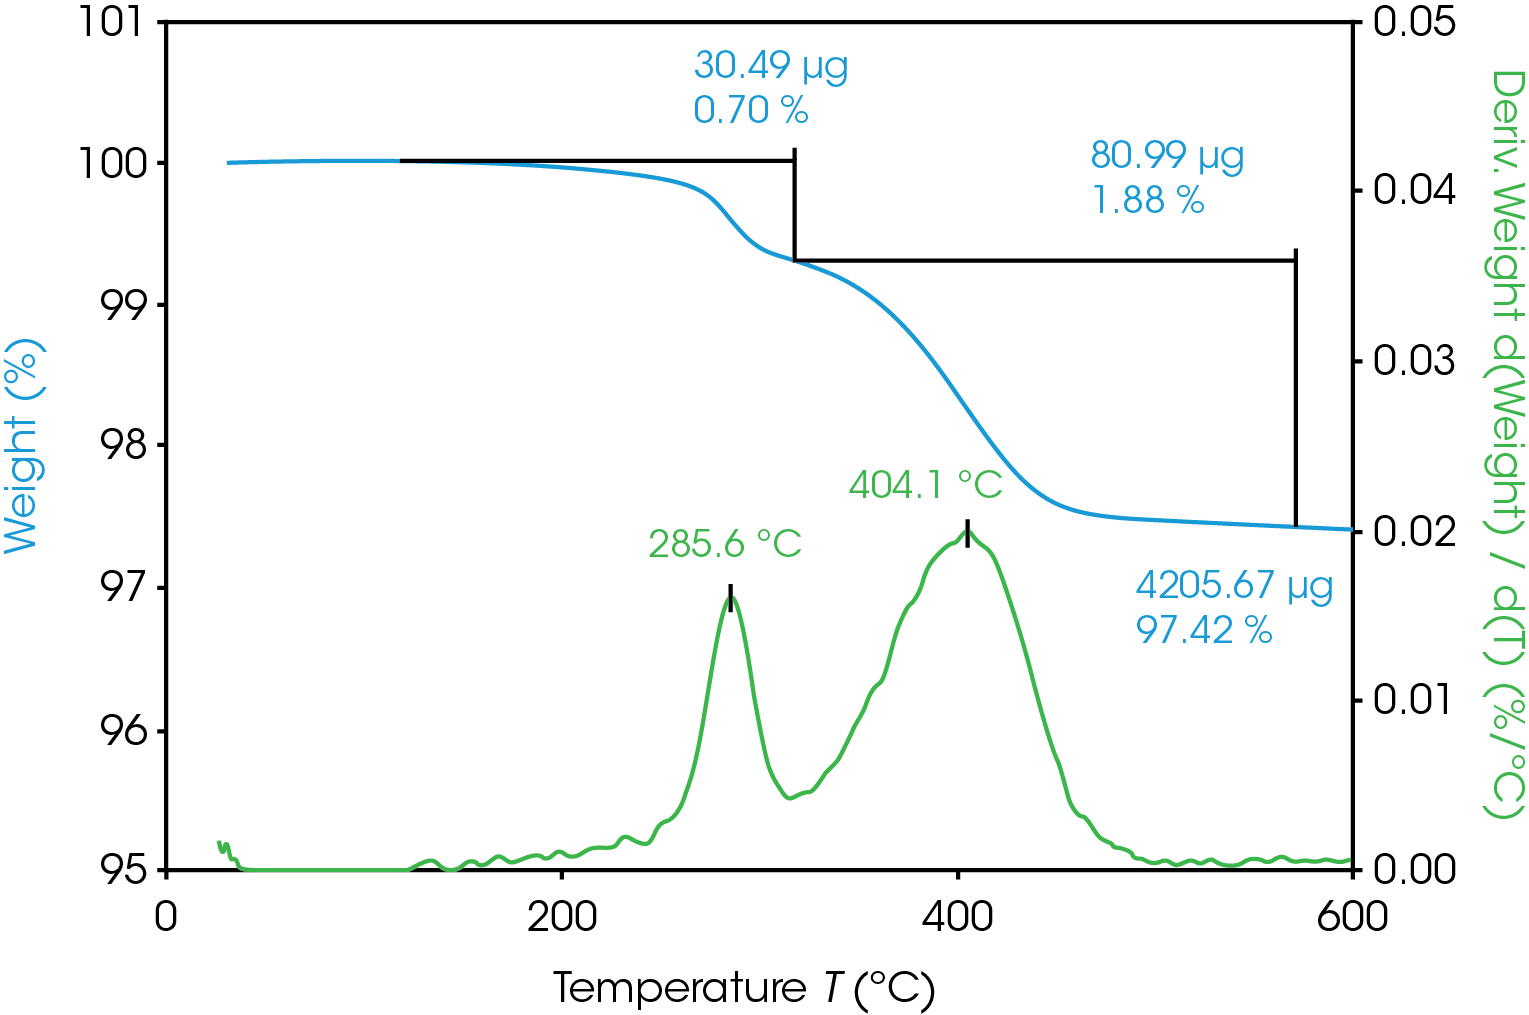
After the electrode is dried and calendared, it is important to confirm the electrode is uniform with even distribution of binder and additive to ensure good adhesion, maintain flexibility, and prevent chipping of the electrode. TGA measures CMC and SBR content, with the highly sensitive Discovery TGA 5500 able to measure µg level weight loss from the dry electrode (Figure 3). The first weight loss peak at 285 °C indicated the CMC 0.70% weight content. The second weight loss peak at 404 °C indicated the SBR 1.88% weight content. The residue at 600 °C indicated 97.42% of the inorganic content. These results can be utilized in quality control to determine if the electrode passes or fails quality measures.

Figure 3. TGA weight loss data of dry electrode

Pass/Fail Feature for Quality Control

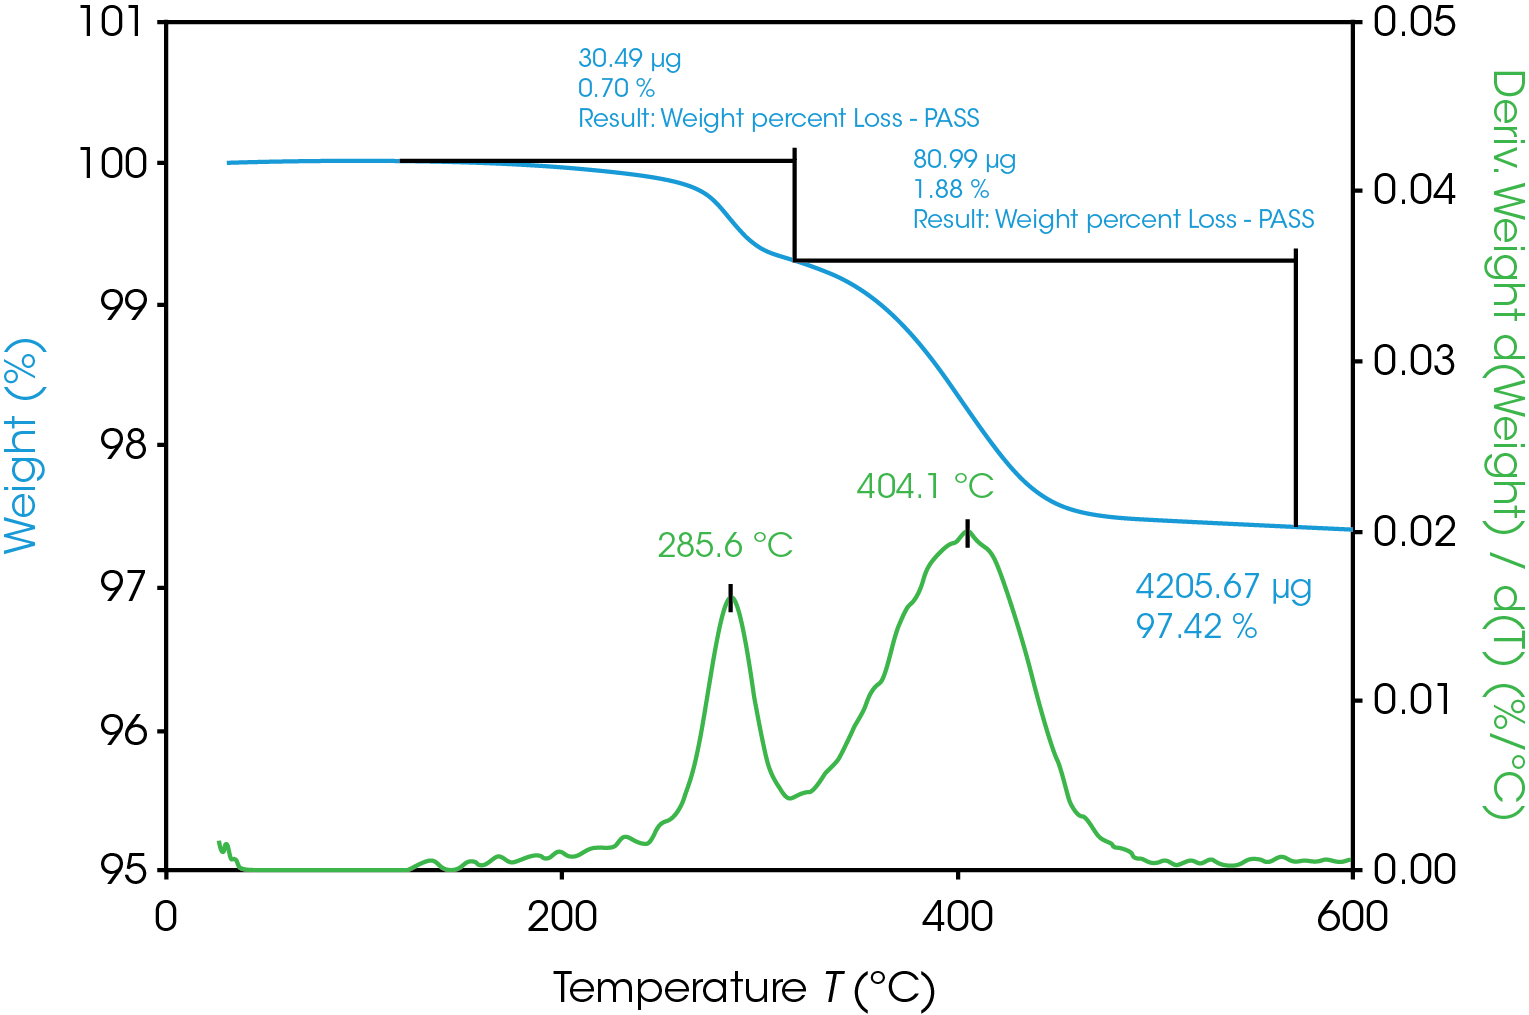
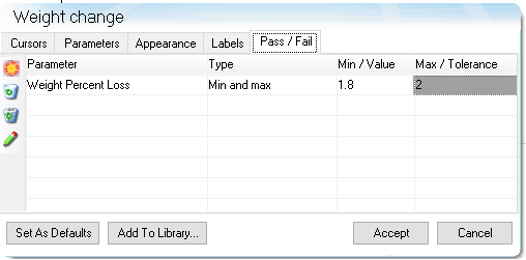
In electrode manufacturing quality control, the pass or fail decision must be made immediately to ensure the electrode quality and meet production needs. TRIOS software Pass / Fail feature helps operators to interpret the data and make a faster Pass or Fail decision. The Pass / Fail option determines if the results of the analysis passed or failed the user-defined parameter values. The parameter can be defined as Minimum/Maximum, Value ± % tolerance, or Value ± tolerance. Figure 4 provides an example of the Pass / Fail setting on weight percent loss where the value within Min and Max value of 1.8 and 2.0. When the result is within the min and max value, the analysis will stamp the graph with “PASS” or stamp “FAIL” when the value is outside of the range. The pass/fail feature in TRIOS allows fast Pass/Fail determination for quality control.

Figure 4. TRIOS Pass/Fail feature for quality control

Conclusion

Electrode manufacturing needs to increase production and reduce cost to meet the high LIB demand. TA Instruments rotational rheometer and TGA provide the essential characterization workflow to optimize cost-efficient electrode manufacturing. The business benefits of the Discovery HR-30 rheometer and the Discovery 5500 TGA include:

  • The Discovery RH-30 rheometer measures the flow viscosity of electrode slurry over a wide range of shear rates. This technique is critically important to guide the coating process.
  • The Discovery TGA studies the drying kinetics in various drying temperatures that can guide and optimize the most cost-efficient drying condition.
  • The sealed pan punch system on TGA prevents solvent evaporation, enabling accurate and reliable measurement of slurry drying.
  • The highly sensitive microbalance on the Discovery TGA measures the binder and additive contents on the single layer electrode to ensure uniform composition for quality control.
  • The Pass/Fail feature in TRIOS software provides fast pass/fail decision for manufacturing quality control.

References

1. Reynolds, Carl D., et al. A review of metrology in lithium-ion electrode coating processes. 2021, Materials & Design, p. 109971.
2. Hawley, Blake W. and Li, Jianlin. Electrode manufacturing for lithium-ion batteries—Analysis of current and next generation processing. 2019, Journal of Energy Storage, p. 100862.
3. Hawley, Blake W. and Li, Jianlin. Beneficial rheological properties of lithium-ion battery cathode slurries from elevated mixing and coating temperatures. 2019, Journal of Energy Storage, p. 100994.
4. Chen, Terri and Lau, Hang Kuen. Rheological Evaluation of Battery Slurries with Different Graphite Particle Size and Shape. TA Applications Note, 2022. RH119.
5. Ouyang, Lixia, et al. The effect of solid content on the rheological properties and microstructures of a Li-ion battery cathode slurry. 2020, RCS Advances, pp. 19360-19370.
6. Bryntesen, Silje Nornes, et al. Opportunities for the State-of-the-Art Production of LIB Electrodes – A Review. Energies, 2021, Vol. 14. 1406.
7. Kinetics of Drying by Thermogravimetric Analysis. Vol. Thermal Analysis Application Brief. TA 134.

Acknowledgement

This note was written by Hang Kuen Lau and Terri Chen and edited by Nikki Szymurski and Jennifer Vail of TA Instruments

Click here to download the printable version of this application note.

Contact us to learn more about our instrumentation and how it can benefit your research.

[ult_buttons btn_title=”Contact Us” btn_link=”url:https%3A%2F%2Fwww.tainstruments.com%2Fsales-contact%2F” btn_align=”ubtn-center” btn_size=”ubtn-small” btn_title_color=”#ffffff” btn_bg_color=”#0092dd” btn_bg_color_hover=”#0092dd” btn_title_color_hover=”#ffffff” icon_size=”32″ btn_icon_pos=”ubtn-sep-icon-at-left” btn_border_style=”solid” btn_color_border=”#0092dd” btn_color_border_hover=”#0092dd” btn_border_size=”1″ btn_radius=”3″ btn_font_style=”font-weight:bold;” btn_font_size=”desktop:16px;”]