Keywords: ITC, affinity, enthalpy, binding, biomolecules, pharmaceuticals, high throughput screening, screening, HTS
MC153
Introduction
Isothermal titration calorimetry (ITC) is the best technique to obtain a complete understanding of the driving forces leading to a binding interaction. There have been significant advances to the technology and method development leading to a workflow solution for every lab. There are three main methods to utilize when studying the binding interaction between two molecules: enthalpy screen, incremental titration, and continuous titration. The primary purpose of enthalpy screening is to narrow down the selection of ligands based solely on enthalpy, as compounds with a more favorable enthalpy typically translates to a binding event that is more specific.1-3 After a handful of candidates are selected, a full thermodynamic characterization using either the incremental titration or continuous titration can be implemented. Utilizing this approach one can significantly cut down on time and material in the process of selecting the final candidate, as only those with a favorable enthalpy would proceed to a full characterization.
Materials and Methods
Three methods were utilized on the Affinity ITC (TA|Waters): enthalpy screening, continuous titration, and incremental titration to characterize the binding of Furosemide (supplied by Creoptix) and Carbonic Anhydrase II (Sigma-Aldrich). Experiments were ran in duplicate at 25 °C in 1x PBS, 3% DMSO stirring at a rate of 125 RPM. Analysis was performed and visualized using NanoAnalyze (TA|Waters). Full method details will be discussed in the respective results section.
Results
Enthalpy Screen: High-throughput screening
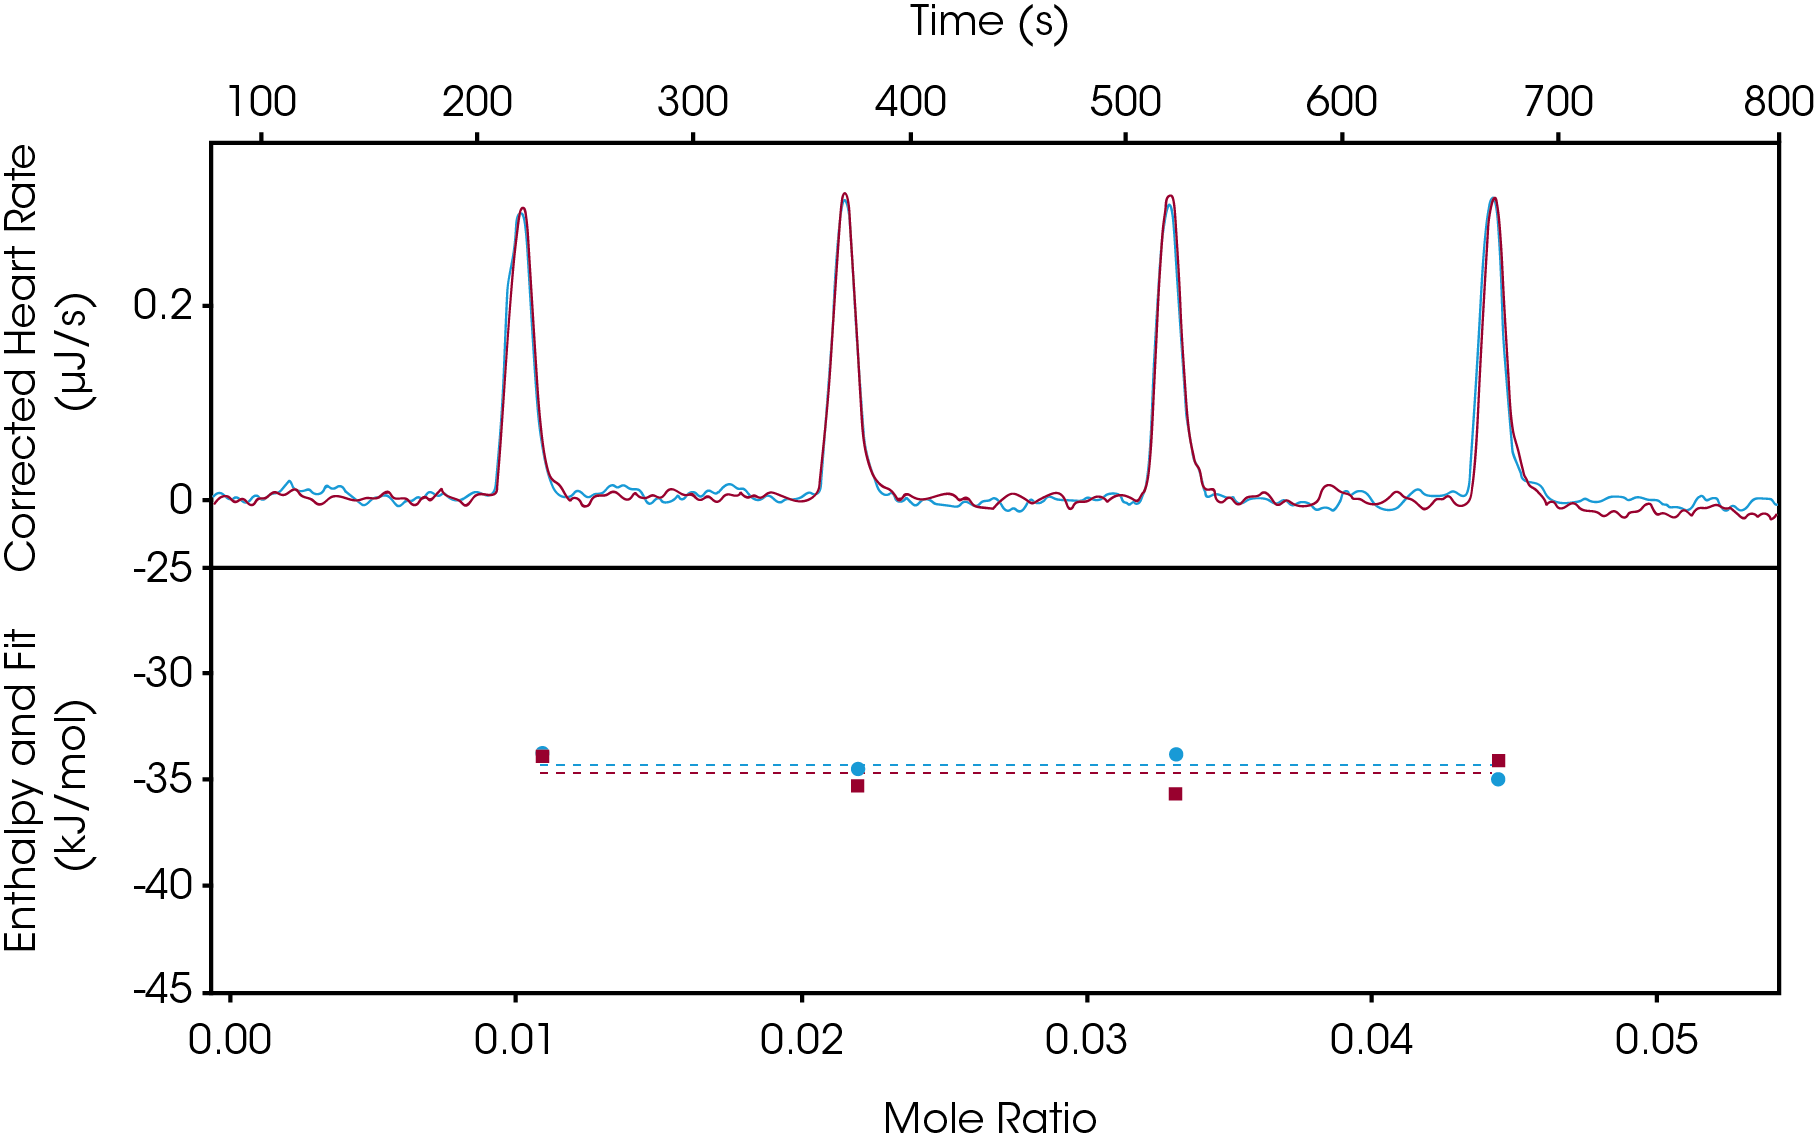
Enthalpy screening is becoming more popular as this method significantly cuts down on material consumption and time. How this method is typically carried out is the target would be in the syringe (titrant) and the ligand in the cell (titrand), as this would allow for the fastest experimental run time and throughput. Non-saturating conditions are recommended where most of the titrant will bind to the titrand, ensuring an accurate enthalpy value is determined. With these conditions, an enthalpy screen only takes 3-4 injections of the target, so with one syringe fill (250 μL) up to 31 screenings can take place. For each screening, the cell would be cleaned, and a new ligand loaded. Experimental run time on average is between 10-15 minutes. When equipped with an autosampler 96 experiments can be ran in a single day. The enthalpy screening method can also be utilized if the KD is already known by another method, and only the enthalpy is of interest, or if the KD is outside of the range of the instrument, one can still obtain the binding enthalpy. In Figure 1, an enthalpy screen of Furosemide binding to Carbonic Anhydrase II was studied. In this example, 50 μM Carbonic Anhydrase II was injected into 50 μM Furosemide. In less than 15 minutes an enthalpy of -34.53 kJ/mol was determined. This experiment was carried out in duplicate and utilizing the overlay graph feature in the NanoAnalyze software, we observe excellent reproducibility.

Incremental Titration: Traditional Binding Method
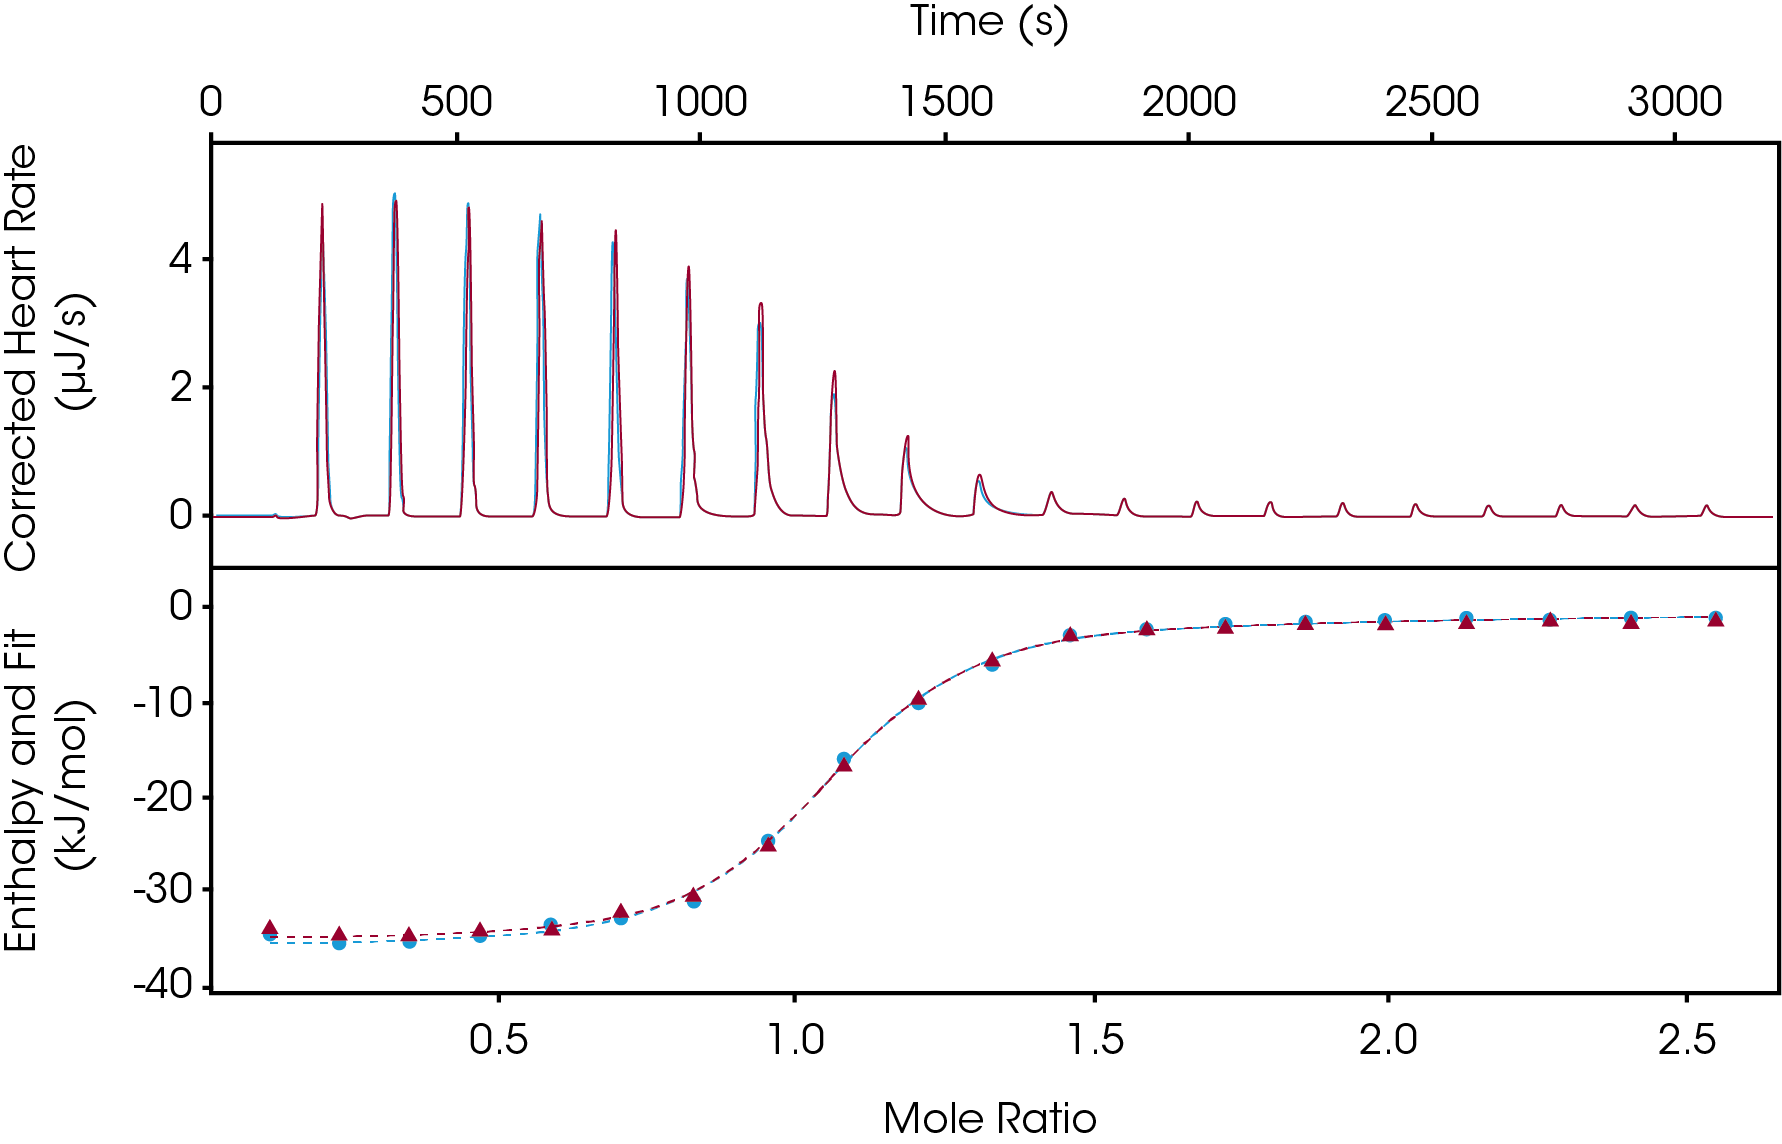
The incremental titration is the most accepted ITC experiment as this has been the standard for many years. The incremental titration can be used when a full thermodynamic binding profile is necessary. In the workflow process, this experimental setup would come after narrowing down the pool of drug candidates from the enthalpy screen. In one experiment the following is determined: ΔH, KD, n, ΔG, TΔS. ITC is the only technique to directly obtain all these parameters in a single experiment. This method on average takes between 45 and 60 minutes. How this method is typically set up is the ligand would be in the syringe (titrant) and the target would be in the cell (titrand). Traditional experiments include 20, 2 μL injections with a spacing between 150-300 seconds depending on the samples tested. For an incremental titration, it is important to have the signal return to baseline prior to the next injection. In Figure 2, an incremental titration of Furosemide binding to Carbonic Anhydrase II was studied. In this example, 1 mM Furosemide was injected into 100 μM Carbonic Anhydrase II. In less than an hour a full thermodynamic binding profile was determined (ΔH = -34.87 kJ/mol, KD= 1.3 μM, n = 1). This experiment was carried out in duplicate and utilizing the overlay graph feature in the NanoAnalyze software we observe great reproducibility.

Continuous Titration: Cut the Experimental Run Time in Half
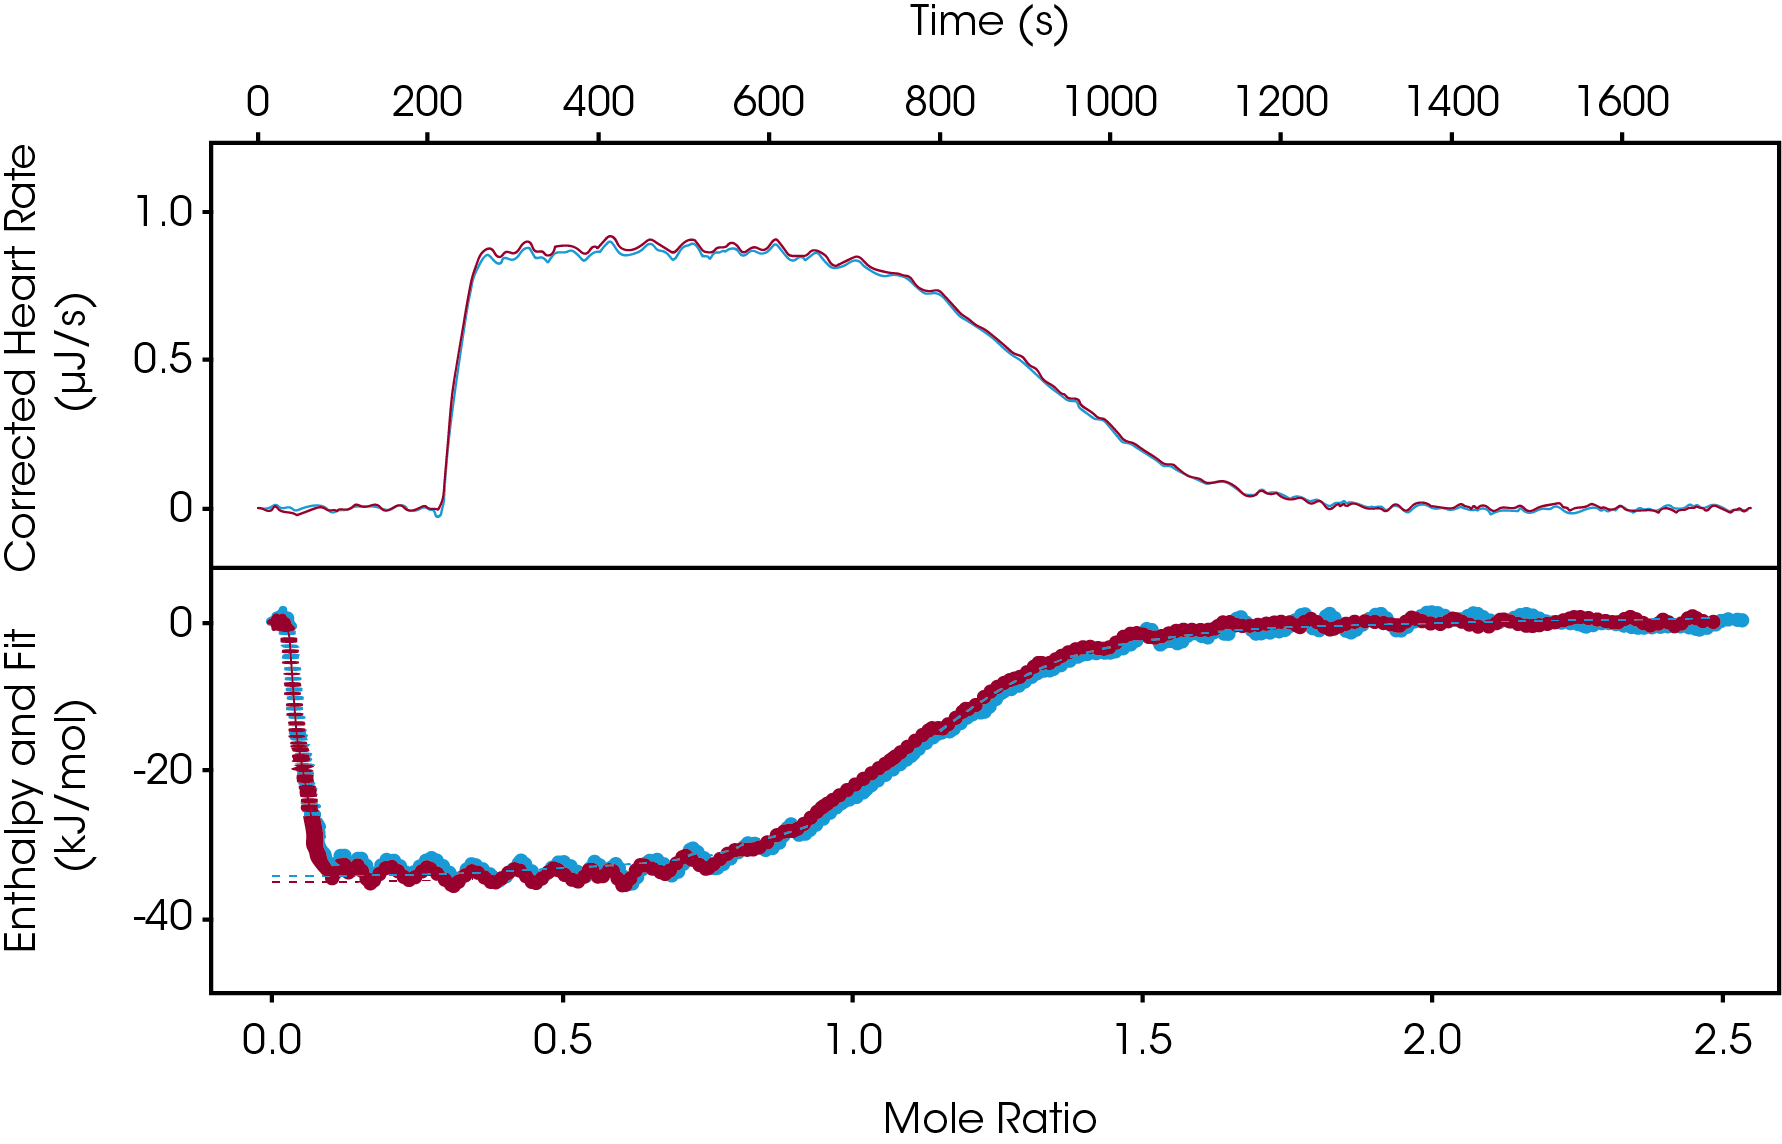
The continuous titration has been gaining interest over the last few years, as this experimental setup can significantly decrease the run time essentially cutting it in half. Similar concentrations would be used as the incremental titration setup, but here all titrant is injected slowly at a controlled rate. On average experimental runtime is 20-30 minutes. In Figure 3, 1 mM Furosemide was injected into 100 μM Carbonic Anhydrase II at a rate of 0.0258 μL/s. In less 30 minutes a full thermodynamic binding profile was determined (ΔH = -35.56 kJ/mol, KD= 1.45 μM, n = 1). This experiment was carried out in duplicate and utilizing the overlay graph feature in the NanoAnalyze software we observe great reproducibility.

Conclusions
In this article, we have outlined three methods using ITC. Each is useful in its own way, depending on where this technique may fall in the workflow of understanding the binding interaction between two molecules. The methods can be used in combination with each other or with other techniques to get a clear picture of the driving forces behind a binding interaction. Using Furosemide binding to Carbonic Anhydrase II as an example, all three ITC methods show excellent agreement, Table 1. These results highlight the power of the enthalpy screen and continuous titration, both of which would lead to significantly reduced experimental time.
Table 1. Comparison of ITC Methods
| Method | ΔH (kJ/mol) | KD (µM) | Runtime (mins) |
|---|---|---|---|
| Enthalpy Screen | -34.53 | — | 13 |
| Incremental | -34.87 | 1.30 | 53 |
| Continuous | -35.56 | 1.45 | 28 |
References
1. Ryckmans T, Edwards MP, Horne VA, Correia AM, Owen DR,Thompson LR, Tran I, Tutt MF, Young T “Rapid assessment of a novel series of selective CB(2) agonists using parallel synthesis protocols: A Lipophilic Efficiency (LipE) analysis”. Bioorg. Med. Chem. Lett. (2009) 19 (15): 4406–9.
2. Schön, A. and Freire, E. “Enthalpy Screen of Drug Candidates” Analytical Biochemistry (2016) 513: 1-6
3. Ladbury, J., Klebe, G., and Freire, E. “Adding Calorimetric Data to Decision Making in Lead Discovery: A Hot Tip” Nature Reviews. (2010) 9:23-27
Acknowledgement
This application note was written by Calliste Scholl, Applications Engineer at TA Instruments
Click here to download the printable version of this application note.

