Keywords: TGA, DSC, MDSC, PCMs, beeswax, latent heat, heat capacity, microscope
TA405
Abstract
Phase change materials (PCMs) are materials that store and release latent heat. They have been widely used in thermal energy storage applications for buildings, electronic devices, and batteries. With the increasing demand for energy saving technologies, the global phase change material (PCM) market has grown drastically, which in turn drives the development of new and improved PCMs [1]. Understanding PCMs’ thermal properties and chemical compositions are essential to the development of new applications using PCMs. This work studies a variety of properties of three PCMs using differential scanning calorimetry (DSC), modulated DSC (MDSC®), and thermogravimetric analysis (TGA).
Introduction
The purpose of this study is to characterize three phase change materials (PCMs) – one paraffin wax and two beeswaxes. PCMs are widely used for thermal energy storage and thermal management due to their high latent heat storage ability. PCMs have been very popular for the past three decades due to the increasing needs for energy-saving and environment-friendly technologies. They can store and release the energy through a phase change (e.g., from solid to liquid) and exhibit the advantages of a high energy density during the melting process [1]. PCMs are often used as cooling materials and building materials. The three waxes, among other organic PCMs, have high latent heats which make them great candidates for thermal energy storage systems. Paraffin wax normally consists of a mixture of n-alkanes (CnH2n+2). It shows a solid-solid endothermic transition and a solid-liquid transition (melting) [1]. Beeswax is a natural wax that is primarily composed of alkanes, fatty acids, and long-chain esters [2]. Beeswax is also commonly used in skin care and the cosmetics industry. Investigating the thermal properties of these waxes will provide important information on their material structures, which would be very beneficial for their practical applications. These three waxes were characterized using DSC, MDSC as well as TGA to examine the melting points, latent heats, heat capacities, and thermal stabilities.
DSC measures heat flow into and out of a material as a function of time or temperature. This technique provides quantitative characterization about physical and chemical changes that involve endothermic or exothermic processes or changes in heat capacity. The modulated DSC (MDSC) is a technique that subjects a material to a linear heating method which has a superimposed sinusoidal temperature oscillation (modulation) resulting in an oscillated heating profile [3-4]. It provides the ability to accurately measure heat capacity of materials and that provides the capability of observing physical changes in a material as it undergoes phase transitions as well as volumetric dimensional changes. The microscope captures images and videos during a DSC experiment which provides an opportunity to observe the sample appearance while the sample is being tested.
TGA is a technique that measures the amount and rate of change in the weight of a material as a function of time or temperature. Changes in the mass of a material are due to several events such as vaporization, oxidation, and decomposition. TGA measurements are used primarily to determine the composition of materials and to predict their thermal stability up to elevated temperatures.
MDSC® Theory on Heat Capacity
Heat capacity of a material is defined as the amount of heat required to change its temperature by one degree. Traditional DSC has been used for this measurement for decades, but it requires three experiments under the same experimental conditions [5] and can take hours to finish. Additionally, the accuracy is less than desired.
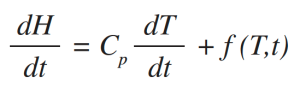
MDSC differs from DSC in that it applies two simultaneous heating rates to the sample [3, 6-10]. The linear heating rate provides the same information (Total heat flow rate) as DSC, while the sinusoidal heating rate is used to determine the fraction of the Total heat flow rate that responds to a changing heating rate. This fraction of the Total heat flow rate is called the Reversing heat flow rate which is caused by heat capacity changes and by most melting. Heat flow rate that does not respond to the changing heating rate is determined by subtracting the Reversing heat flow rate signal from the Total heat flow rate signal. This resulting signal is called Nonreversing heat flow rate, or the kinetic component. More importantly, the MDSC only requires one experiment to obtain heat capacities. The equation which describes the heat flow in DSC and MDSC is shown below [6-10]:
where:
dH/dt = Total heat flow rate.
Cp = Sample heat capacity; this is calculated from the heat flow rate that responds to the modulated heating rate if MDSC is used.
dT/dt = Heating rate; it has both a linear and sinusoidal (modulated) component if MDSC is used.
f(T,t) = Heat flow rate dependent on absolute temperature and time; this is the kinetic component of the Total heat flow rate.
Cp dT/dt = Reversing heat flow rate if MDSC is used.
Because of the ability to separate Total heat flow rate into two components, MDSC® provides unique new insights into heat capacity measurement. The Total heat flow rate signal is calculated from the average value of the measured modulated heat flow rate signal using Fourier Transform on the sine wave. To calculate heat capacity, the equation below is used [6]. The amplitudes of the heat flow and heating rate signals are calculated using Fourier Transform as well.

where:
KCp Rev = Calibration Constant for Reversing Cp = Theoretical Cp /Measured Cp
Therefore, the Cp of sample = KCp Rev × Measured Cp of sample Rev
Experimental
In this work, a DSC 2500 with the Discovery DSC microscope and a TGA 5500 were used. All the tests were carried out in a N2 environment. In MDSC, a Quasi-isothermal method with increasing temperature steps was used to determine heat capacities of the waxes at different temperatures. Below is the method used for this work.
- Data Off
- Equilibrate 10.00 °C
- Modulate Temperature 1.00 °C for 120.0 s
- Isothermal 5.0 min
- Data On
- Isothermal 15.0 min
- Data Off
- Increment 10.00 °C
- Repeat 5 or 6 times
In Quasi-isothermal MDSC, sapphire is used as the standard material. Prior to running samples, sapphire is run under the same conditions that are used for the samples at each desired temperature. The observed heat capacity of sapphire is used to calculate the KCp Rev. Then KCp Rev will be used to correct the observed heat capacity of the samples to determine the heat capacity at each desired temperature of the materials.
To run with the Discovery microscope, a typical method is shown below to capture images and a video along with the DSC thermogram.
- Equilibrate at a starting temperature
- Image On, 30 seconds/img
- Video On
- Ramp at 10 °C/min to a final temperature
Results and Discussion
TGA
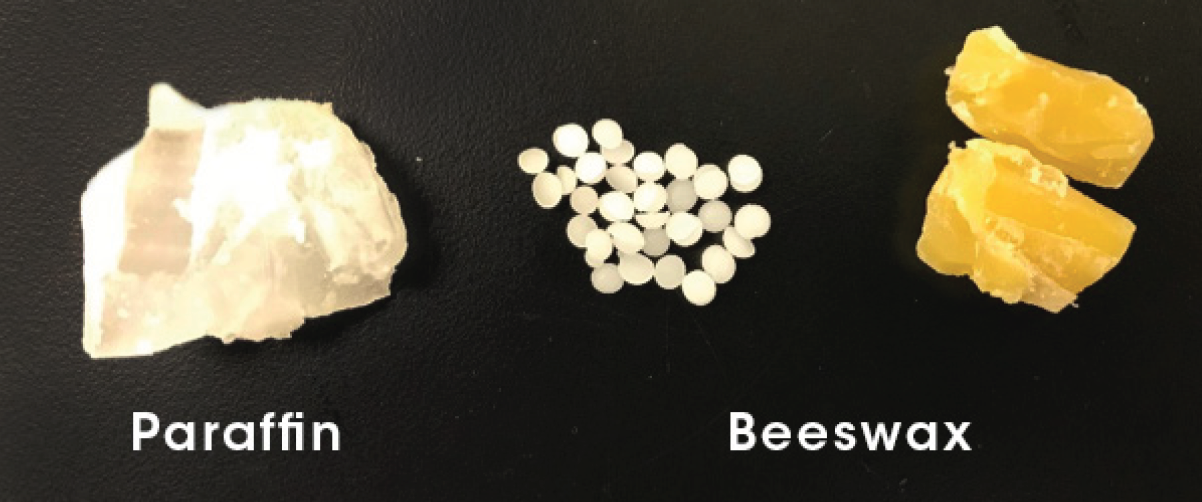
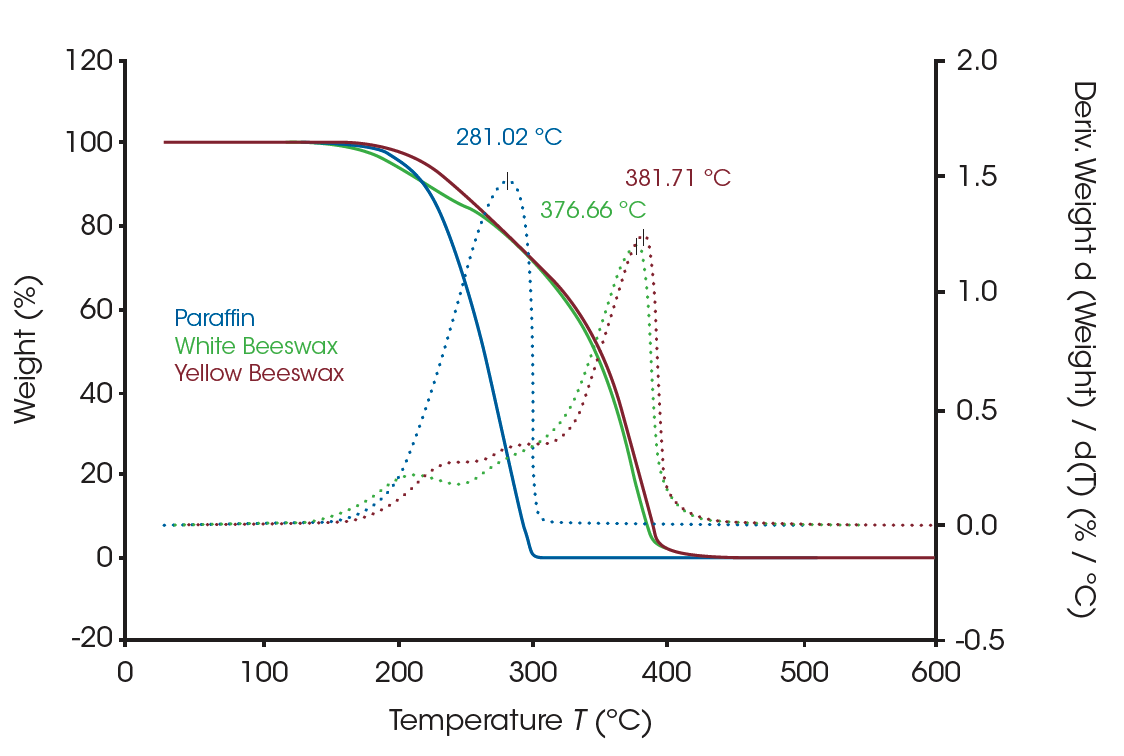
Figure 1 shows the three waxes that were used in the study: paraffin, white beeswax, and yellow beeswax. TGA results of three waxes are shown in Figure 2. The apparent weight loss curve of paraffin (blue solid line) indicates a single weight loss between 150°C and 320°C, suggesting the decomposition of the alkane groups. The red and green solid curves are the weight loss profiles of the beeswaxes. The dotted lines are the weight loss derivative curves of the samples. The derivative curve is a better indicator to show the presence of closely occurring multiple weight losses as well as the apparent single weight loss. There are multiple weight losses shown in the profiles of beeswaxes which agrees with the material structure of multi-components. All three waxes start to lose weight around 135°C, but the beeswaxes are not completely decomposed until the temperature reaches 430°C. TGA is a strong tool to study the compositions of materials as well as materials’ thermal stability.
DSC
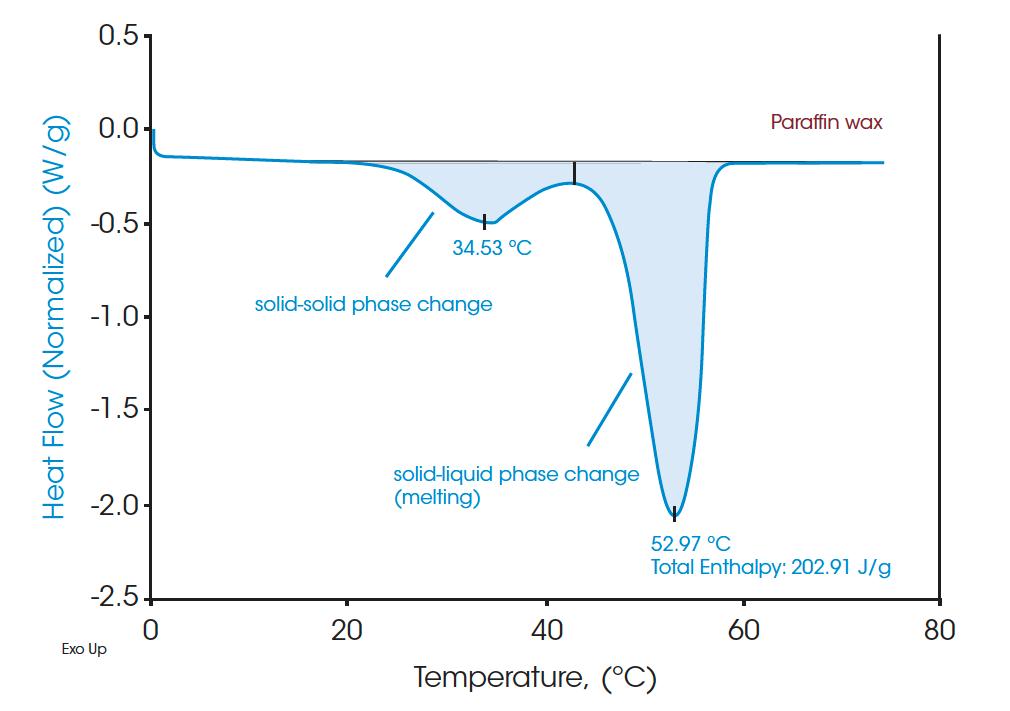
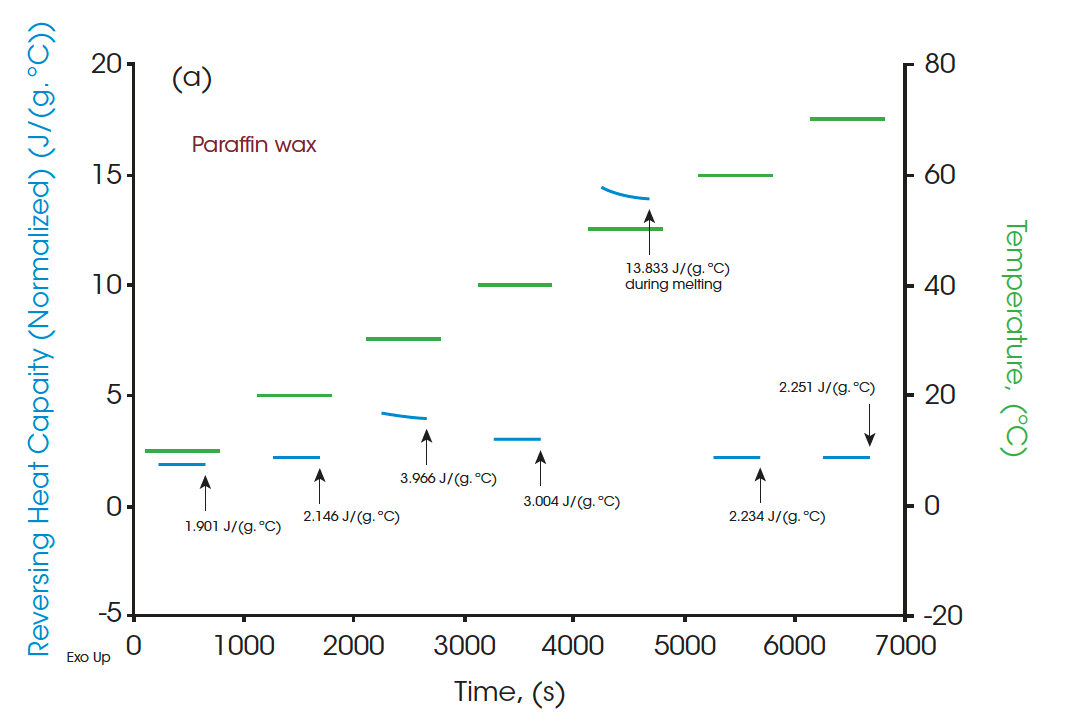
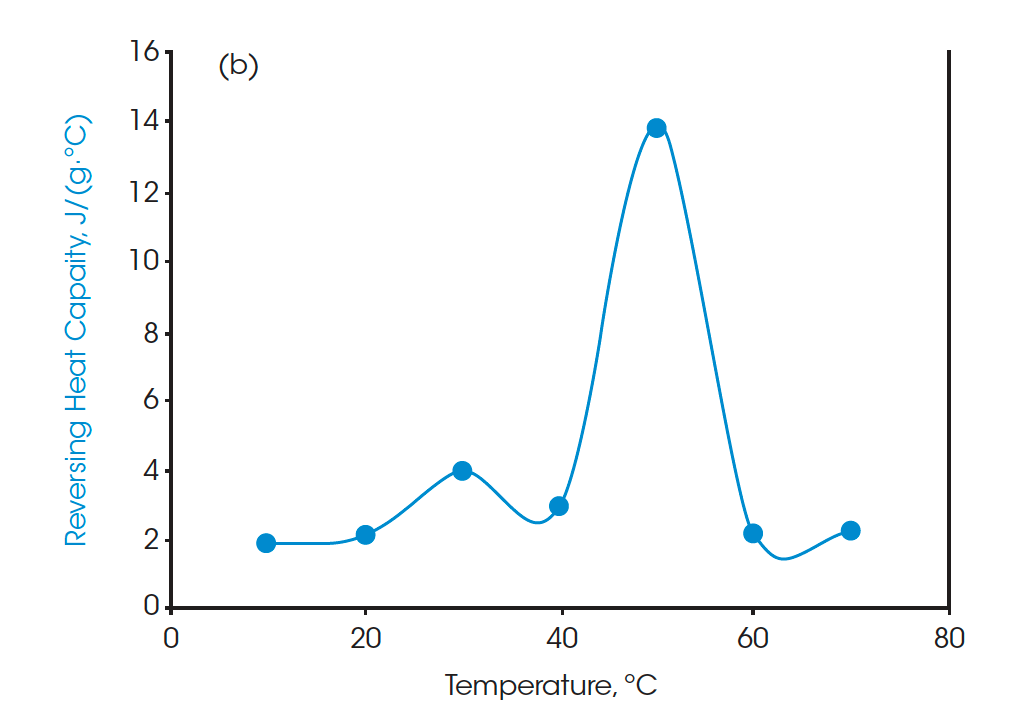
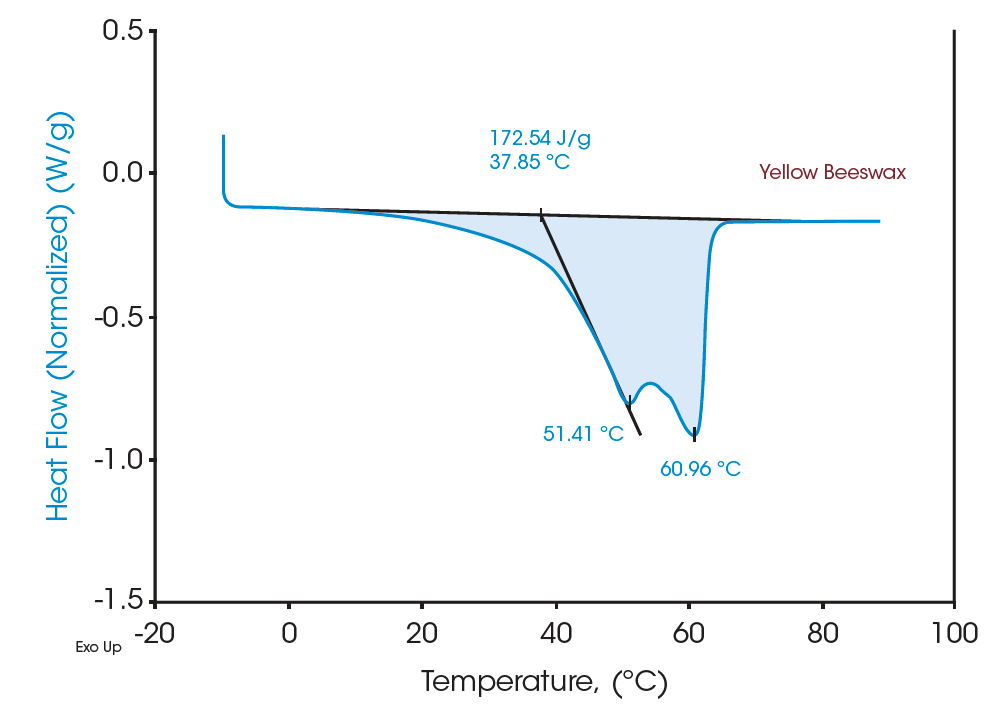
A standard DSC heat-cool-heat method was used on all the samples. The first heat cycle is normally used to erase the thermal history of the materials. The second heats are plotted in Figure 3, Figure 5, and Figure 7 for paraffin, white beeswax, and yellow beeswax, respectively. The Quasi-isothermal MDSC heat capacity results are shown in Figure 4, Figure 6, and Figure 8 for each sample. The paraffin DSC thermogram illustrates two peaks in melting: a minor solid-solid phase change peak, and a major solid-liquid (melting) phase change peak [1]. The solid-solid phase change happens at 34.53°C and the melting point of the paraffin is 52.97°C. The total latent heat of the paraffin is 202.91 J/g which implies a great latent heat storage capability. Figure 4 provides the heat capacities of paraffin at 10°C, 20°C, 30°C, 40°C, 50°C, 60°C, and 70°C. The heat capacity results agree with the heating profile of paraffin as shown in Figure 3. Near the solid-solid transition, the heat capacity increases to 3.967 J/(g·°C) from 2.146 J/(g·°C) by 84.85% at room temperature. Around the melting point, the heat capacity goes up to 13.834 J/(g·°C) and then drops to 2.234 J/(g·°C) at 60°C after melting.
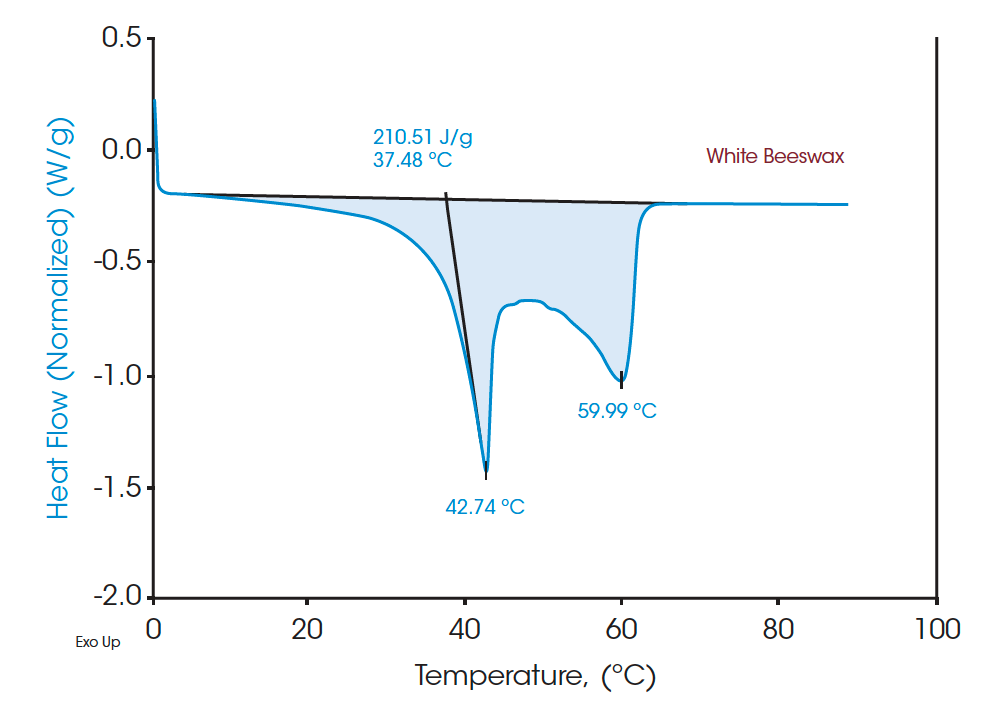
Figures 4 and 6 indicate the DSC thermograms of the two beeswaxes. The white beeswax shows two overlapping peaks in a temperature range from 5°C to 65°C in which the dominant peak (based on the contribution to the total latent heat) appears at 42.74°C. The yellow beeswax shows a similar heating profile where the dominant melting peak is at 51.41°C. The total latent heat of the white beeswax is 210.51 J/g and that of the yellow beeswax is 172.54 J/g, indicating both are great materials for thermal energy storage. These broad melting peaks from beeswaxes probably represent the melting of distinct components. For multicomponent materials such as beeswax, the number of peaks and the location on the curve imply the nature of the chemical compositions of the sample [2]. DSC analysis provides a clear understanding of complex materials such as beeswax with quantitative measurement.
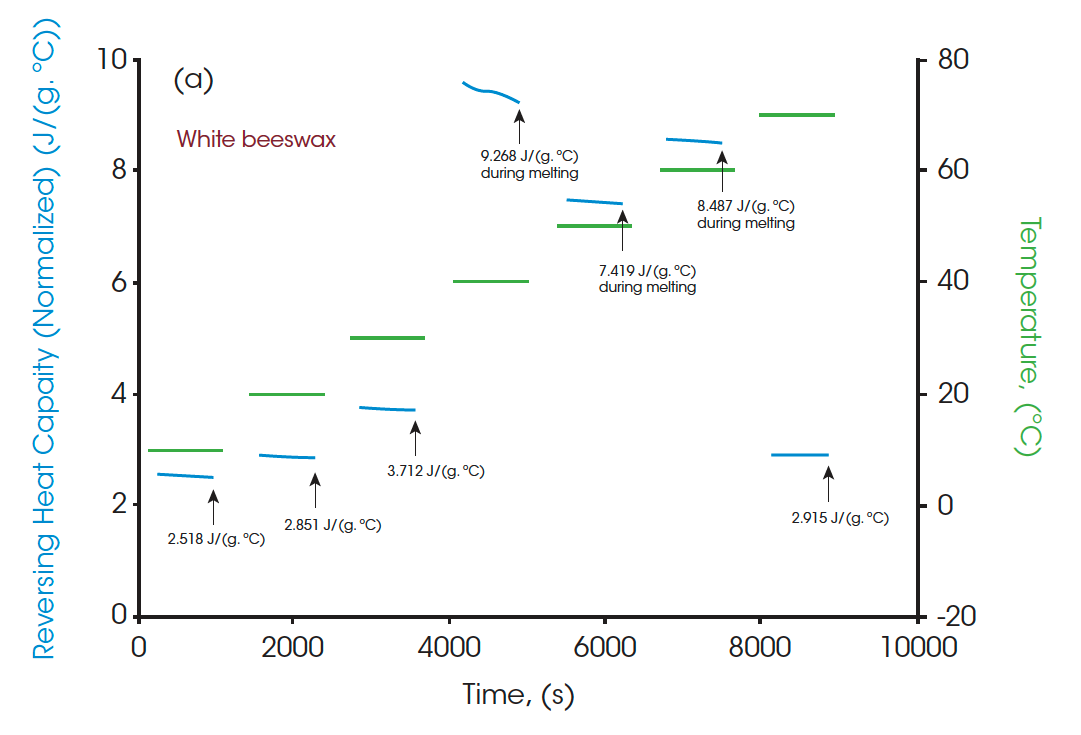
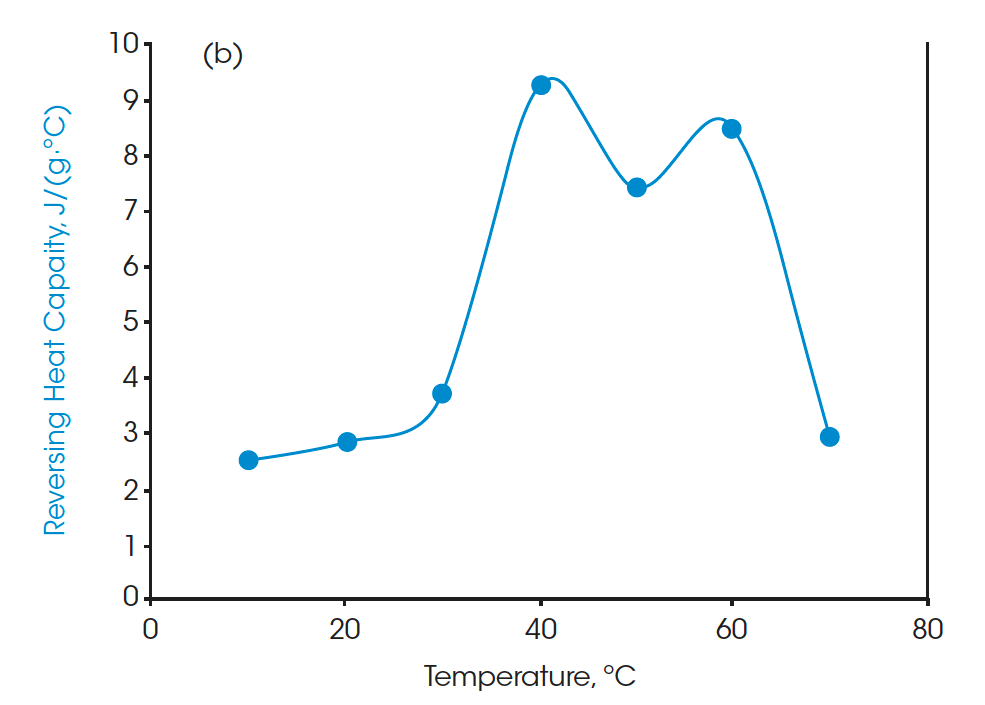
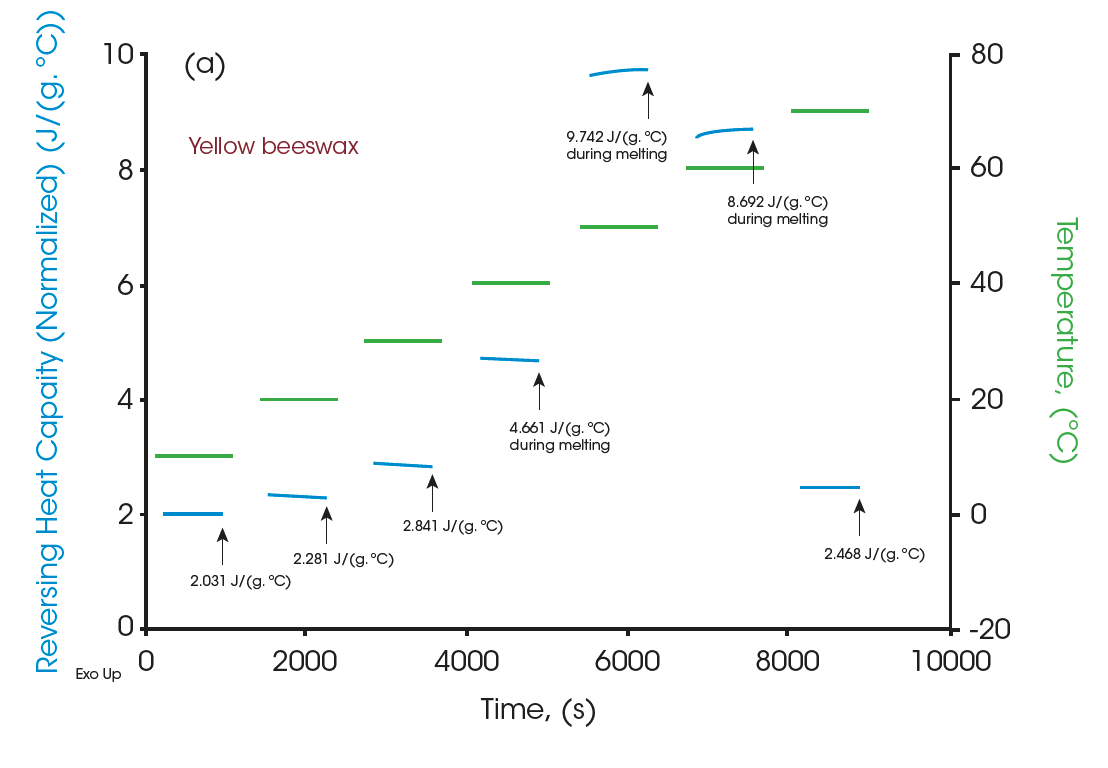

Moreover, the heat capacities measured using the Quasi-isothermal MDSC method are shown in Figures 6 and 8 for both beeswaxes. Similarly, they both agree with the DSC thermograms and match the contour of the DSC transition curves. At the melting peaks, heat capacities increase and then decrease after melting.
All the heat capacity values are shown in Table 1 for all three materials. With accurate measurements of heat capacities, it can provide valuable information on practical designs for systems that heat management is essential. The table below can be used to optimize heat management at various temperatures.
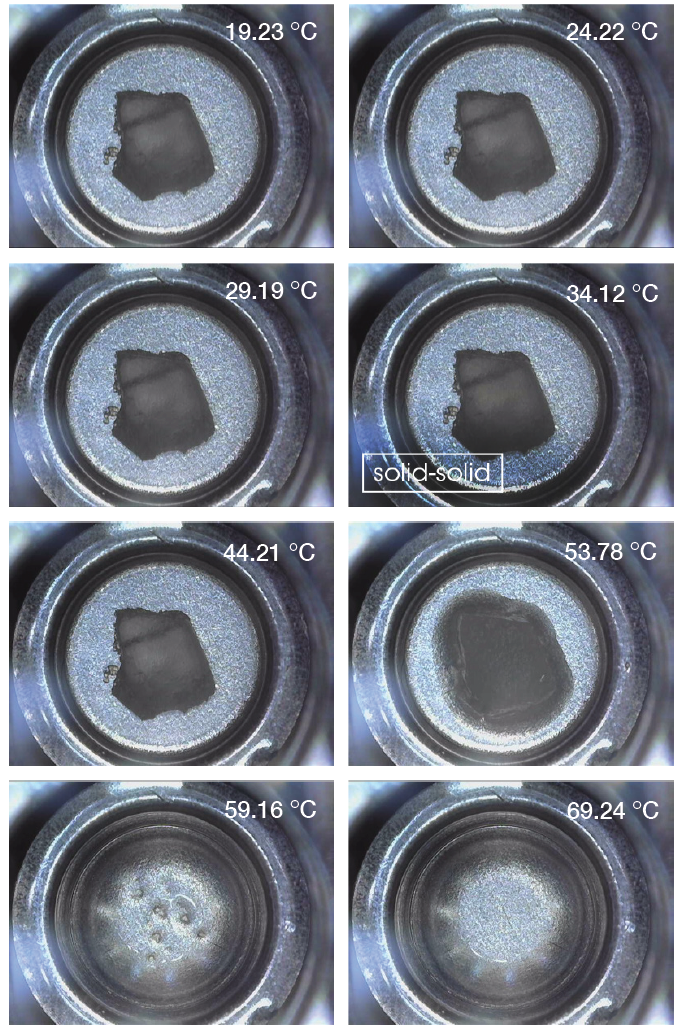
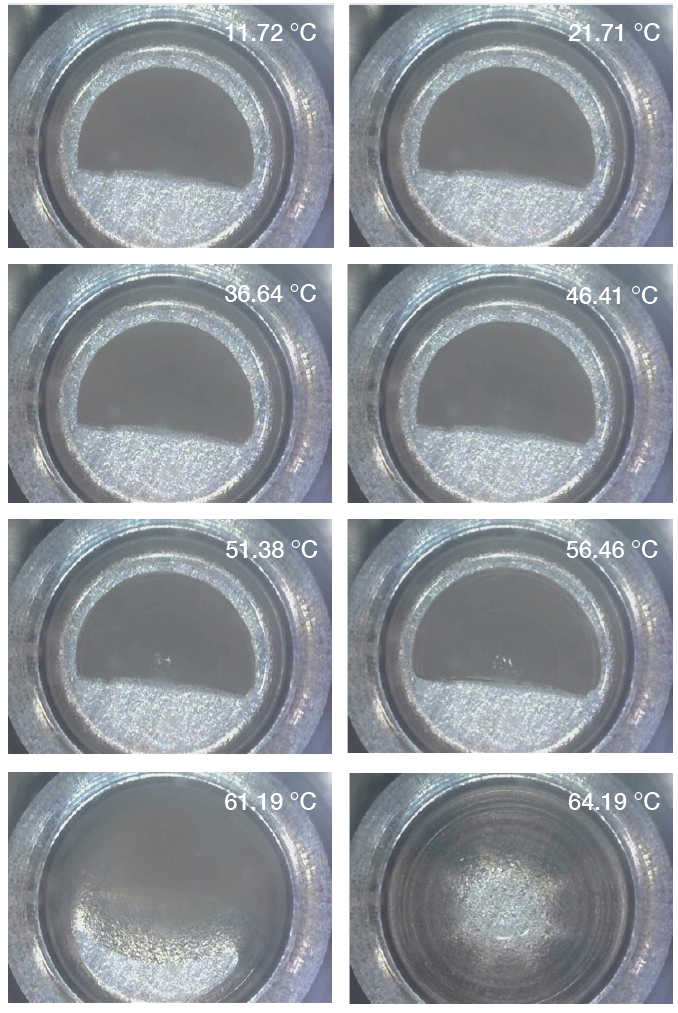
Lastly, the Discovery microscope was used to record images as well as videos during the heating for paraffin wax and the white beeswax. Pictures 9-10 show transitions of paraffin and white beeswax during heating separately. The microscope was able to capture both solid-solid and solid-liquid transitions of paraffin and melting of white beeswax. Clearly, it can show the difference between solid-solid phase transition and solid-liquid (melting) phase transition.
Table 1. Heat capacities of paraffin and the two beeswaxes at seven different temperatures. (Note: heat capacities during melting are undefined.
| Temperature, ºC | Paraffin Cp, J/(g•ºC) | White beeswax Cp, J/(g•ºC) | Yellow beeswax Cp, J/(g•ºC) |
|---|---|---|---|
| 10 | 1.942 | 2.572 | 2.074 |
| 20 | 2.183 | 2.901 | 2.321 |
| 30 | 4.030 | 3.773 | 2.887 |
| 40 | 3.054 | 9.417 | 4.734 |
| 50 | 14.032 | 7.527 | 9.884 |
| 60 | 2.264 | 8.600 | 8.807 |
| 70 | 2.281 | 2.953 | 2.501 |
Summary
Three PCM waxes (paraffin and two beeswaxes) were investigated using DSC, MDSC®, and TGA. The aim of this work was to show the ability of the instruments to give quantitative characterizations on these materials’ thermal properties – melting point, latent heat, heat capacity, and decomposition temperature as well as show the transitions upon heating in pictures. Using these tools together can assist the analysis and future development of PCM based thermal energy storage systems and provide more inspiration for the practical applications.
References
- Y. Schuman, Mechanical Reinforcement, Shape stabilization and Thermal Improvement of Phase-Change Energy Storage Materials Using Graphene Oxide Aerogel, ProQuest Dissertations And Theses; Villanova University, 2017.; Publication Number: AAT 10275363.
- R. Buchwald et al., The thermal properties of beeswaxes: unexpected findings, Journal of Experimental Biology 2008 211: 121-127.
- M. Reading et al., Modulated Temperature Differential Scanning Calorimetry, Springer 2006.
- L. Thomas, Characterization of melting phenomena in linear low density polyethylene by modulated DSC, TA Instruments Application.
- ASTM E1269-11, Standard Test Method for Determining Specific Heat Capacity by Differential Scanning Calorimetry, ASTM International, West Conshohocken, PA, 2011, www. astm.org.
- L. Thomas, Modulated DSC Paper #1, Why Modulated DSC?; An overview and Summary of Advantages and Disadvantages Relative to Traditional DSC, TA Instruments Application.
- L. Thomas, Modulated DSC Paper #2, Modulated DSC Basics; Calculation and Calibration of MDSC signals, TA Instruments Application.
- L. Thomas, Modulated DSC Paper #3, Optimization of MDSC Experimental Conditions, TA Instruments Application.
- L. Thomas, Modulated DSC Paper #9, Measurement of Accurate Heat Capacity Values, TA Instruments Application.
- L. Thomas and S. Aubuchon, Heat capacity measurements using quasi-isothermal MDSC, TA Instruments Application.
Acknowledgement
This paper was written by Yue Schuman, Ph.D., Applications Support Engineer at TA Instruments.
Click here to download the printable version of this application note.

