Keywords: food, food coloring, root vegetables, glass transition, melting, DSC
TA453
Abstract
Food coloring material makes the food more attractive for the user. Food coloring materials are used in many areas: processed or finished foods like ready meals, sauce, cheese, sweets, drinks, ice cream, cakes and preserved fruits. Reason for food coloring could be color loss in cause of production process or giving a more typical color to the product. Thermal analysis could by used in R&D to determine thermal properties and document influence of production process properties. Differential Scanning Calorimetry (DSC) is a nice tool to characterize melting and crystallization effects or glass transition of food coloring materials. DSC can be used as fast method in quality control.
Introduction
Thermal analysis has been used for many years to characterise synthetic polymers. More recently, a growing interest has been shown from both the academic and industrial world to use thermal analysis techniques to characterise model food systems and real food products. [1]
A Differential Scanning Calorimeter (DSC) measures the difference in heat flow rate between a sample and inert reference as a function of time and temperature. Heat absorbed by the sample gives an endothermic response, heat released by the sample gives an exothermic response. DSC experiment can be used to determine several effects like melting, crystallization, curing, denaturation, glass transition, heat capacity or oxidative stability.
The crystalline phase of a material shows the melting effect, the amorphous phase gives the glass transition. The mechanical properties, important for production and processing and features like solubility and taste are influenced by the amorphous and the crystalline phase. So, DSC is an excellent tool to characterize food in general and food colouring as special material.
The European Parliament and Councils published a guideline, when and which food colouring materials are allowed to use.
Within the meaning of this guideline, Food coloring materials are dyes, which give a colour to food or restore the colour of food. This include natural parts of food, and natural materials, which are normally not used as food or characteristically food ingredients. Food coloring may only be used, if if this is demonstrably technologically necessary and harmless to health.
Food coloring are used for restoring the original appearance of food of which the colour has been affected by processing, storage, packaging and adverse consequences for the optical acceptance has been impaired. Whereas colors are used to make food more visually appealing and help identify flavors normally associated with foods and to give color to food otherwise colorless. [2]
Experimental
Two different food coloring materials of root vegetables were characterized by DSC for this paper: one black carrot and one red beet powder.
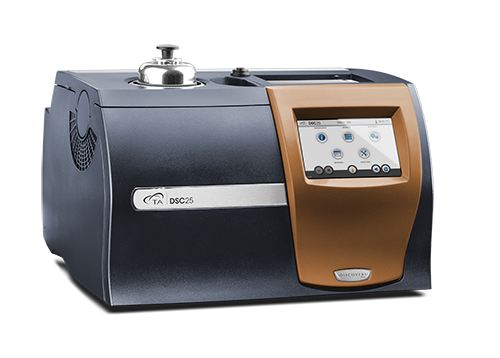
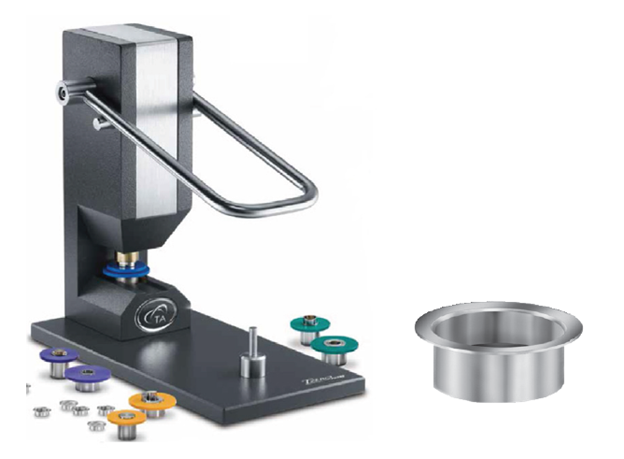
Materials were analyzed by using the Discovery DSC 25 from TA Instruments in combination with the compressing cooler RCS120. Gas atmosphere was nitrogen for all experiments. Sample weight of 7-8 mg was used. The black carrot sample was analyzed between -50 °C and 100 °C, temperature range for the red beet sample was -50 °C up to 145 °C. To show the influence of heating and cooling rates on the thermal behavior, experiments with different rates were made. TA Instruments Tzero pans, made of aluminum were used – hermetic closed or with pin hole.
Materials were pre-analyzed by Thermogravimetric Analysis (TGA) to determine the thermal stability. TGA measures weight loss or gain as a function of temperature, time and atmosphere.
DSC upper temperature should be limited to be below decomposition temperature.
Results and Discussions
Black Carrot Powder
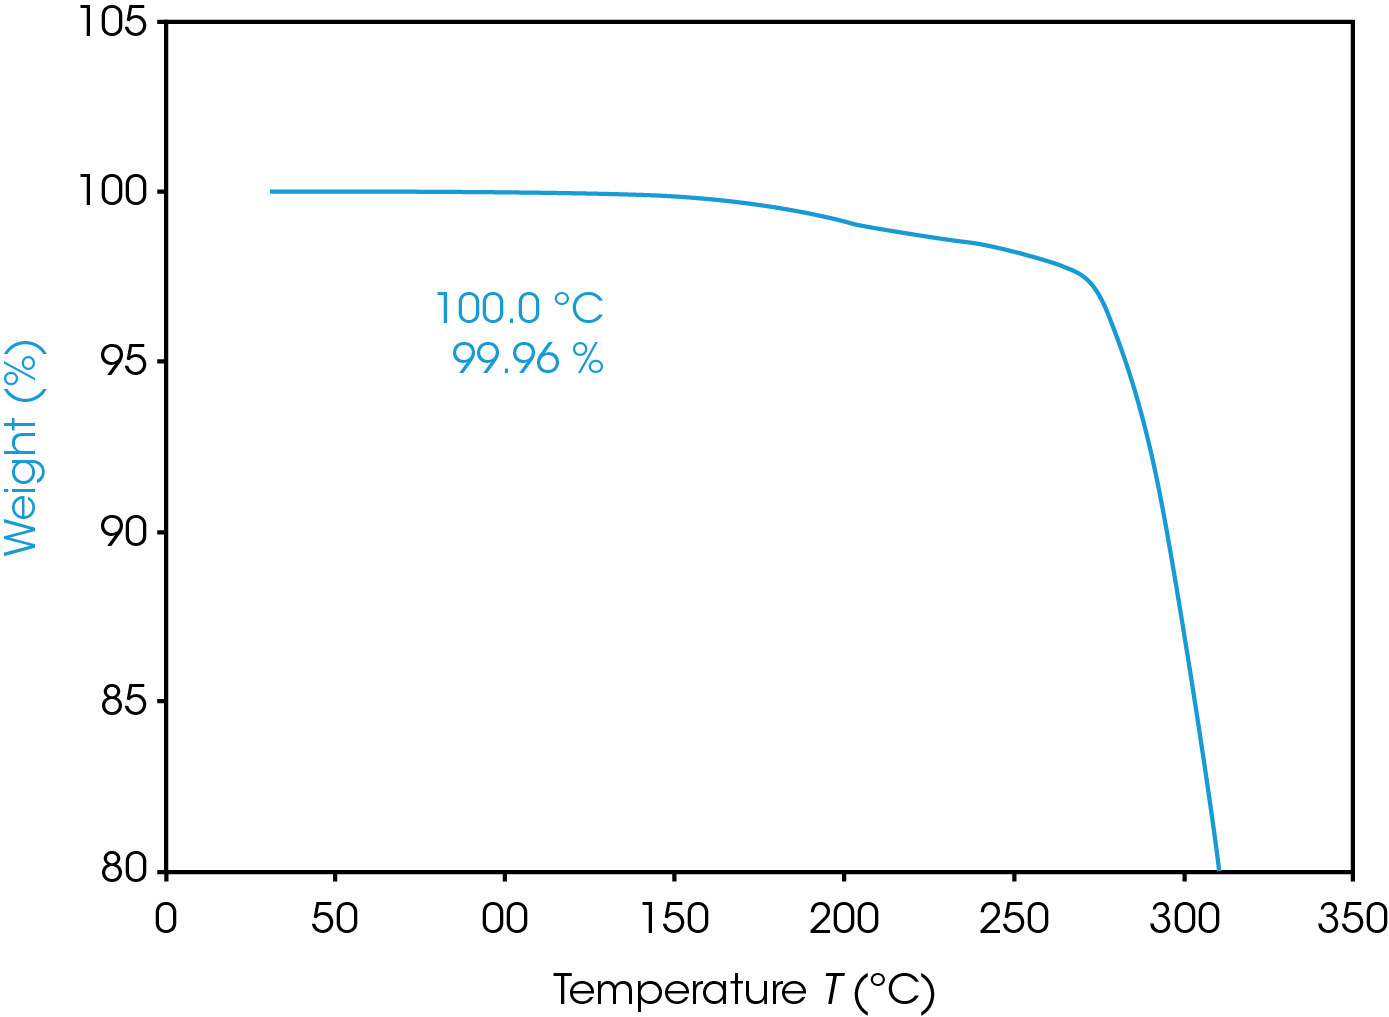
Figure 3 shows the result of the TGA pre-experiment. Weight in % is screened over temperature in °C. Material is stable up to 100 °C. Material shows a first weight loss above 150 °C, main decomposition starts above 270 °C.
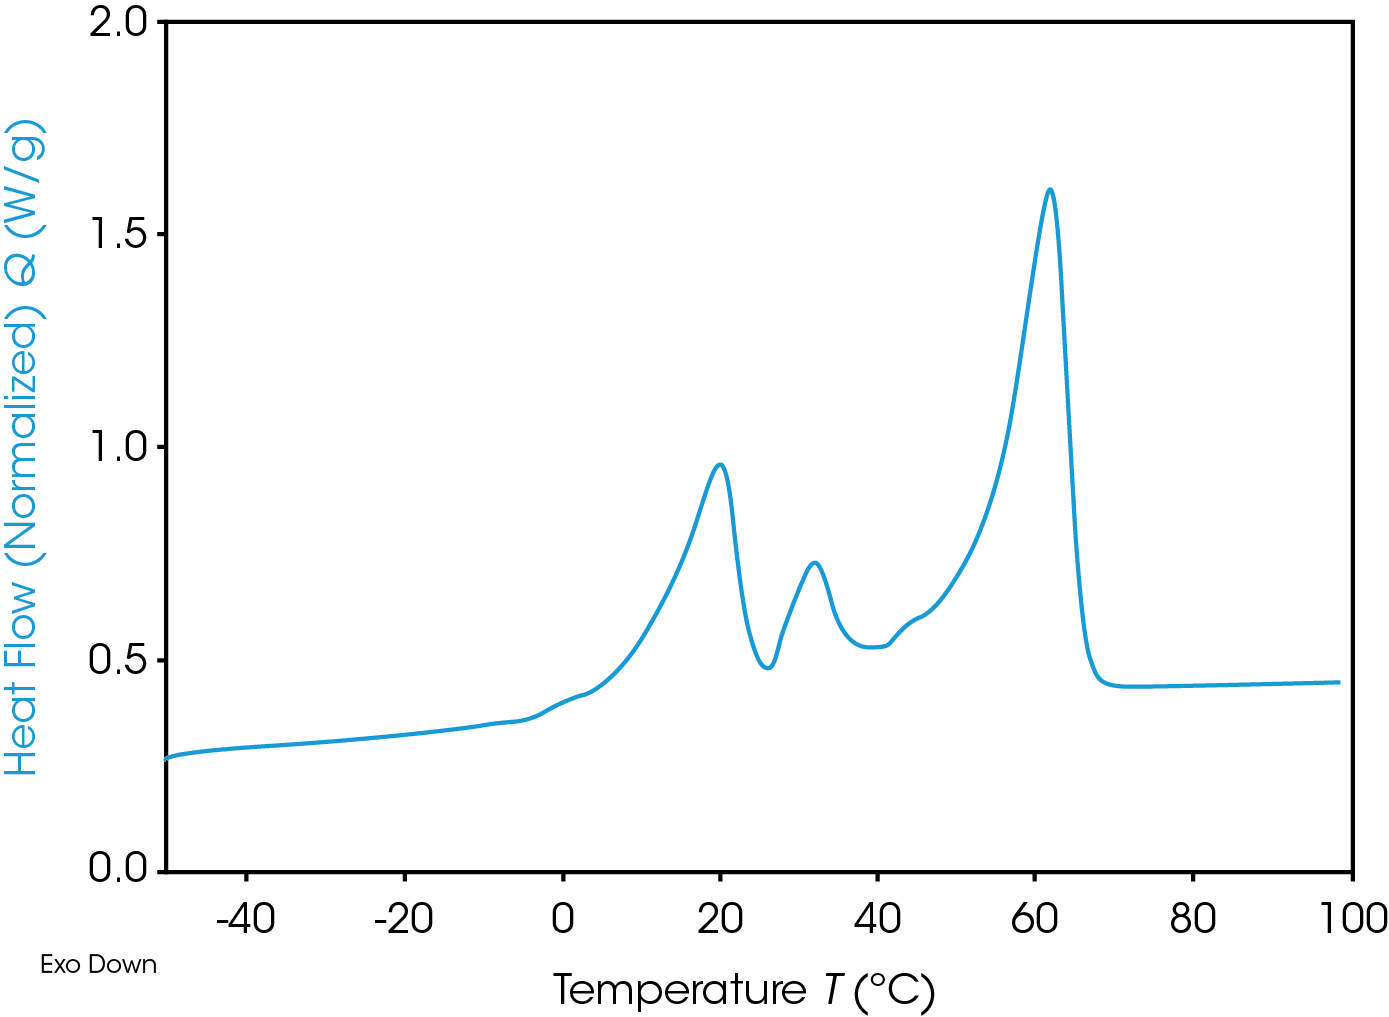
In Figure 4 DSC curve of first heating experiment is visible: Heat flow in W/g is screened over temperature in °C. Exothermic effects are going down. Material shows three different, not separated endothermic peaks. Different melting effects are detected.
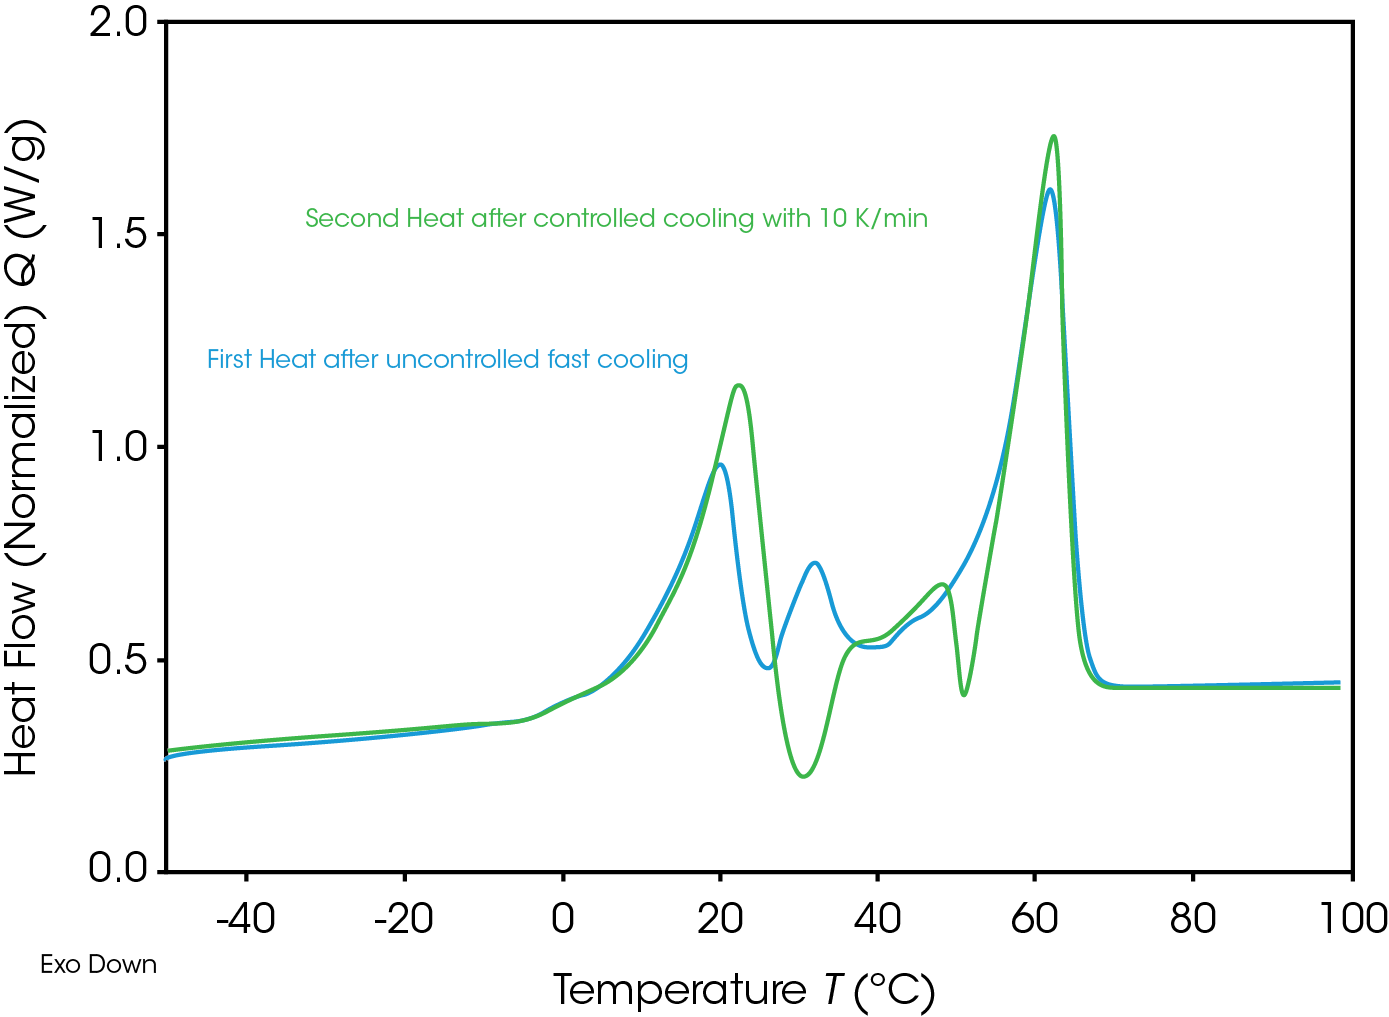
After first heat, material was cooled down with 10 K/min and heated up in a second heat with 10 K/min. Comparing first and second heat (Figure 5) significant differences are shown, depending on the thermal history, influenced by production processes, storing and cooling rate. Additional detected exothermic effects in the middle temperature range give a notice, that unstable/meta stable crystals are build.
Meta stable crystals could melt and re-crystalize during the heating experiment, new build crystals could have higher stability. Crystallization is a kinetic, means time-depending effect. Re-crystallization is always a notice for non-stability, which is important for storing parameter. Different crystal forms could have different properties like solubility, which is an important information for any kind of food coloring materials.
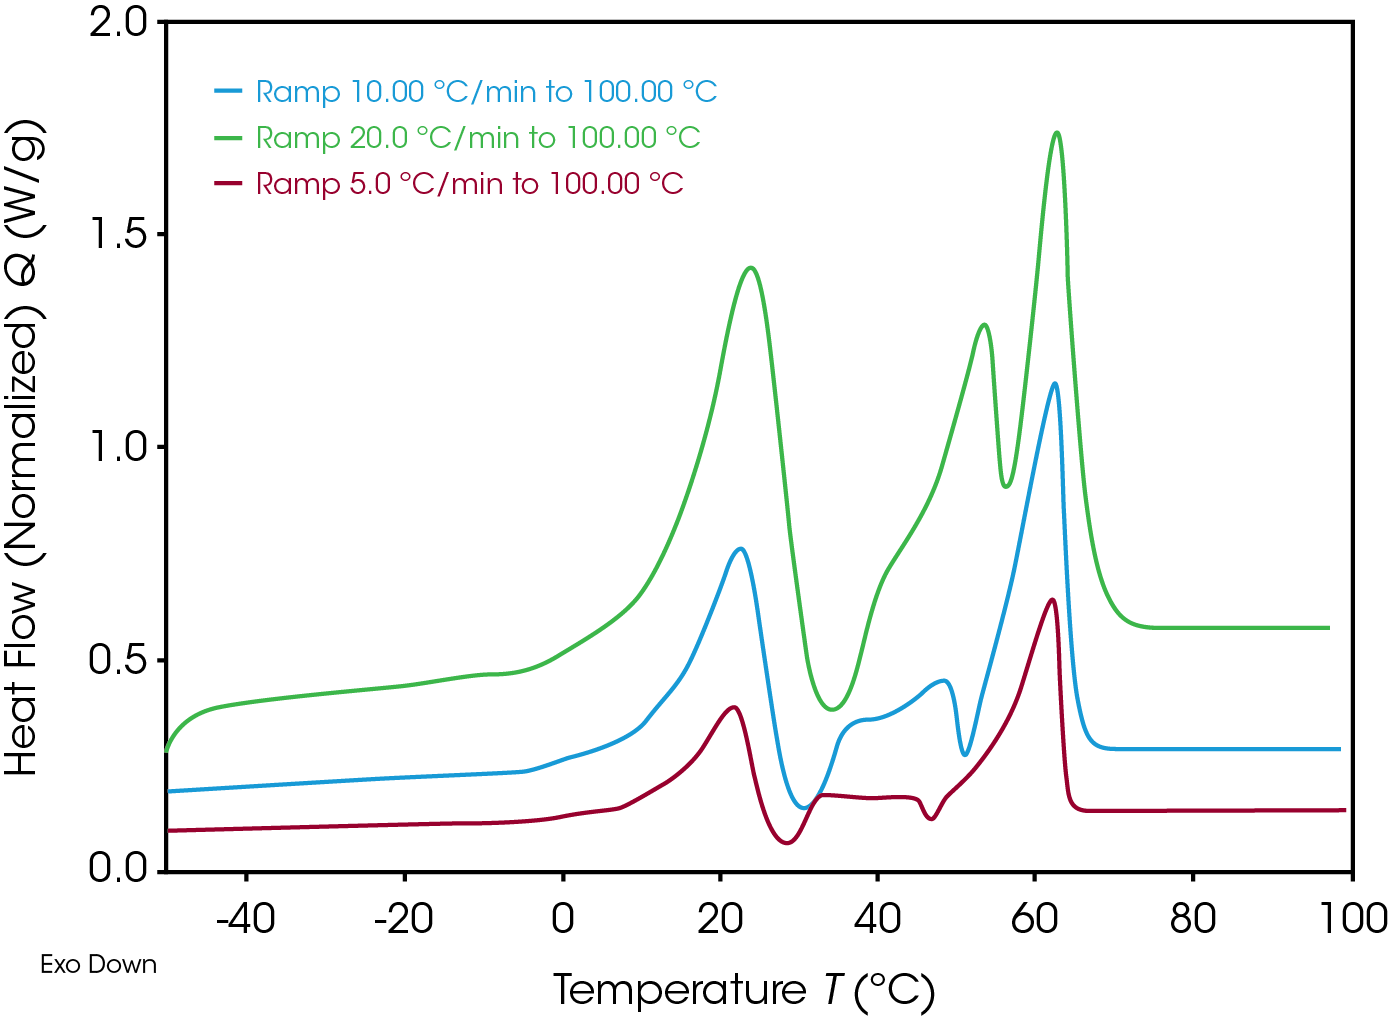
Lower heating rate gives more time to the sample to re-crystallize. To check this time effect, material was heating with different heating rates. Figure 6 shows the result with 5, 10 and 20 K/min. Material was cooled down always with 10 K/min before the heating phase.
Using lower heating rate, the exothermic re-crystallization starts at lower temperature – again a good notice for storing stability.
Note: Different signal height depends on heating rate.
In additional experiments the influence of the cooling rate on crystallization process and subsequent melting effects in heating phase was analyzed.
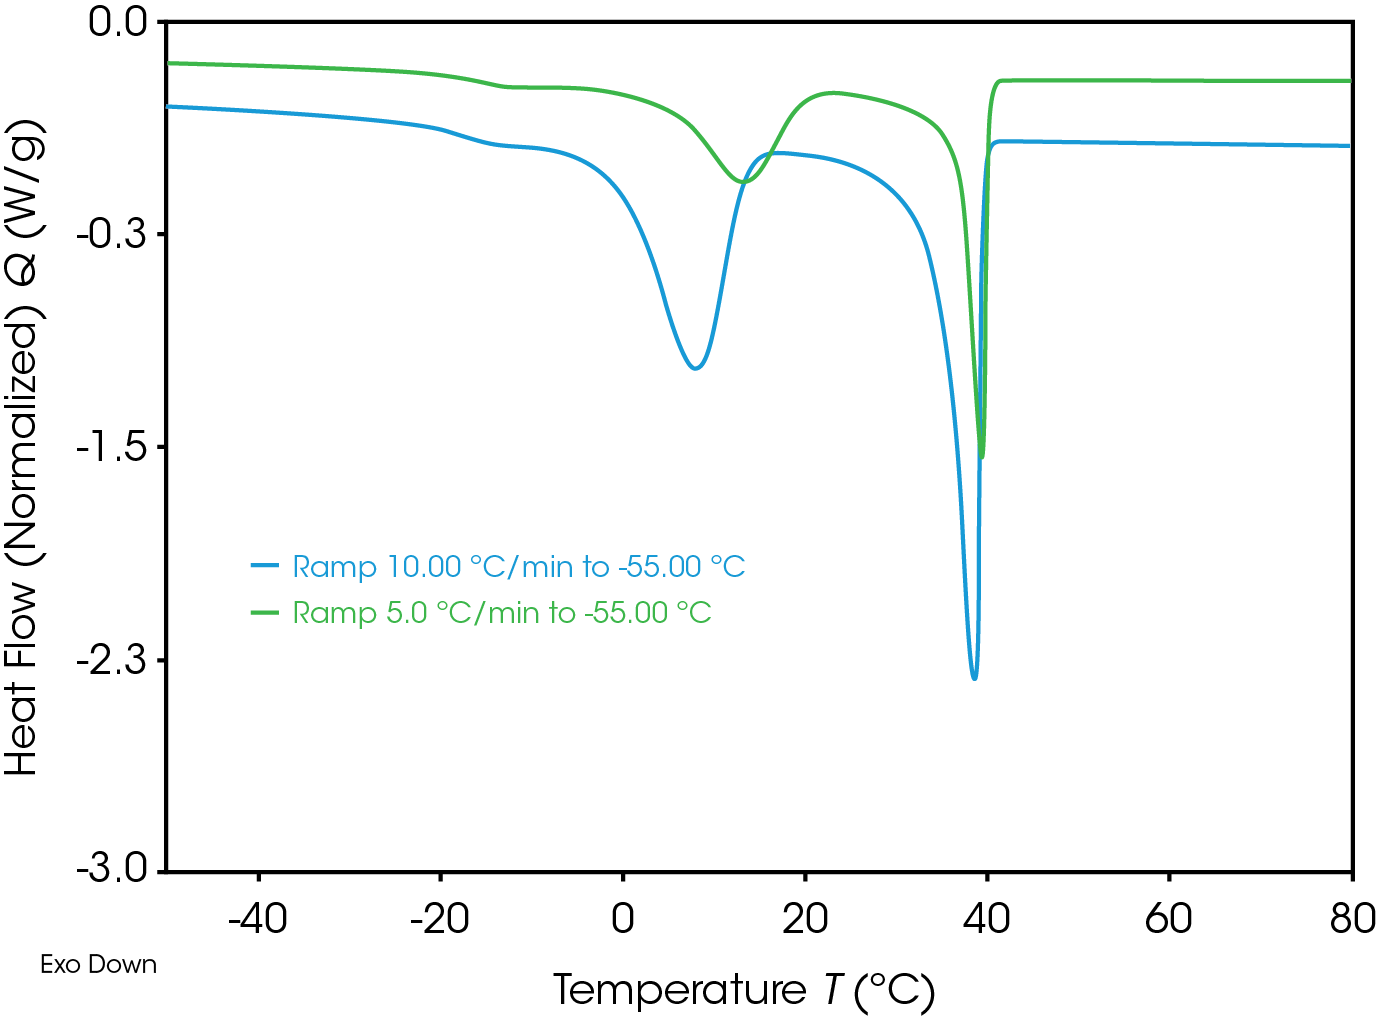
Figure 7 shows the crystallization curves during cooling with 10 and 20 K/min. Time-depending of crystallization is clear visible. Crystallization starts – specially for the effect around room temperature – at higher temperature, if samples get more time by lower cooling rate.
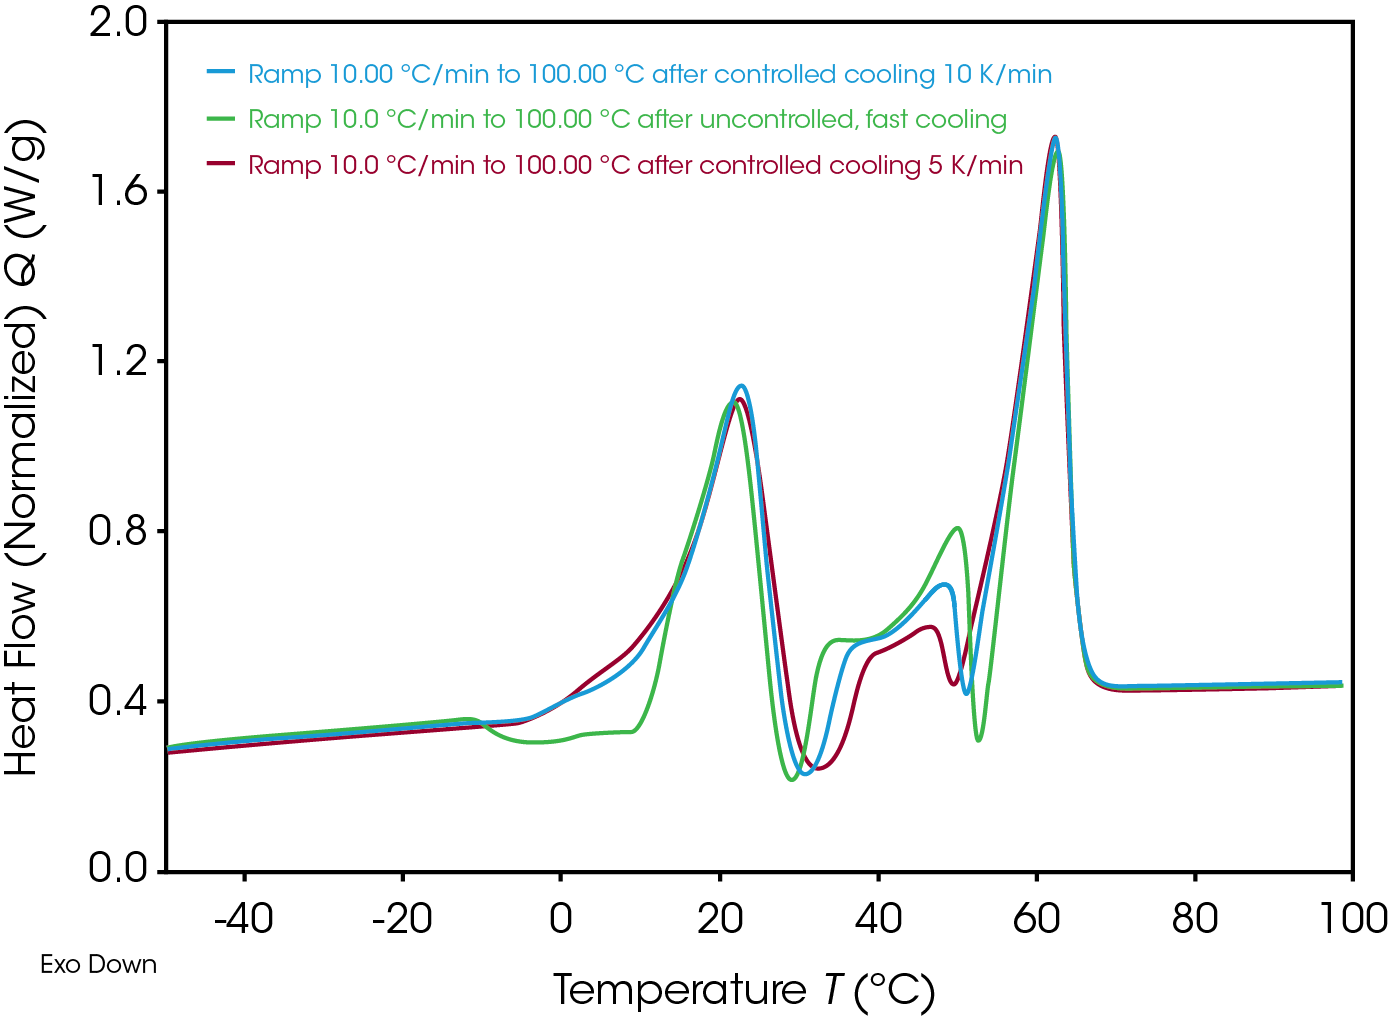
Figure 8 screens the heating curves (always 10 K/min) after different cooling rates. Influence of uncontrolled cooling is visible in the range -10 °C to 15 °C: an additional exothermic re-crystallization is detected. The temperature range between the main melting effects is influenced by the cooling before, too.
Red Beet Results
As pre-experiment, the thermal stability of the red beet powder was determined by Thermogravimetric Analysis: Material was heating with 10 K/min under N2, the weight curve and the derivative curve in Figure 9 shows several weight loss steps up to 250 °C. Evaporation of some water in lower temperature range is suspected. The derivative signal gives information about changings in the rate of weight loss. This signal is often used to fix the limits for different weigh change steps.
The heat flow signal is typically given in W/g. If the weight is changing by loss of water, the quantity of the Heat Flow is falsified. Additional, water is a very good plasticizer. Absence of water could shift the glass transition. For these reasons, material was analysed two times: one time in a hermetic closed sample pan, additional in a non-hermetic pan with pin whole.
DSC graph in Figure 10 is showing the first and second heating and cooling curves as an overview. All curves show the step change in heat flow: The Glass transition is detected. The overlapping endothermic peak in the first heat is called “Enthalpic Relaxation”, cause could be production or storing processes.
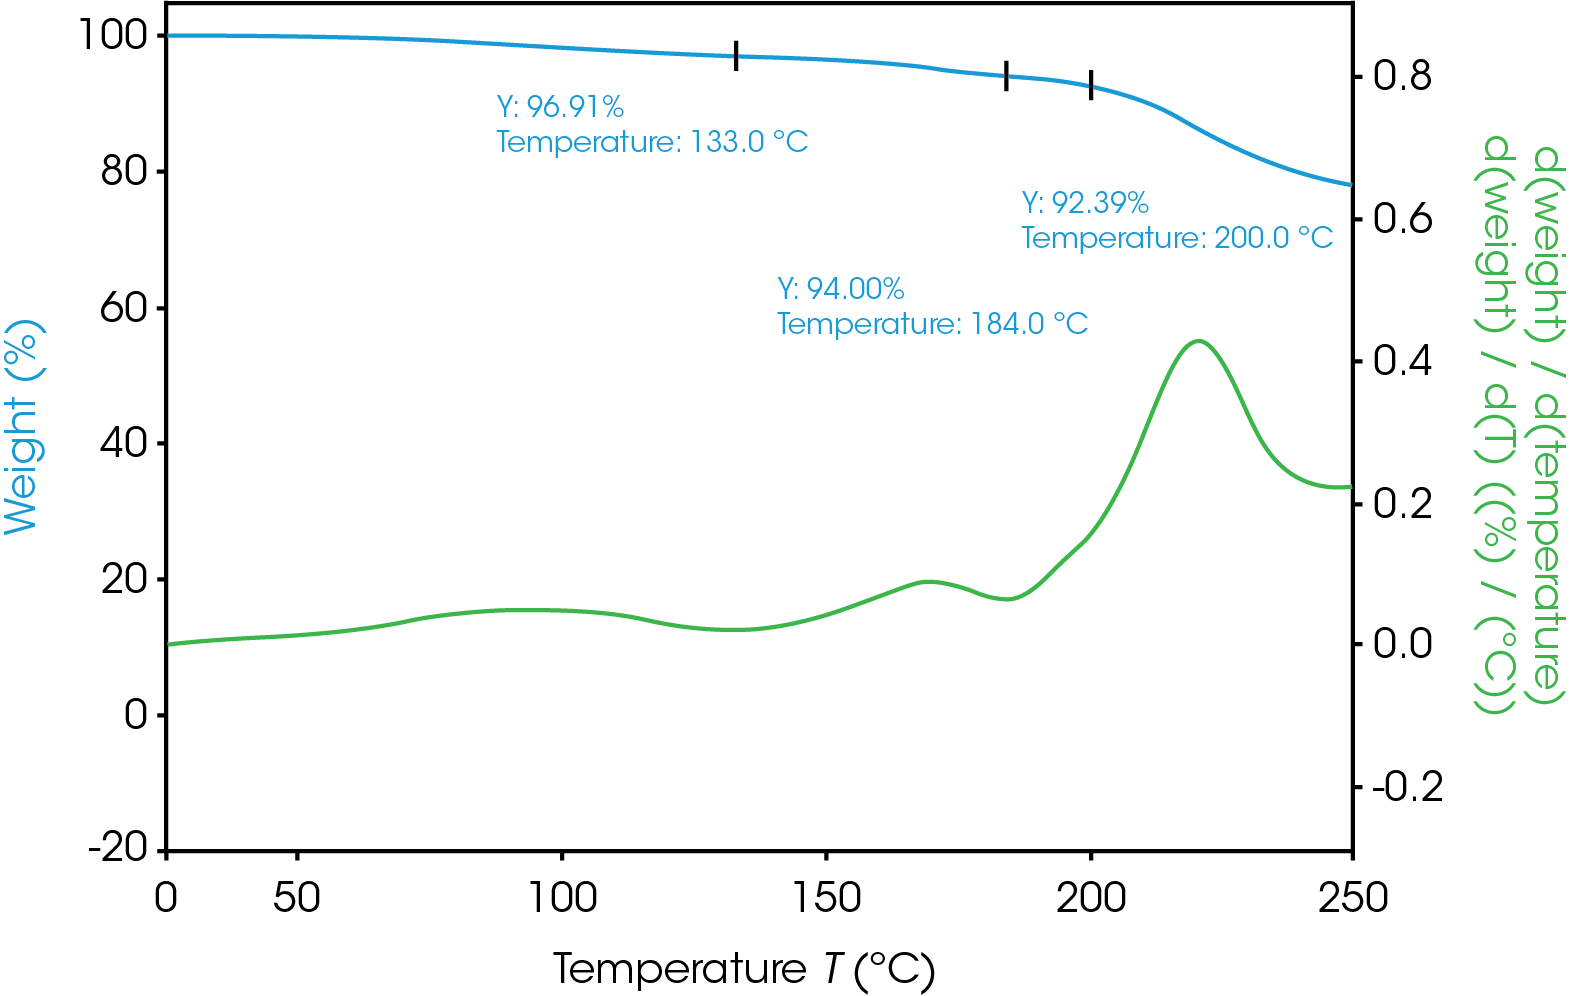
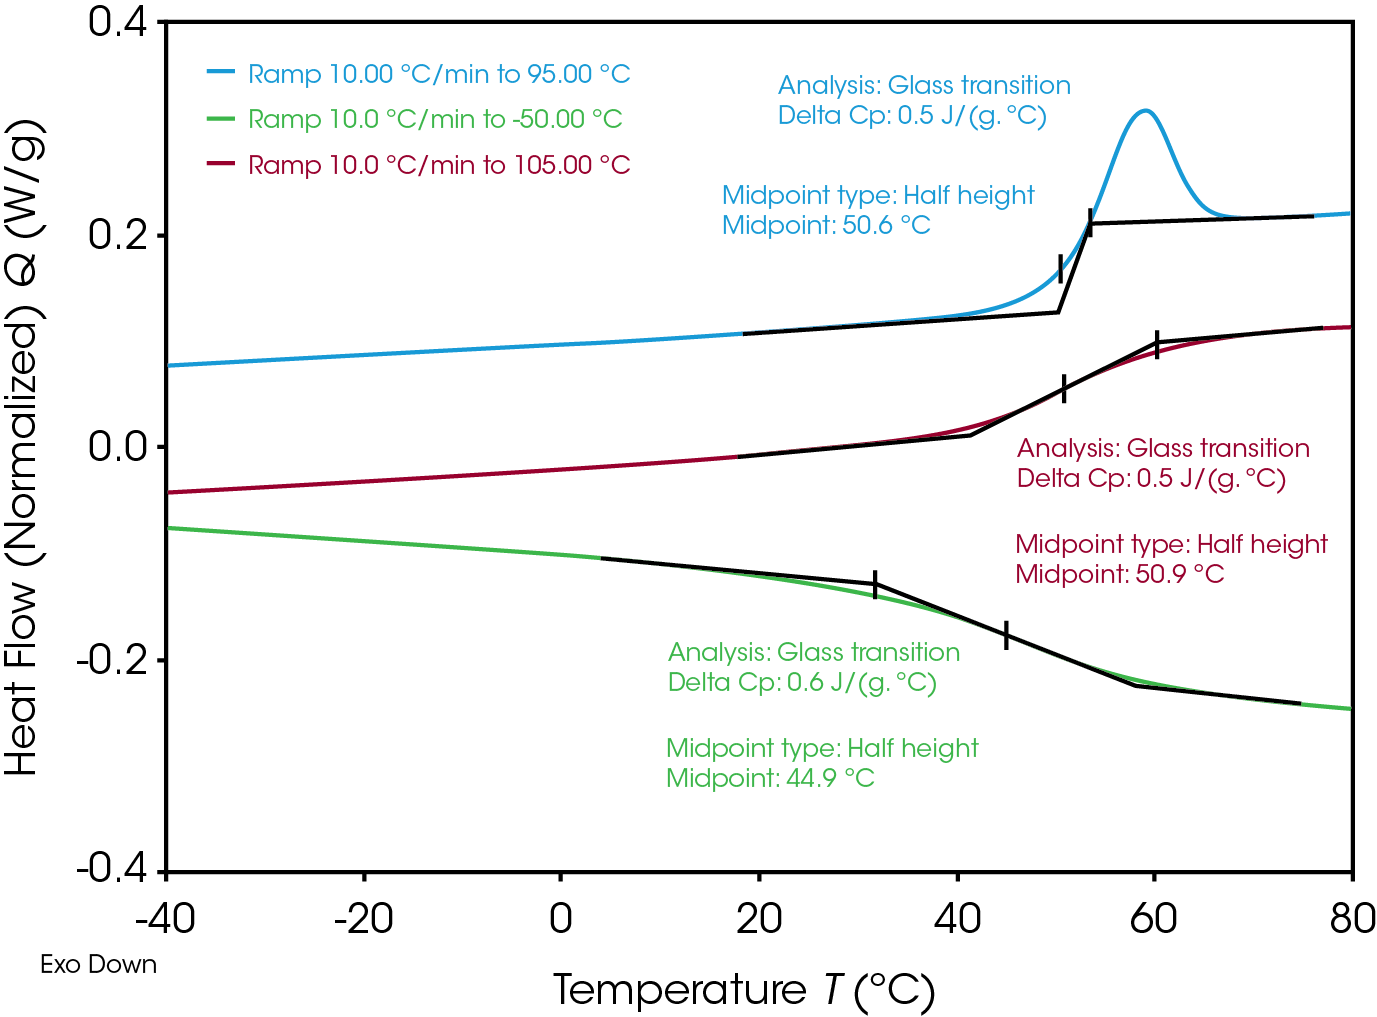
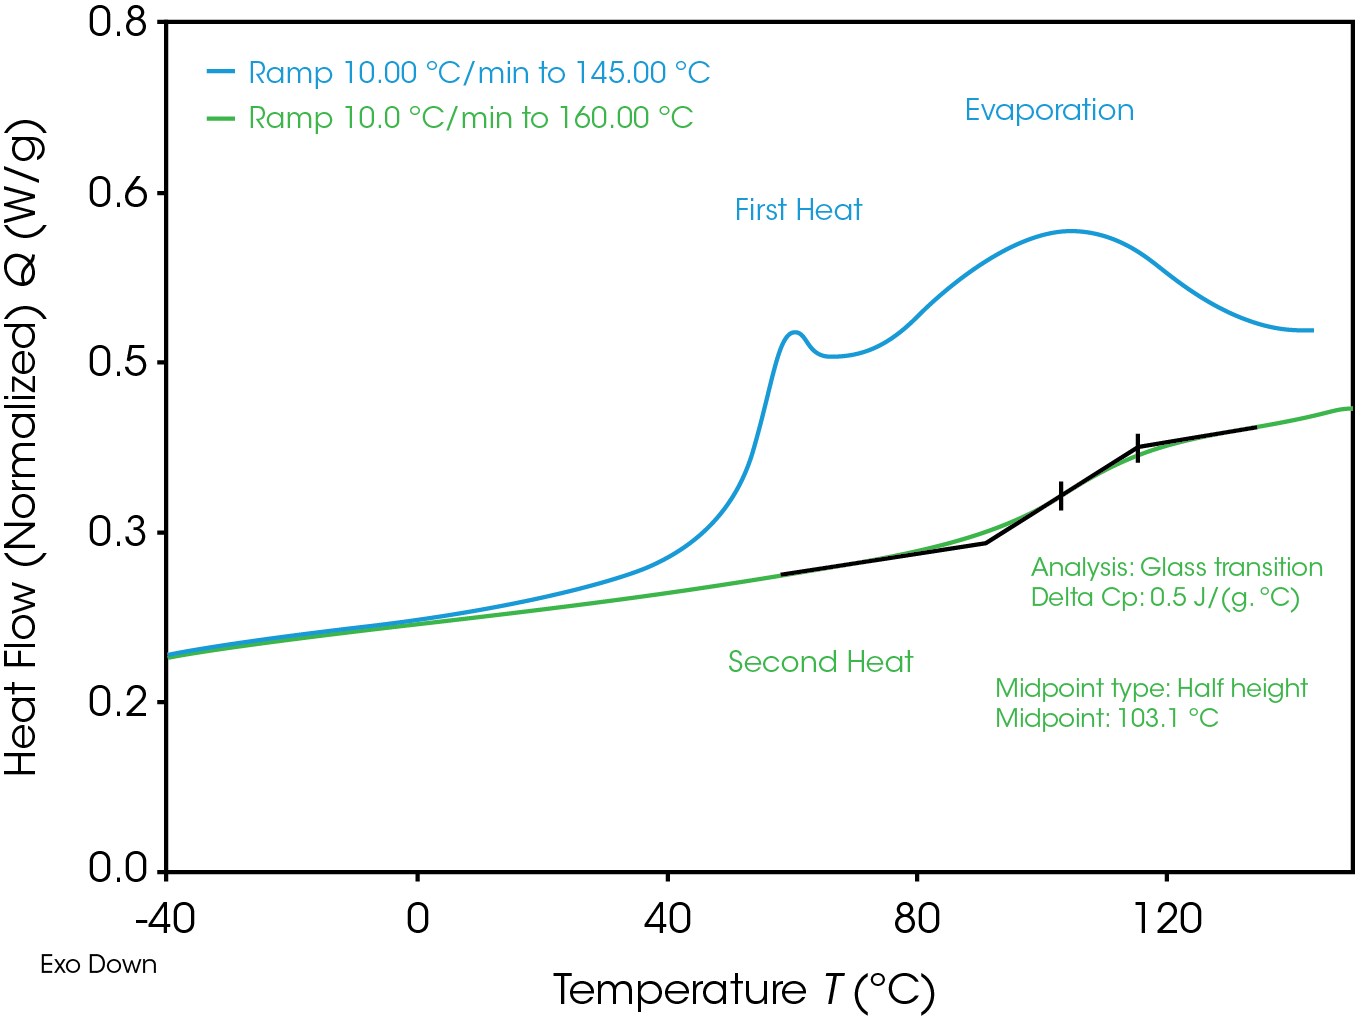
Figure 11 shows the comparing of first and second heat in a non-hermetic pan. In the first heat an additional endothermic evaporation peak is detected. The glass transition in the second heat is shifted around 50 °C to higher temperature, in cause of loosing the plasticizer water in the first heat.
Summary
Thermal analysis is an excellent tool to determine properties of food coloring materials. Melting, crystallization and glass transition effects can be characterized. Influence of temperature profiles can be analyzed by using different heating and cooling rates. Information can be used for characterizing stability and storing parameter.
References
- The use of modulated temperature differential scanning calorimetry for the characterisation of food systems, P. De Meuter et al. / International Journal of Pharmaceutics 192 (1999) 77–84
- Amtsblatt der Europäischen Gemeinschaften Nr. L 237/13 RICHTLINIE 94/36/EG DES EUROPAISCHEN PARLAMENTS UND DES RATES über Farbstoffe, die in Lebensmitteln verwendet werden dürfen
Acknowledgement
This paper was written by Monika Schennen, Applications Support Scientist at TA Instruments.
Click here to download the printable version of this application note.

