Keywords: DSC, TMA, TGA, DMA, thermal analysis, tensile test, battery, battery separator, lithium ion battery, polypropylene film
TA457
Abstract
The battery separator is a critical part of the lithium ion battery. This application note demonstrates basic thermal analysis techniques that are used in the characterization of the separator. Thermogravimetric analysis (TGA) provides stability information, mass loss as function of temperature and atmosphere, and mass of filler content. Decomposition kinetics and lifetime estimations are also possible using thermogravimetric techniques. Differential scanning calorimetry (DSC) provides information regarding major thermal transitions such as the glass transition, melting, crystallization, and heat capacity. Some compositional information is also obtained based on the known melting points of commonly used polymers in separator design. Thermomechanical analysis (TMA) is used to determine the dimensional change as a function of temperature. For battery separators, three important dimension change temperatures are determined: shrinkage onset temperature, deformation temperature, and rupture temperature which are related to the collapse of the pores effectively shutting down the battery to prevent thermal runaway (1). This sample is a uniaxially stretched PP film and these temperatures are determined in the machine direction (MD). Evaluation of dimension change in the transverse or cross direction (TD) is also important as excessive shrinkage could lead to electrode contact and short circuit. Finally, dynamic mechanical analysis (DMA) is important for evaluating tensile strength in both the MD and TD, as well as elongation at break. Additionally, DMA is used to perform viscoelastic experiments that yield important information regarding moduli as function of temperature and excellent sensitivity in determining the glass transition temperature as subambient properties are also important.
Introduction
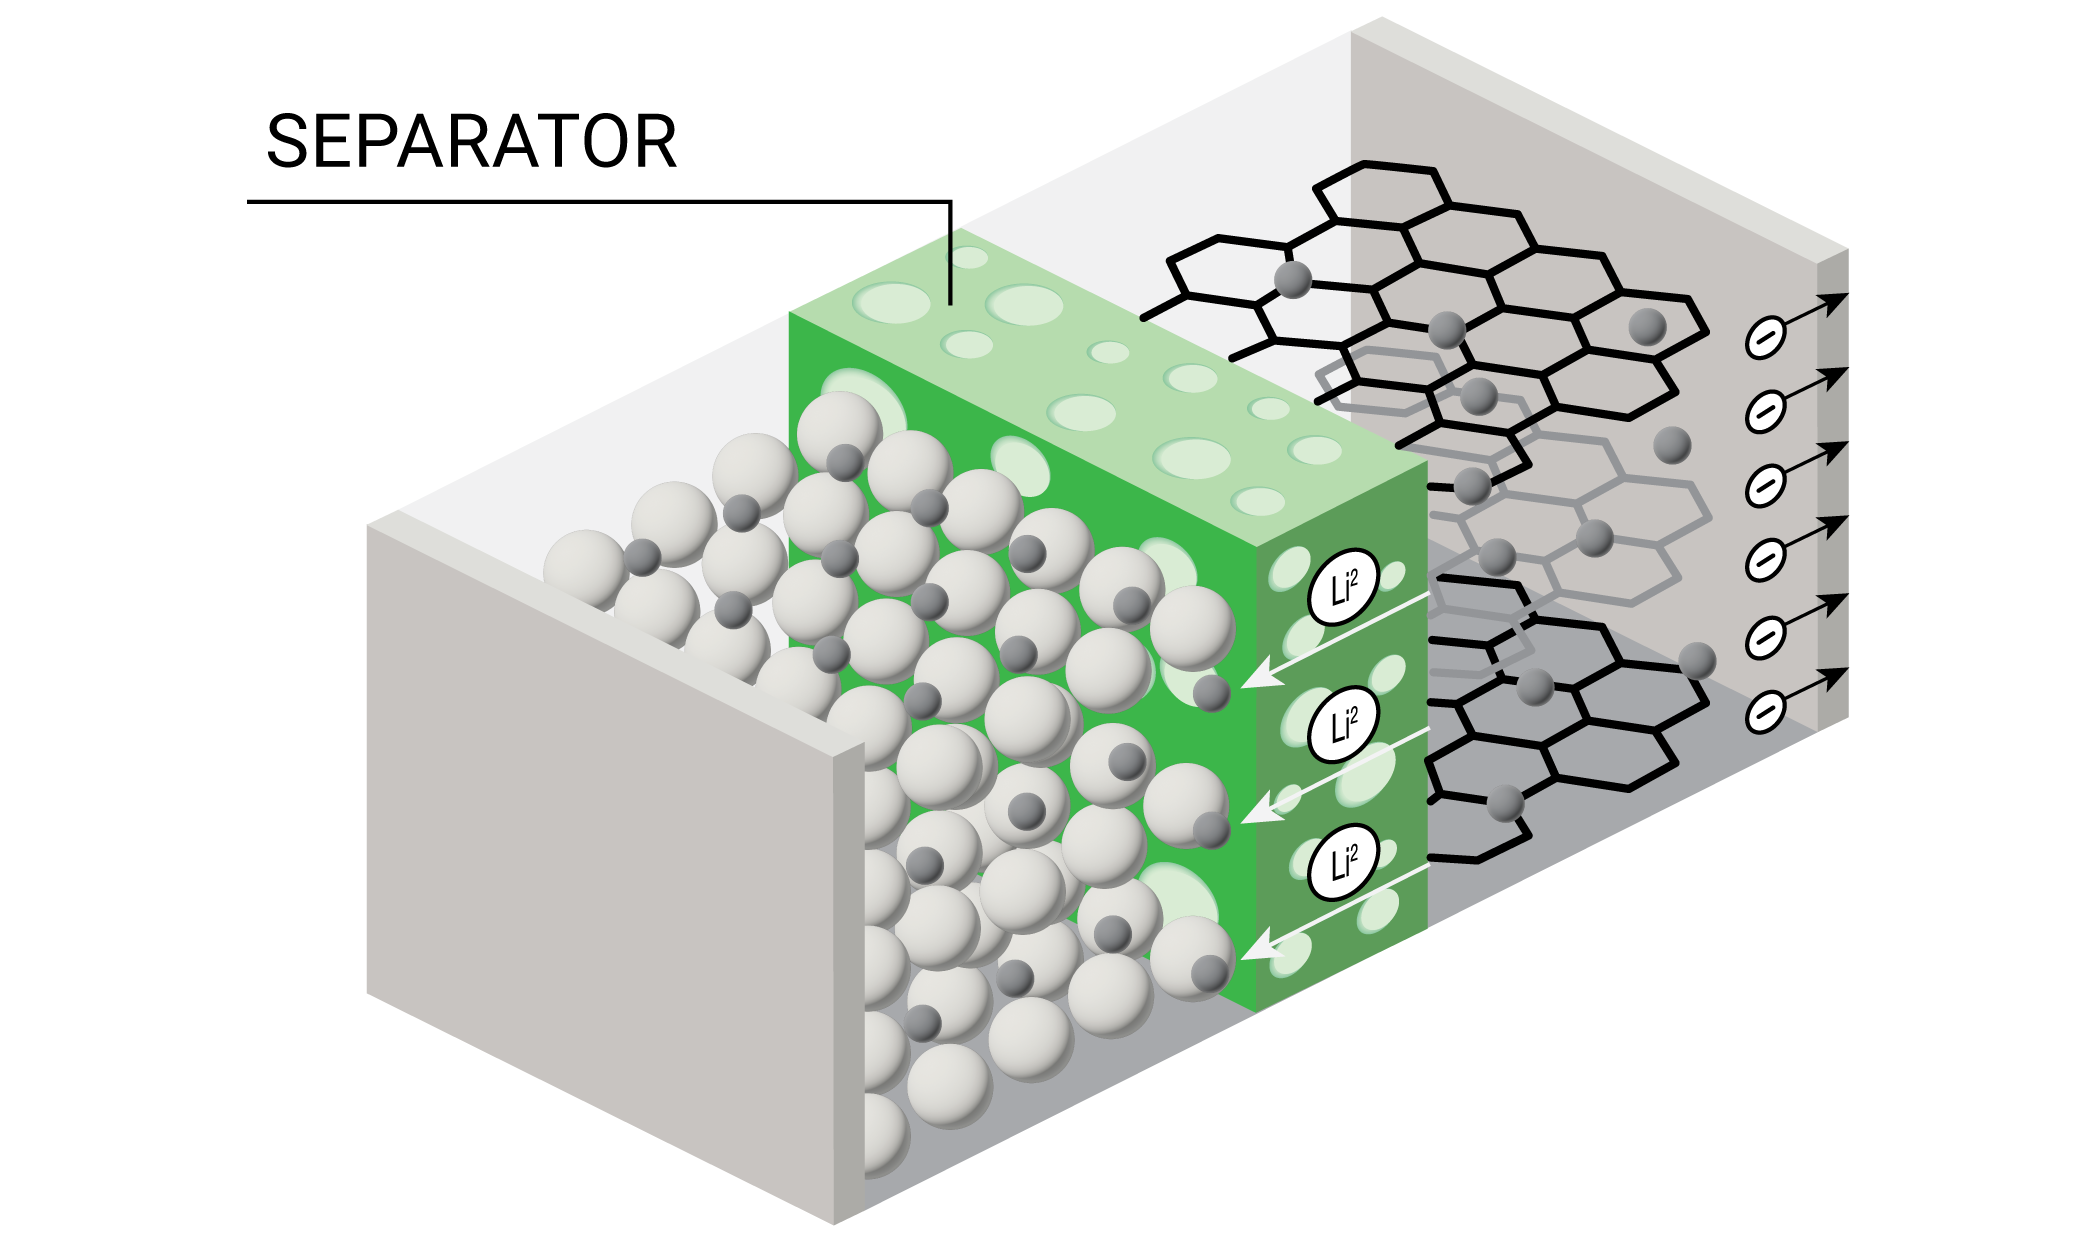
Lithium ion batteries (LIB) are rapidly becoming the most common source of stored energy for everything from personal electronic devices to electric vehicles and long-term energy storage. A diagram of a battery is shown in Figure 1.
One of the key components of the battery is the porous separator which prevents contact between the anode and cathode and allows transport of the lithium ions during charging and discharging cycles. Some of the requirements for a battery separator include: good electronic insulator, minimal electrolyte resistance, mechanical and dimensional stability, chemical resistance to the electrolyte, ability to prevent migration of colloidal or soluble species between the electrodes, readily wetted by electrolyte, and uniformity in thickness and properties (2). Polyolefin separators made from polypropylene (PP), polyethylene (PE), or laminations of PE and PP are often used for lithium ion batteries with organic electrolytes.
Polyolefin separators are made by wet or dry processes all of which result in forming micropores in the film and in the case of uniaxially stretched films, imparting high tensile strength in the machine direction (MD) and relatively weak properties in the transverse direction (TD). Biaxially stretched films made from β-nucleated isotactic PP and the wet process result in films with comparable properties in both directions. The advantages and disadvantages of the processes are extensively discussed in the literature (2) (3) (4).
The purpose for this note is to detail the basic thermal analysis and mechanical techniques used to characterize a typical separator made from PP.
Experimental
Sample – Celgard 2400 polypropylene separator, 60 mm x 10 mm x 25 μm
Discovery TGA 5500
Table 1. TGA Experimental Conditions
| Specifications | |
|---|---|
| Pan | 100 μL Pt |
| Purge | N2 at 25 mL / min |
| Temperature Range | 23 °C to 1000 °C |
| Heating Rate | 10 °C / min |
| Sample Mass | 0.5 mg |
Discovery DSC 2500
Table 2. DSC Experimental Conditions
| Specifications | |
|---|---|
| Pan | Tzero® Aluminum |
| Purge | N2 at 50 mL / min |
| Heating Profile | Heat, Cool, Reheat |
| Heating Range | -50 °C to 235 °C |
| Heating Rate | 10 °C / min |
| Sample Mass | 2 mg nominal |
Discovery TMA 450
Table 3. TMA Experimental Conditions
| Specifications | |
|---|---|
| Probe | Film / Fiber |
| Purge | N2 at 25 mL / min |
| Force | 0.1 N |
| Temperature Range | -70 °C to 160 °C |
| Heating Rate | 3 °C / min |
Discovery DMA 850
Table 4. Tensile Test Experimental Conditions
| Specifications | |
|---|---|
| Clamp | Dual Screw Film Clamp |
| Sample Size | 5 mm x 2 mm x 25 μm |
| Initial Force | 0.001 N |
| Strain Range | 0.1 to 200% |
| Ramp Rate | 5%/min |
Discovery DMA 850
Table 5. DMA Experimental Conditions
| Specifications | |
|---|---|
| Clamp | Dual Screw Film Clamp |
| Sample Size | 15 mm x 5.3 mm x 25 μm |
| Amplitude | 20 µm (0.126 % stain) |
| Frequency | 1Hz |
| Temp Range | -150 to 100 ºC |
| Temp Ramp Rate | 5 ºC/min |
Results and Discussions
Thermogravimetric Analysis
TGA results are shown in Figure 2. Main mass loss is 98.31% with a residue of 1.68% which is the filler. The decomposition point is often taken as the temperature at some arbitrary extent of mass loss – typically less than or equal to 5%. It is important to determine the decomposition temperature for the DSC experiment as thermal transitions above that temperature are indiscernible from decomposition. The temperatures corresponding to various extents of mass loss are shown in Table 6.
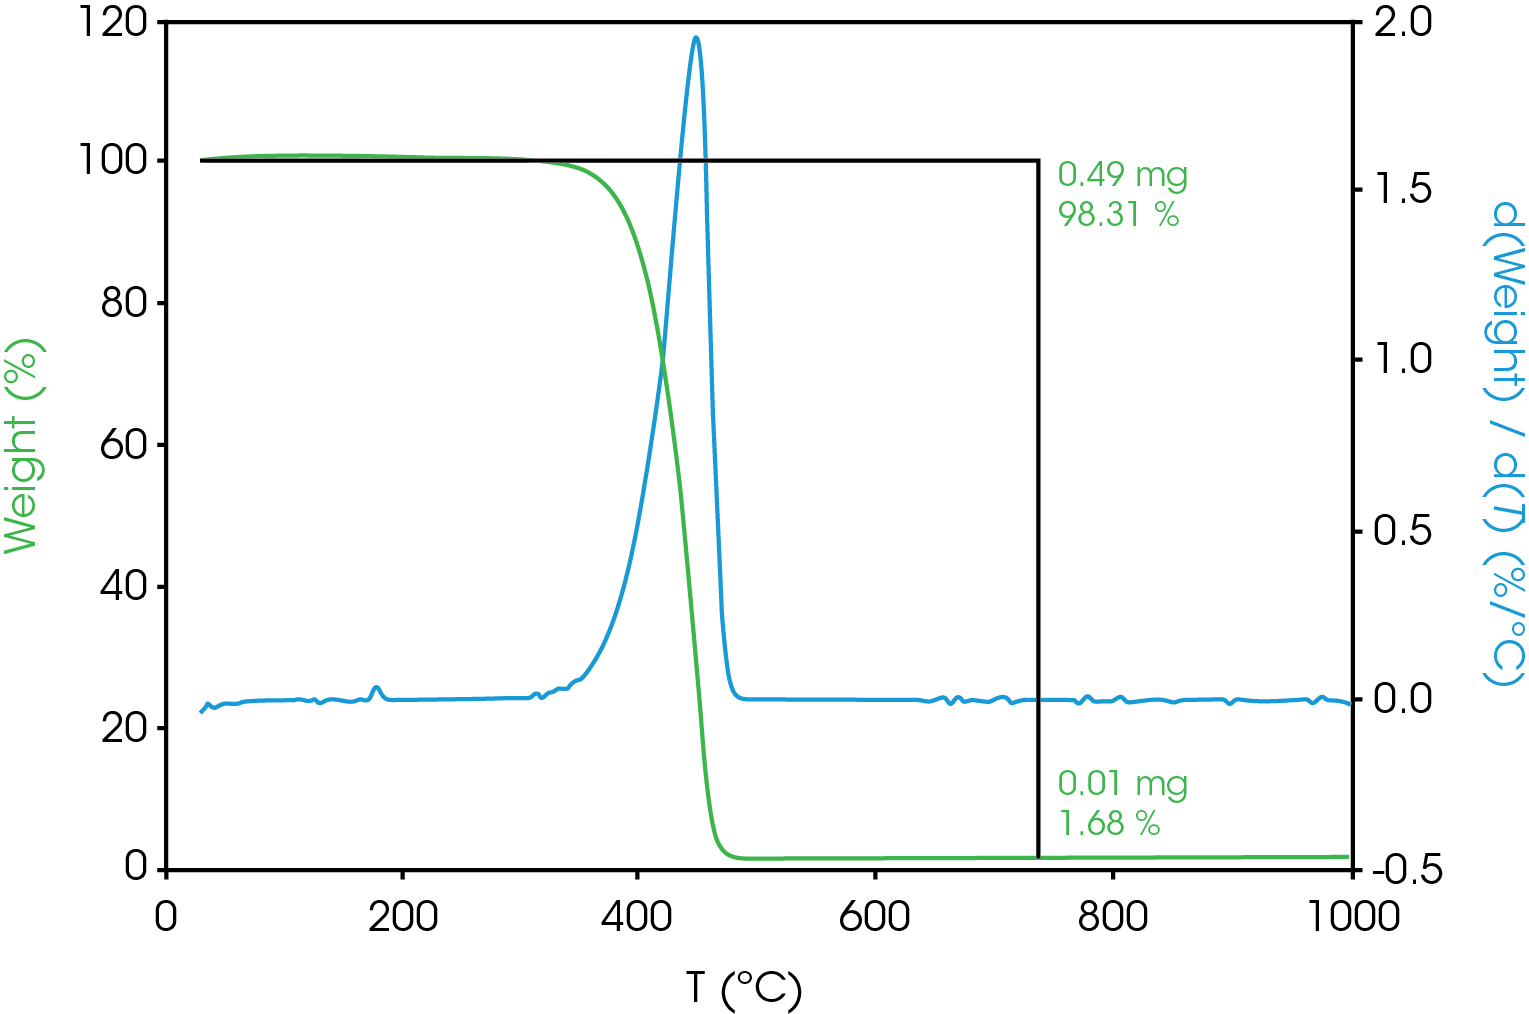
Table 6. Temperature Corresponding to Selected Mass Loss Percentages
| Mass Loss (%) | Temperature (°C) |
|---|---|
| 1 | 347.2 |
| 2 | 360.7 |
| 3 | 368.7 |
| 5 | 379.1 |
| 10 | 394.2 |
| 50 | 437.0 |
Differential Scanning Calorimetry
The DSC transitions are summarized in Table 7.
The relatively high heat of fusion in the first heat Figure 3 may be due to a combination of high isotacticity and change to the polymer chain structure due to machine direction stretching. The heat of fusion drops in the second heat (Figure 5) to a value more typical in a commercial grade polypropylene. The difference in the heat of fusion between the 1st and 2nd heats is 36.0 J/g.
The second heat also shows evidence of β-spherulites which melt at ~ 149 °C. The relative fractions of the melting endotherms were estimated using numerical analysis software (5). The relatively low fraction of β-spherulites (Figure 6, Table 8) likely indicates the resin is sensitive to beta formation dependent on cooling rate and in this case does not contain a beta nucleator. Formation of pores by biaxially stretching beta nucleated isotactic polypropylene is well known (4). The observed glass transitions are typical for polypropylene homopolymer.
Table 7. DSC Transitions for Separator Film
| 1st Heat | Cool | 2nd Heat | |
|---|---|---|---|
| TG (°C) | -2.0 | -1.9 | 2.6 |
| TM (°C) | 165, 168.7 | – | 164.4, 154.4 |
| 173.6 | 148.7 | ||
| ΔHf (J/g) | -137.6 | – | -101.6 |
| TC (°C) | – | 116.6 | – |
| ΔHC (J/g) | – | 108.0 | – |
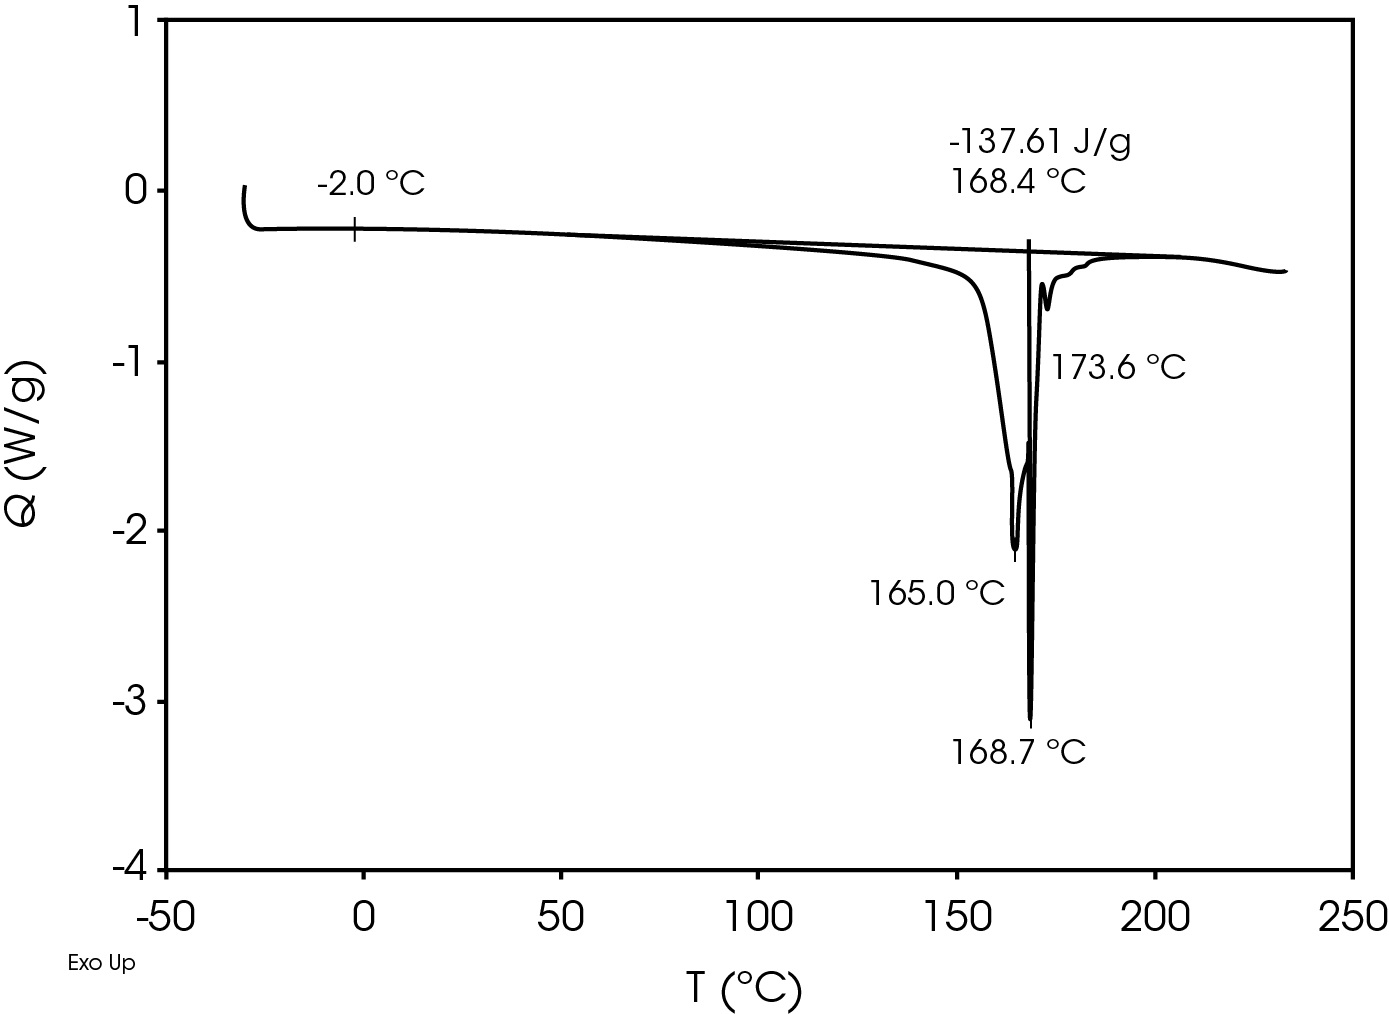
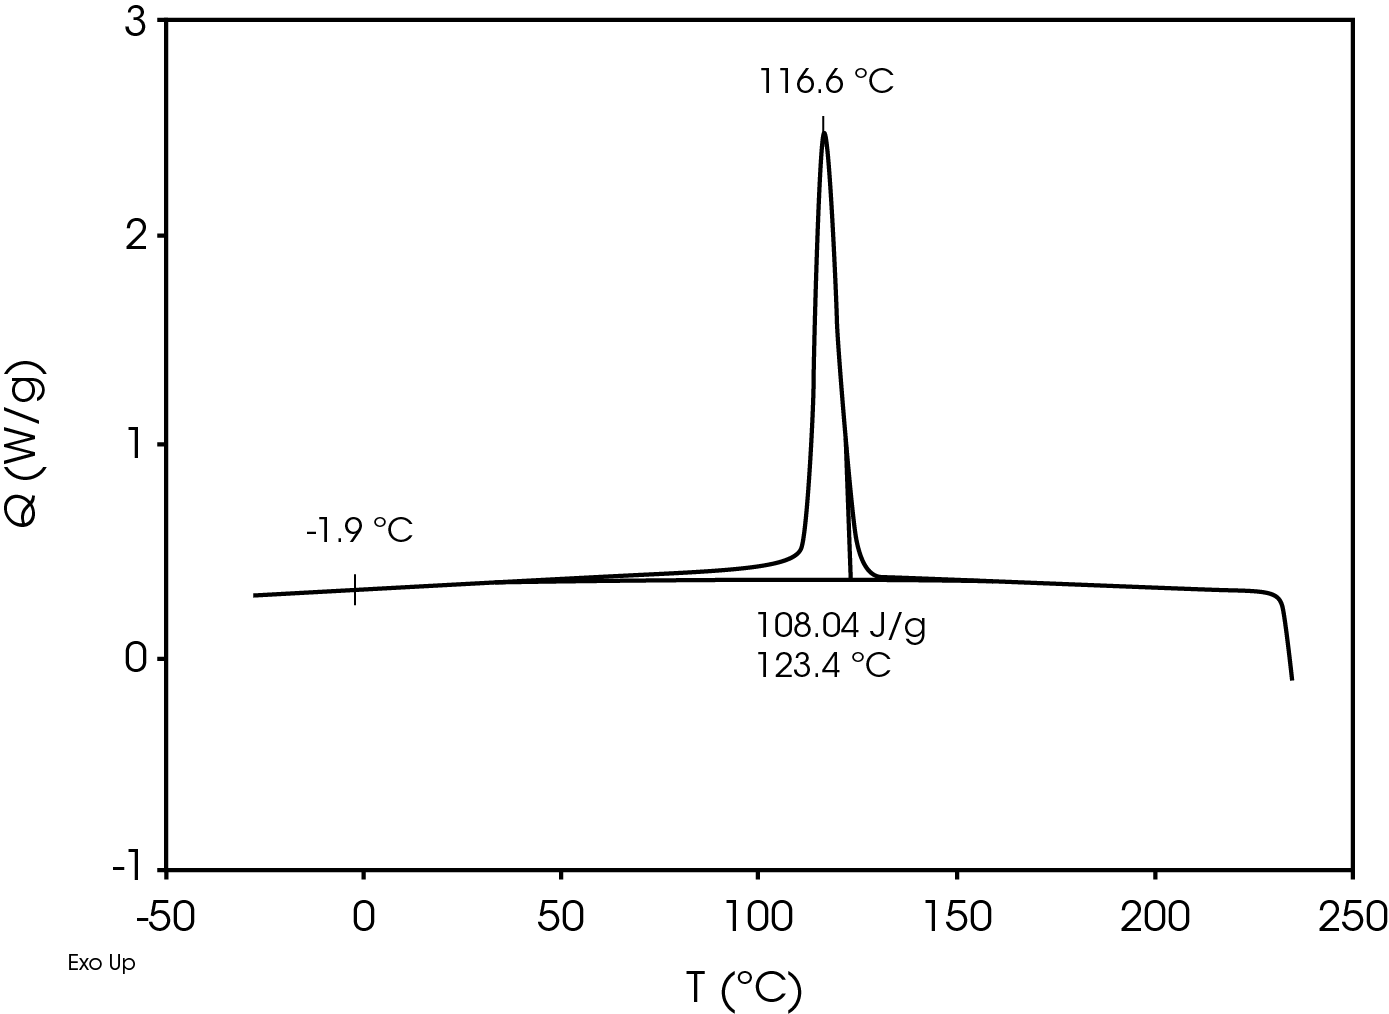
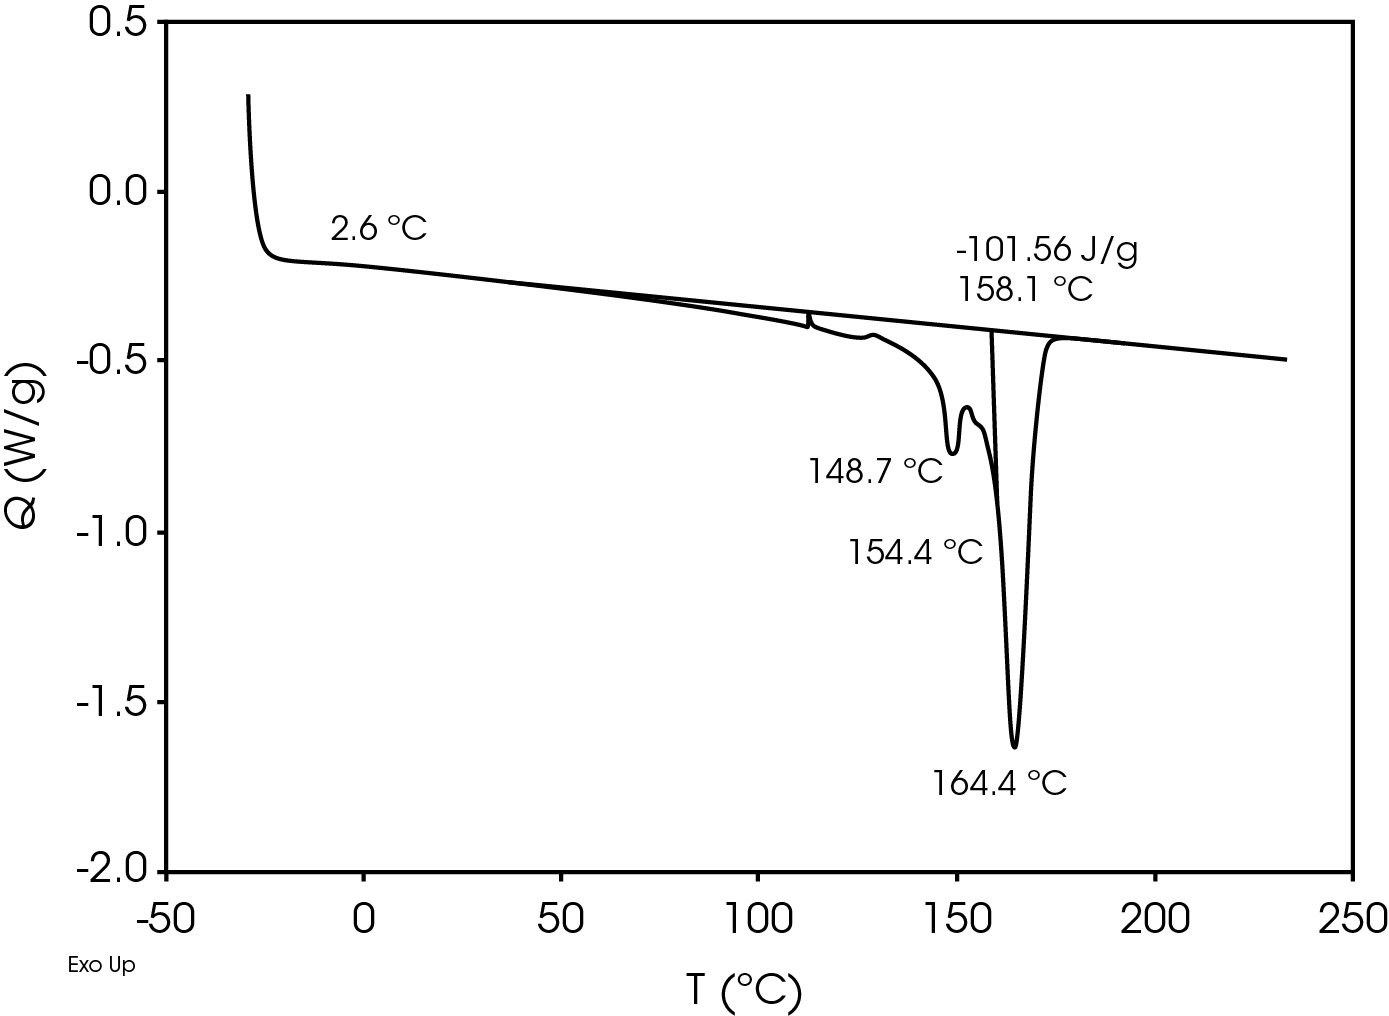
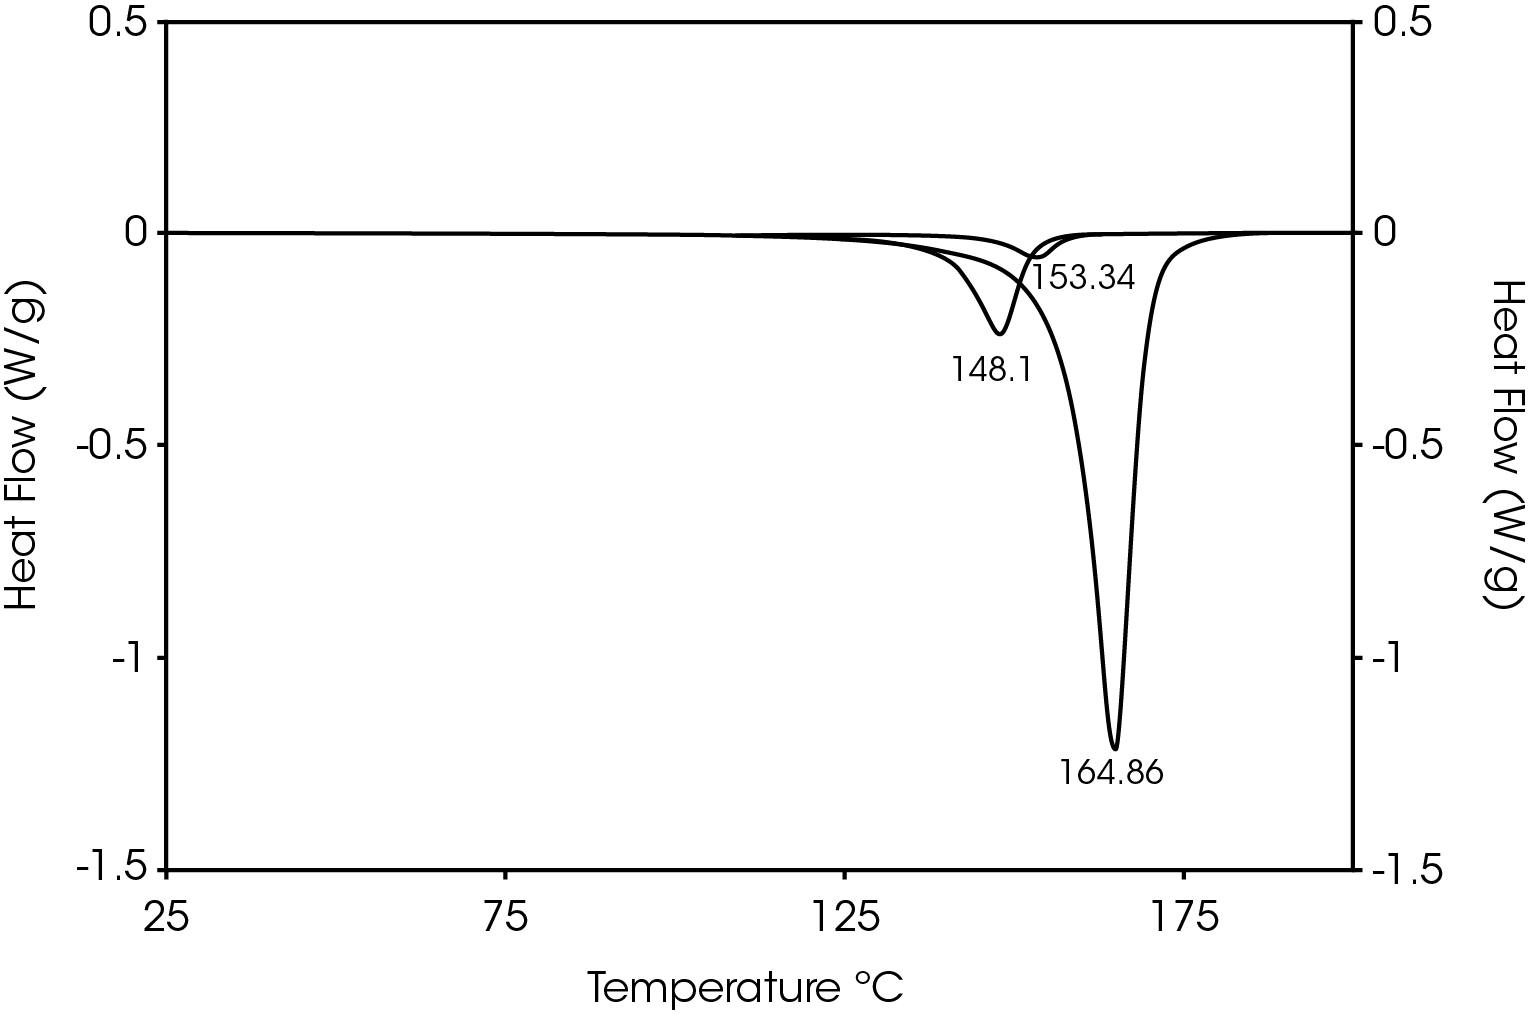
Table 8. Melting Endotherms Fraction
| Peak Temperature (°C) | Fraction (%) |
|---|---|
| 148.1 (β) | 15.7 |
| 153.3 | 3.60 |
| 164.9 (α) | 80.7 |
Thermomechanical Analysis
Figure 7 shows the TMA analysis of the battery separator in the machine direction.
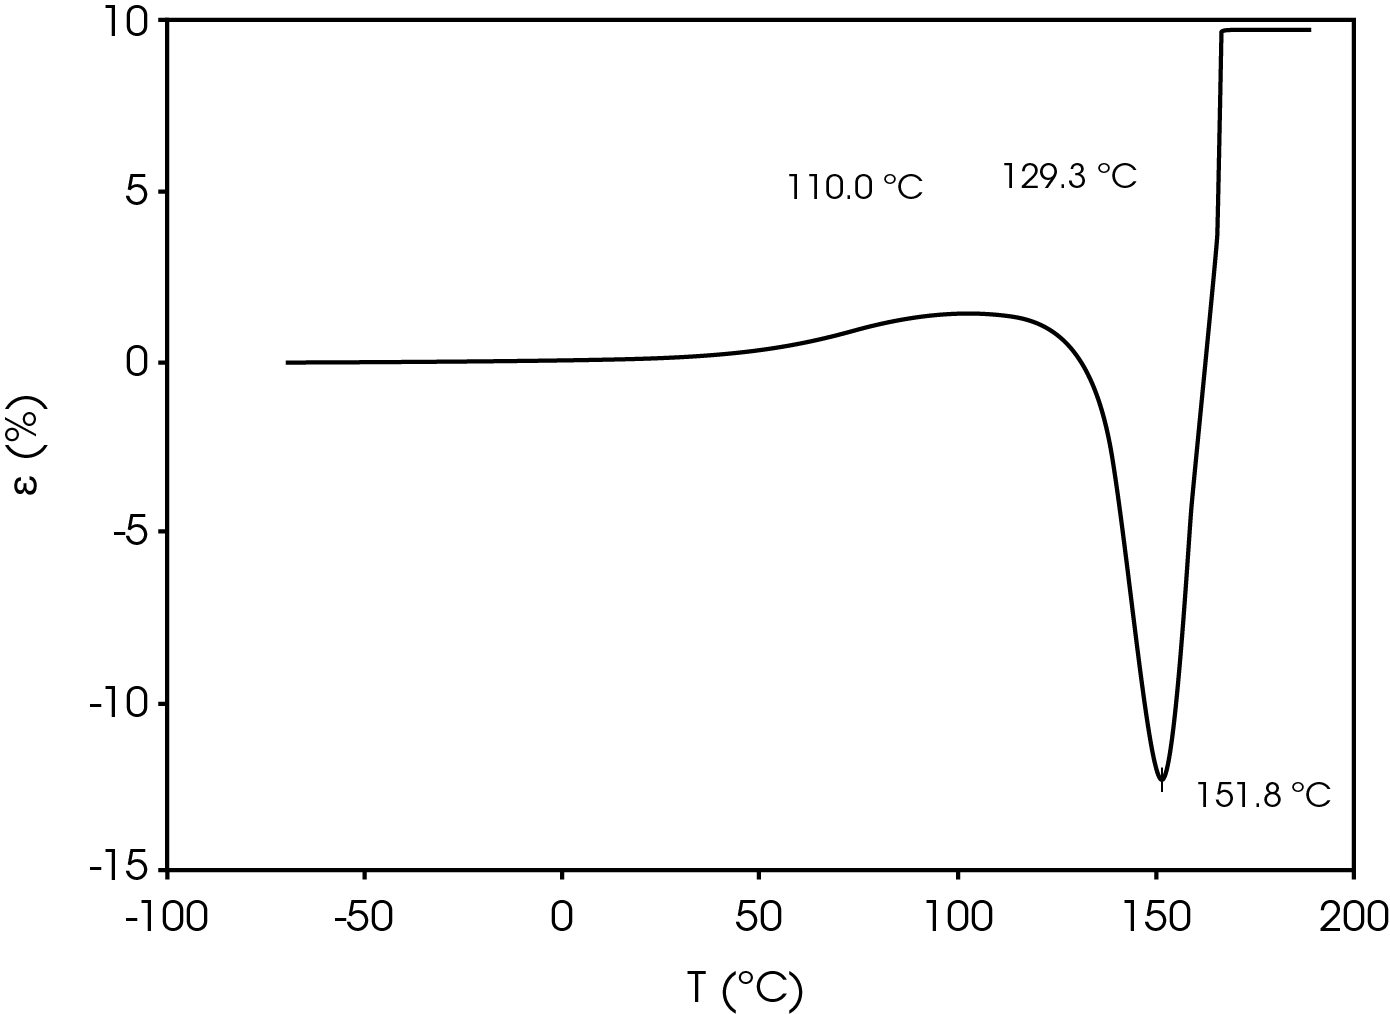
Table 9. Parameters from TMA experiment
| Parameter | Temperature °C |
|---|---|
| Shrinkage Onset Temperature | 110.0 |
| Deformation Temperature | 129.3 |
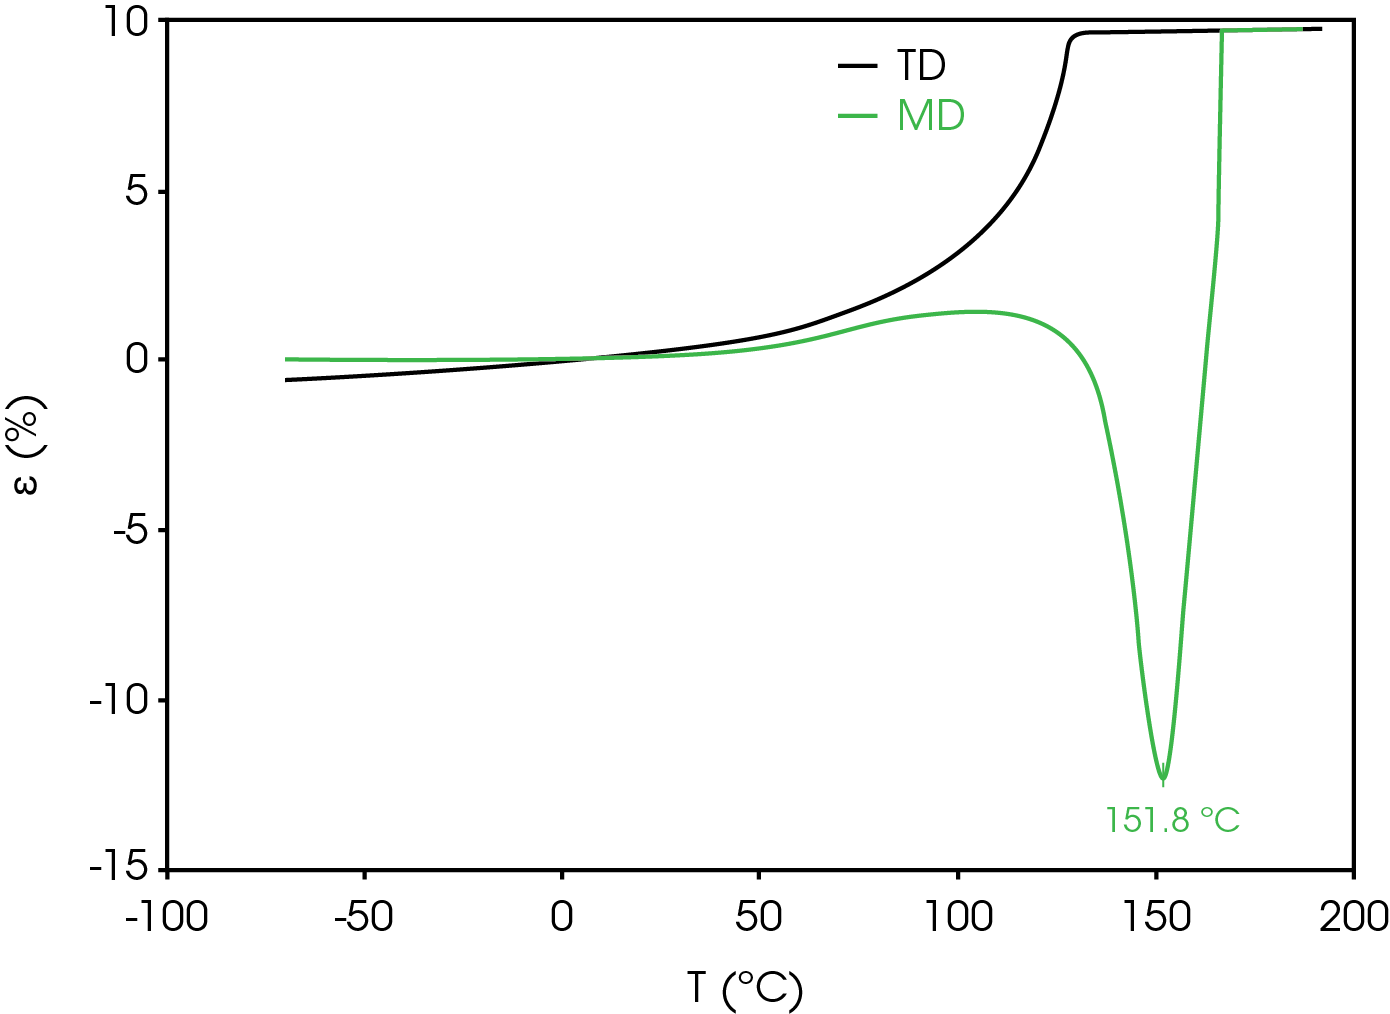
| Rupture Temperature | 151.8 |
The parameters in Table 9 were determined using the guidelines proposed in a NASA document on procedures for evaluating lithium ion battery separators (1). The subjective nature of the guidelines may be mitigated to some degree by examining the derivative of the strain data with respect to temperature (Figure 8). An alternative method to choose the shrinkage onset temperature may be determined by plotting the derivative of strain with respect to temperature and choosing the temperature corresponding to 0% strain in the vicinity where contraction begins using the TRIOS software. The deformation temperature may be determined by using the onset tool in the derivative by extrapolating a tangent line drawn from the lower temperature range to one drawn from the deflection as deformation accelerates as demonstrated in Figure 10. This results in slightly different values obtained in Figure 7 but may improve laboratory precision (Table 10). The rupture temperature is determined as the minimum from the strain percent as function of temperature data shown in Figure 7.
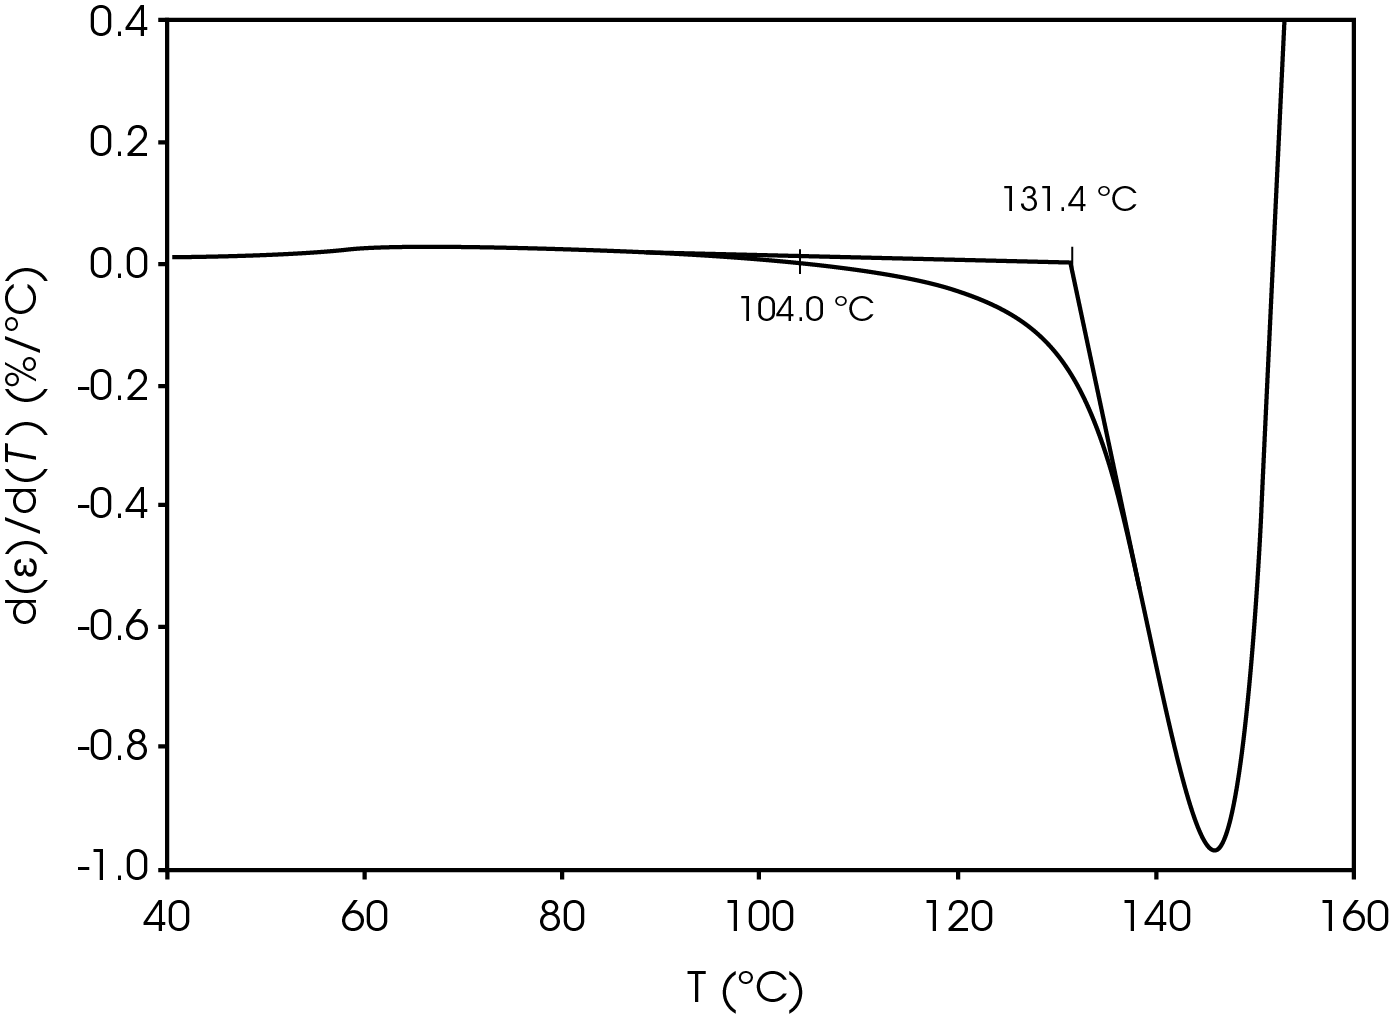

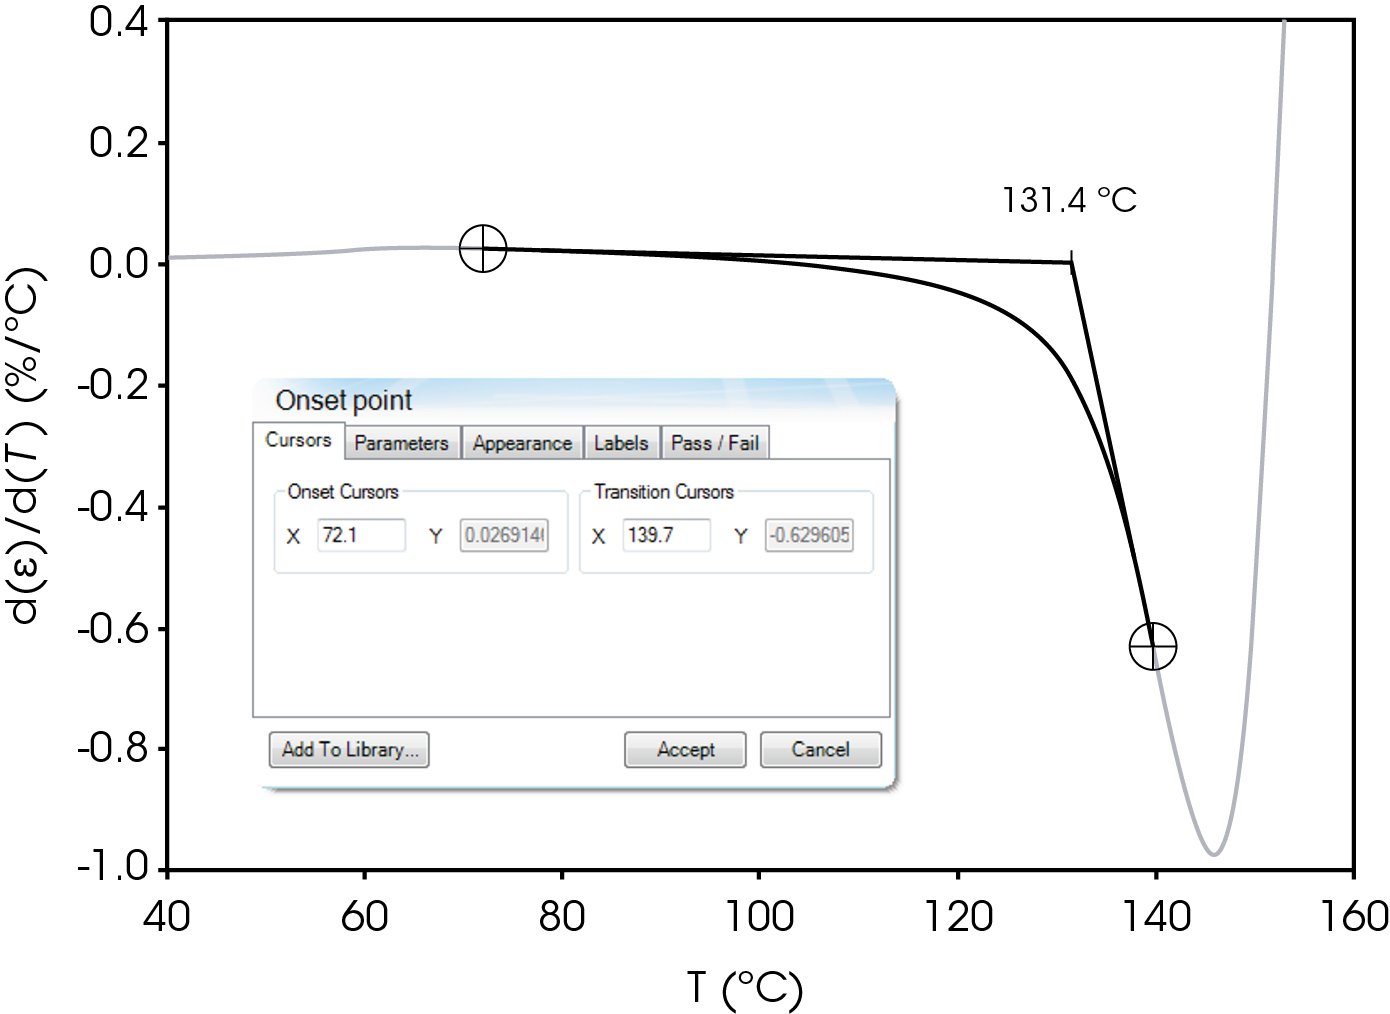
Table 10. Parameters Determined from Alternate Method
| Parameter | Temperature °C |
|---|---|
| Shrinkage Onset Temperature | 104.0 |
| Deformation Temperature | 131.4 |
| Rupture Temperature | 151.8 |
Dimension change in the transverse direction (TD) is also considered as excessive shrinkage can result in a short circuit and thermal runaway. Figure 11 compares the strain percent in the TD and MD. Positive expansion occurs in the TD from ambient temperature to the rupture temperature.
Dynamic Mechanical Analysis
During battery cell manufacturing, separator and electrodes are wound under tension (6). The separator is required to have sufficient tensile strength to not elongate significantly during the winding process. Tensile strength and Young’s modulus are the indicators to predict the mechanical robustness of the separator by evaluating the deformation (yield) point and breakage point. It is important to test in both MD and TD. The MD and TD showed significant difference in the stress-strain curve as shown in Figure 12 and in Table 11. The Ultimate Tensile Strength for MD was measured to be 43 MPa at 18% strain. After this point the material undergoes plastic deformation until rupture at 94.9% strain. This is the material’s elongation at break for the MD. TD shows ultimate strength of 14.9 MPa at 20.9% strain and did not fully rupture at less than the 200% strain end point of the test. Young’s modulus of the MD is 4.8 MPa which is greater than the TD.
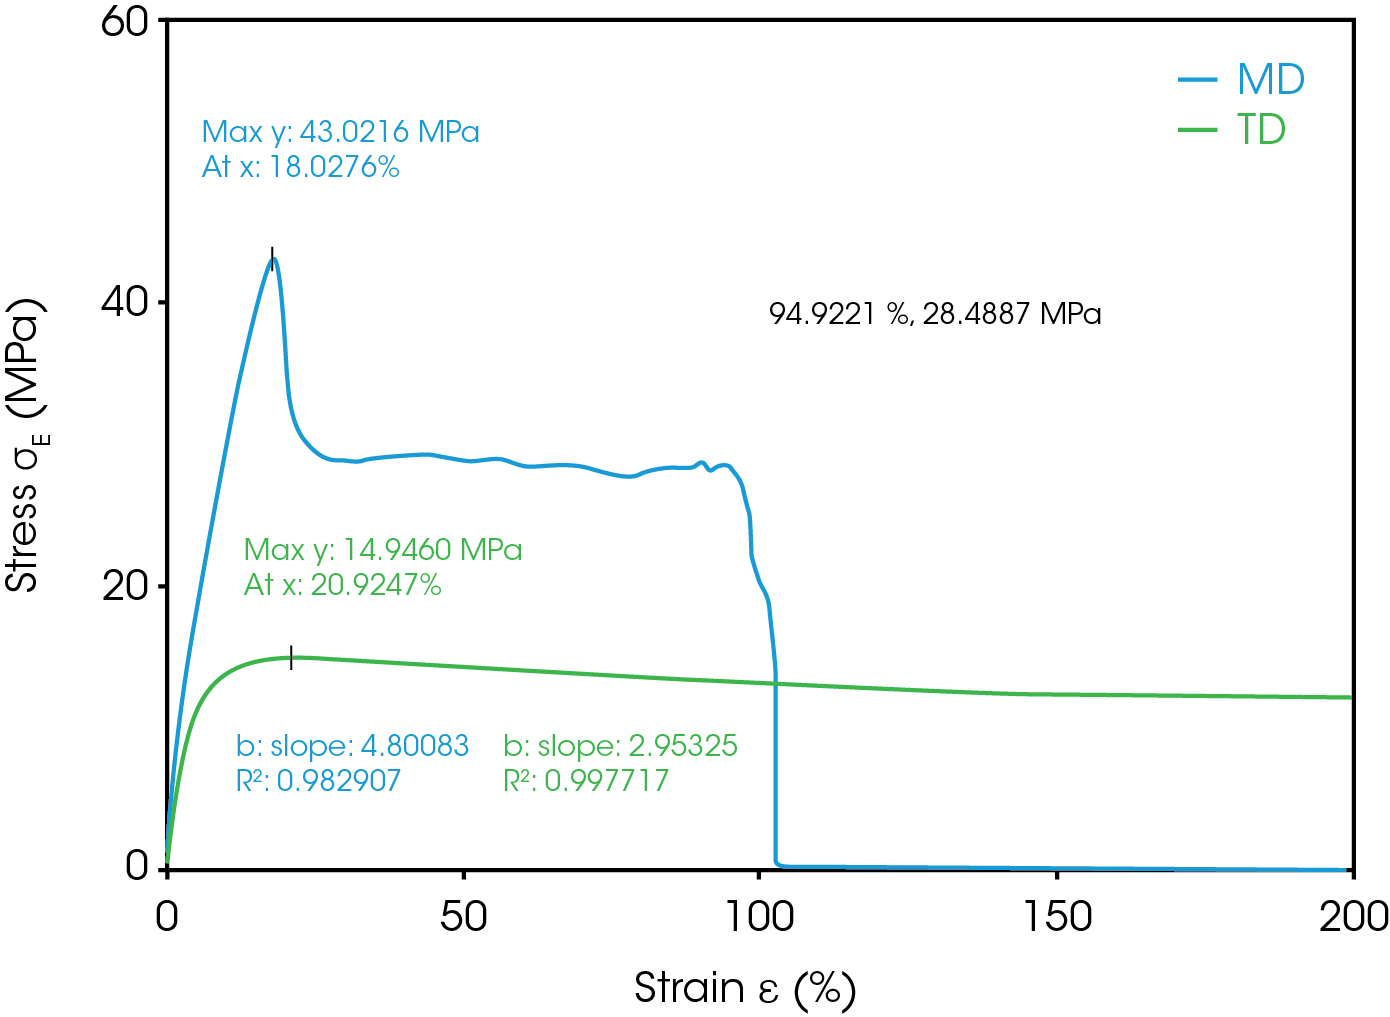
Table 11. Mechanical Properties of Separator in both MD and TD
| Parameter | MD | TD |
|---|---|---|
| Young’s Modulus (MPa) | 4.80 | 2.95 |
| Ultimate Tensile strength (MPa) | 43.0 | 14.9 |
| Ultimate Tensile Strain (%) | 18.0 | 20.9 |
| Elongation at Break (%) | 94.9 | >200 |
One of the most common uses of DMA is to determine viscoelastic properties of materials. This is accomplished by applying an oscillatory force or stress (σ) and measuring the displacement or strain (ε). For purely elastic solids (Hookean solid), the strain is in perfect phase or the phase angle delta (δ) is zero. For a purely viscous fluid (Newtonian liquid) δ = 90°. Viscoelastic polymers will have phase angles somewhere in between. In simplistic terms, modulus (E*) describes a materials resistance to deformation, and can be resolved into storage modulus (E’) which is the elastic component or stored energy, and loss modulus (E”) which is the fluid component and dissipated as heat. In mathematical terms they expressed as:
E*=σ/ε (Complex Modulus)
E’=E* cosδ (Storage Modulus)
E”=E* sinδ (Loss Modulus) tanδ=E”/E’
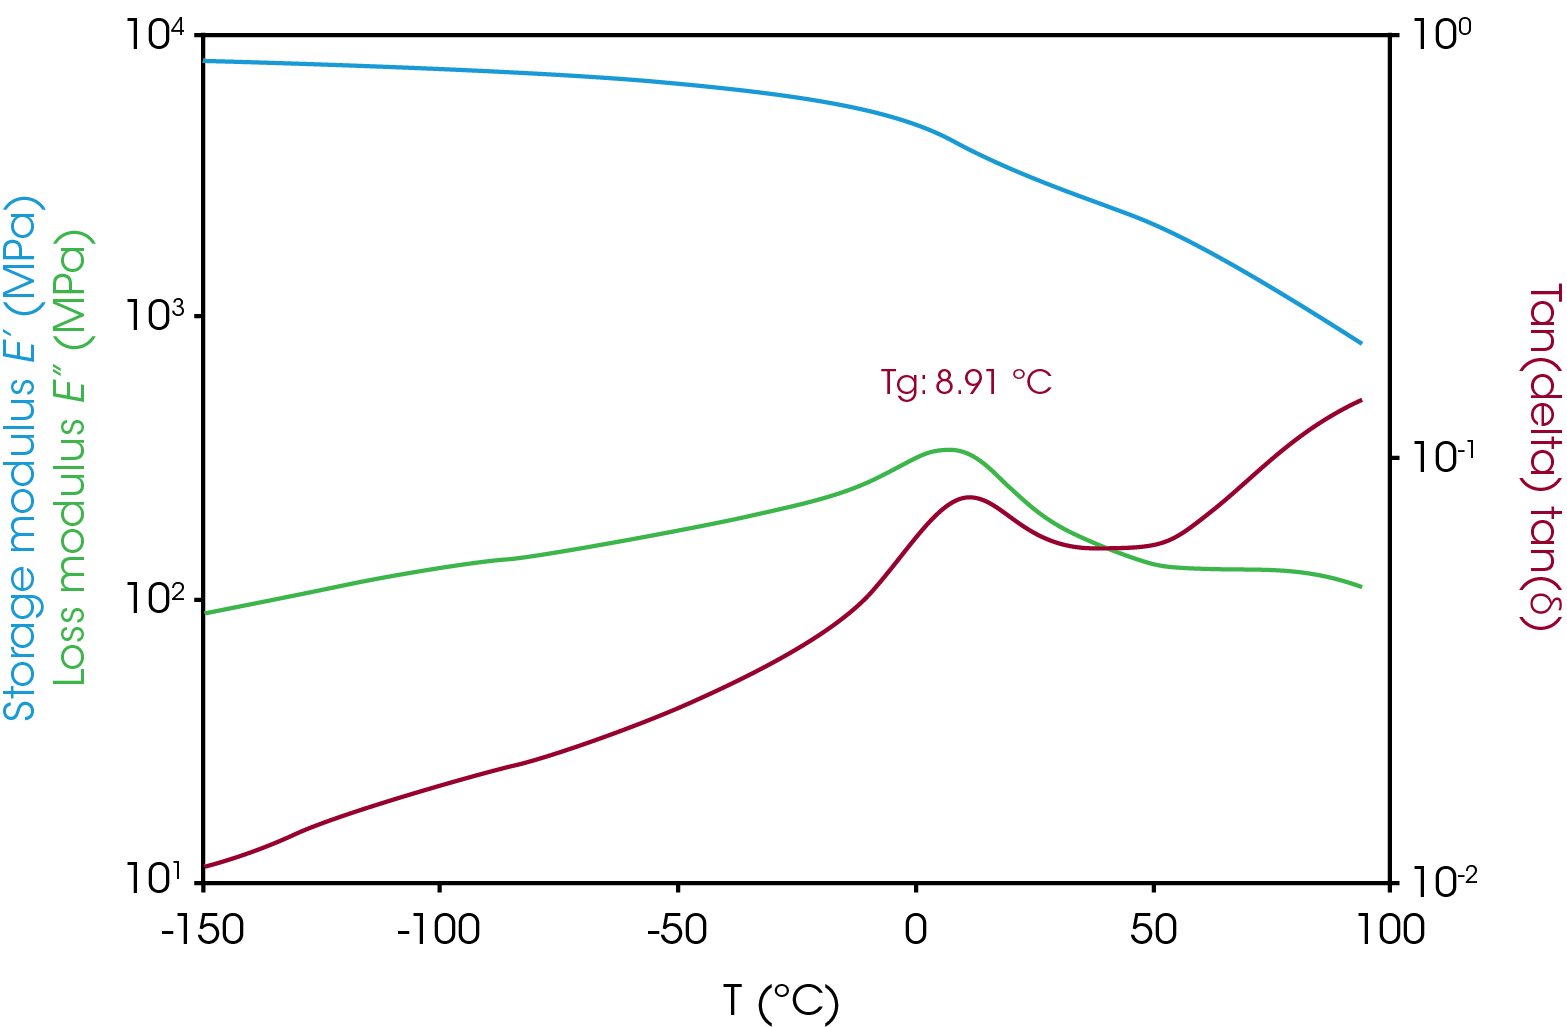
An important parameter determined in a DMA viscoelastic experiment is the glass transition temperature (TG) above which the material will be less rigid and behave more rubbery and below which will be more rigid. The glass transition is often reported as the peak of the loss modulus or the peak of tan delta and can vary based on the technique used to measure it, so the method of determining the TG should be reported. The glass transition in the separator film is 8.9 °C (peak of tan delta) as shown in Figure 13. The number of and temperature of the glass transition(s) can also yield valuable information regarding polymer type for example, homopolymer or copolymer (random or block) or physical blend particularly in the case of polypropylene.
Conclusions
The role of thermal analysis is well documented in the safety aspect of lithium ion batteries in assessing the stability of the electrodes and electrolytes and determining potential thermal runaway. In this application note, evaluation of the porous separator film, one of the key components of the battery regarding operation and safety, was performed.
TGA is used to determine stability at various temperatures and can be expanded to include advanced kinetic techniques to estimate lifetime as a function of temperature.
DSC yields important information about thermal transitions including the glass transition, heats of fusion and crystallization, and melting and crystallization temperatures.
TMA is used to determine expansion as function of temperature in both the MD and TD. In the case of our sample which is a uniaxially stretched film, shrinkage in the MD is part of the safety engineering in which the pores collapse, stopping ionic transport effectively shutting down the battery and preventing thermal runaway. Evaluation of dimension change in the TD is also important as excessive shrinkage could lead to electrode contact and short circuit. Following a protocol established by NASA, the shrinkage onset temperature, deformation temperature, and rupture temperature were determined. An alternative to determining the shrinkage onset and deformation temperatures was proposed in this note which may mitigate the subjective nature of the test and improve precision.
DMA determines the mechanical properties of the separator which is important to maintain mechanical integrity across battery operating conditions without excessive deformation or mechanical failure.
TA Instruments / Waters offer complete thermal analysis solutions for battery components with the Discovery® suite of instruments. Data analysis and reporting is done through our single powerful, intuitive software package TRIOS®.
References
- R Baldwin, W Bennet, E Wong, M Lewton, M. Harris. Battery Separator Characterization and Evaluation Procedures for NASA’s Advanced Lithium Ion Batteries. Glenn Research Center. Cleveland : NASA, 2010.
- Battery Separators. P Arora, Z Zhang. 10, s.l. : American Chemical Society, 2004, Chem Review, Vol. 104, pp. 4419-4462.
- Manufacturing Process of Microporous Polyolefins Separators for Lithium-Ion Batteries and Correlations Between Mechanical and Physical Properties. Mun, Sung Cik. 1013,s. l. : MDPI, August 22, 2021, Crystals, Vol. 11.
- Pore Formation and Evolution Mechanism During Biaxial Stretching of Beta-iPP Used for Lithium Ion Battery Separator. Ding, L. 2019, Materials and Design, Vol. 179.
- Browne, J. TA431 – Deconvolution of Thermal Analysis Data Using Commonly Cited Mathematical Models. TA Instruments. 2020. Applicatons Note.
- A review of advanced separators for rechargeable batteries. Luo, Wei, et al. s.l. : Journal of Power Sources, 2021, Vol. 509. 230372.
- Safety Assessment of Polyolefin and Nonwoven Separators Used in Lithium-Ion Batteries. E Wang, C Ciu, P Chou. s.l. : Elsevier, March 24, 2020, Journal of Power Sources, Vol. 461.
- The Role of Separators in Lithium-Ion Cell Safety. Orendorff,C. 2012. Electrochemical Society Interface . Vol. 21 61.
Acknowledgement
This paper was written by James Browne, Senior Scientist at TA Instruments and Hang Lau, New Market Development Scientific Lead at TA Instruments.
Click here to download the printable version of this application note.

