Keywords: Rheology, Battery, Battery slurry, particle size, particle shape, viscosity, viscoelasticity, thixotropy, yield
RH119
Abstract
Battery slurry processing is one of the key steps in battery manufacturing that can significantly influence battery performance. The slurry suspension includes multiple components such as active cathode/anode materials, binder and additives etc. mixed in solvent. Differences in slurry formulation can have a big impact on a slurry’s stability and flowability. This application note discusses how to use rheology to evaluate the influence of graphite particle size and particle shape on the rheological behavior of a battery slurry. A TA Instruments rotational rheometer was used for the rheological analysis. The measurement results provide quantitative differentiation between two slurry samples with different types of graphite on their viscoelasticity, yield stress, and thixotropic behaviors. The difference in flow viscosities over a wide range of shear rates is also discussed in detail.
Introduction
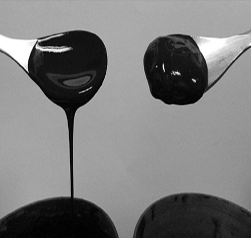
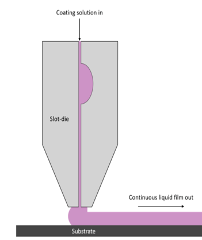
Electrode quality directly contributes to energy density and electrochemical performance in Lithium-ion batteries. Optimizing electrode processing is essential for obtaining high quality electrodes and reducing cost (1), (2). Electrode manufacturing is a highly complex process that involves mixing the cathode or anode active materials, binder/additive and solvent into slurry, followed by coating the slurry on the metal collector, then finally drying to remove solvent and calendaring the electrode (3). Slurry rheology is important for optimizing the coating process and ultimately the quality of the electrode, and thus the performance of the battery.
The formulation and the manufacturing process of slurry suspensions have a substantial influence on their stability and flow behavior. Therefore, slurry production will greatly impact applications such as die slot, doctor blade, comma bar reel to reel coating (3). Rheology provides a powerful technique for analyzing the viscosity and viscoelasticity performance of battery slurries. In this application note, a TA Instruments Discovery HR-30 model rheometer is used for measuring two battery slurries with the same formulation but different types of graphite: natural graphite and synthetic graphite. Natural graphite traditionally has been used to reduce the cost compared to synthetic graphite (4). The measurement results provide helpful guidance for slurry manufacturing and material selection.
Application Benefits
- A slurry’s rheological properties are critically important when studying stability and processability for electrode manufacturing.
- A TA Instruments Discovery HR-30 rheometer provides guidance in slurry processing during battery electrode manufacturing by delivering a sensitive evaluation of the viscosity and viscoelasticity of battery electrode slurries
- Rheology can sensitively differentiate the difference between natural and synthetic graphite formulations, which contain different particle sizes and shapes.
- The dynamic frequency sweep test measures sample moduli (G’, G”) and complex viscosity, and helps to compare sample viscoelasticity and network structure.
- Thixotropy analysis measures the shear thinning properties of the slurries and also quantifies the sample structure recovery.
- The flow test can measure samples’ yield stress. It also provides the viscosity information of the slurry over a wide range of shear rates.
Experimental Setup
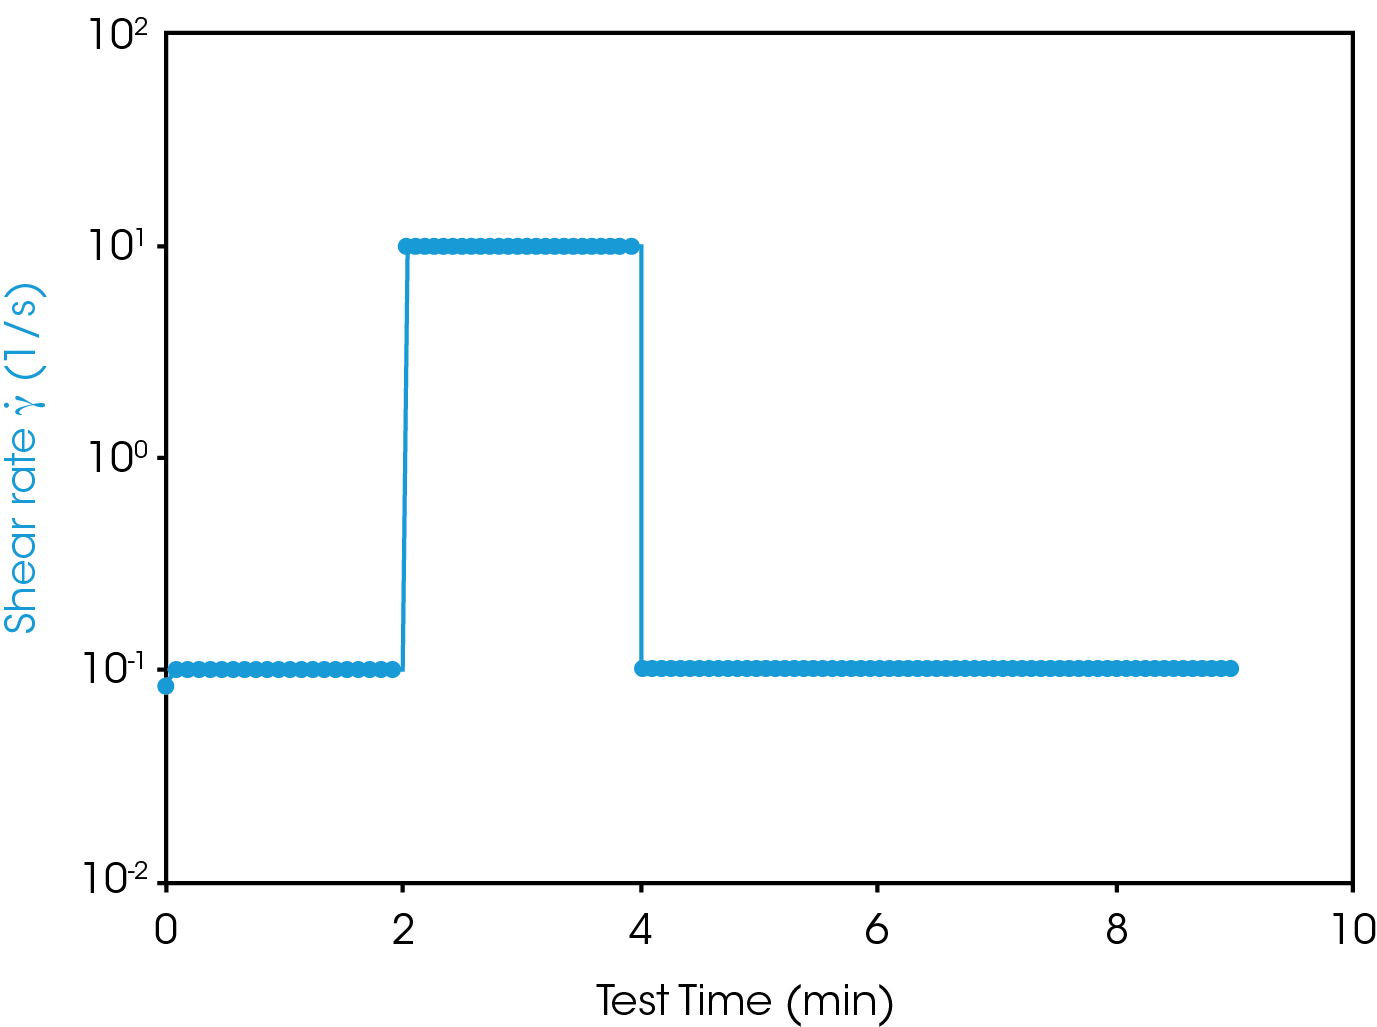
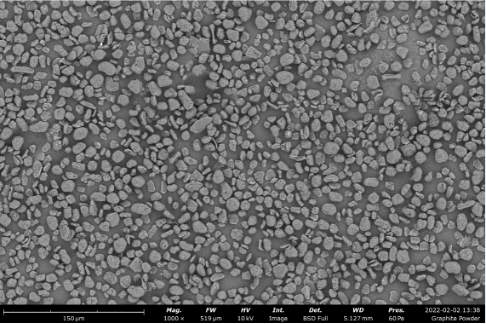
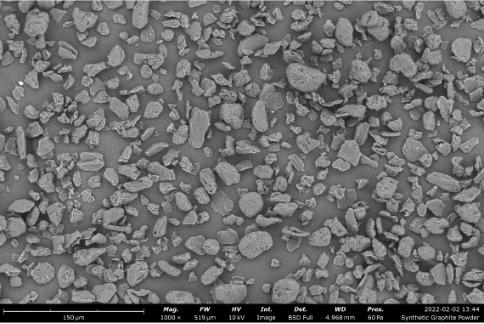
Two battery slurry samples were kindly provided by NEI Corporation. These two samples had the exact same formulation but used different types of graphite: Natural vs. Synthetic. A Scanning Electron Microscopy (SEM) analysis was conducted using a Phenom XL SEM from ThermoFisher Scientific. The SEM images demonstrated the differences in particle size and shape between these two types of graphite. The rheological measurements were performed using a TA Instruments Discovery HR-30 rheometer with the advanced Peltier temperature control system. A 40mm hard anodized aluminum parallel plate geometry was used with a testing gap set at 500 μm. Both slurry samples were sonicated for 15 minutes, and then vortex mixed thoroughly before conducting any rheological measurements. The viscoelastic properties of the slurries were measured using a dynamic frequency sweep procedure. The frequency range was set from 0.1-100 rad/s using a small oscillation amplitude, which is within the linear region of the sample. The yield stress of these two slurries was monitored using a shear rate step down method. The testing shear rate was decreased from 10 1/s to below 0.001 1/s, and the changes of the sample viscosity and shear stress were recorded during the measurements. The thixotropy and thixotropic recovery properties of the slurries were evaluated using a three-step flow procedure, which is demonstrated in figure 1. In the first step, the sample was sheared at a low shear rate of 0.1 1/s. Then the shear rate was increased to 10 1/s in the second step. The changes of the viscosity were recorded. In the third step, the shear rate decreased back to 0.1 1/s. The recovery of sample viscosity was monitored as a function of time.
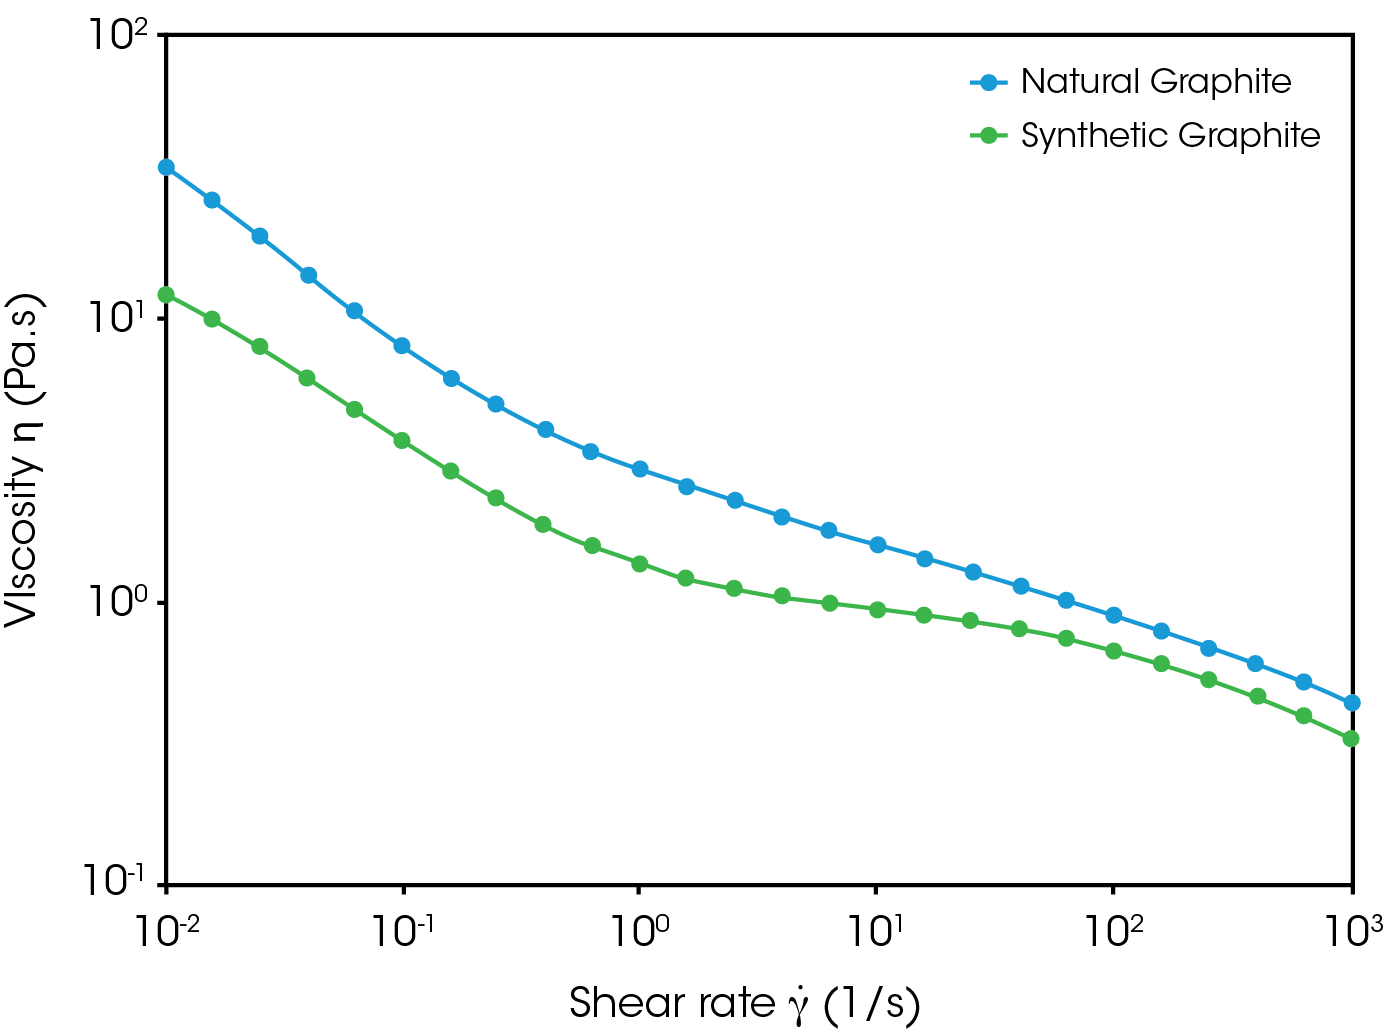
Finally, a steady state flow test procedure was used to evaluate and compare the flow behavior of these two slurry samples. The measurement shear rate was programmed from 0.01 to 1000 1/s, which included the shear rate conditions required in slot coating applications.
Results and Discussion
Figure 2 shows the images of natural and synthetic graphite that were used in the slurry formulations. The images clearly illustrate that the average size of natural graphite particle is smaller than the synthetic graphite. Also, the natural graphite particles show more uniform size distribution, and the particle shape seems round and regular. The synthetic graphite particles are larger and also show more irregular shapes with wider size distribution. In slurry formulation, these differences in graphite particles lead to obvious differences in their rheological behavior, which are discussed in the following sections.
Viscoelasticity
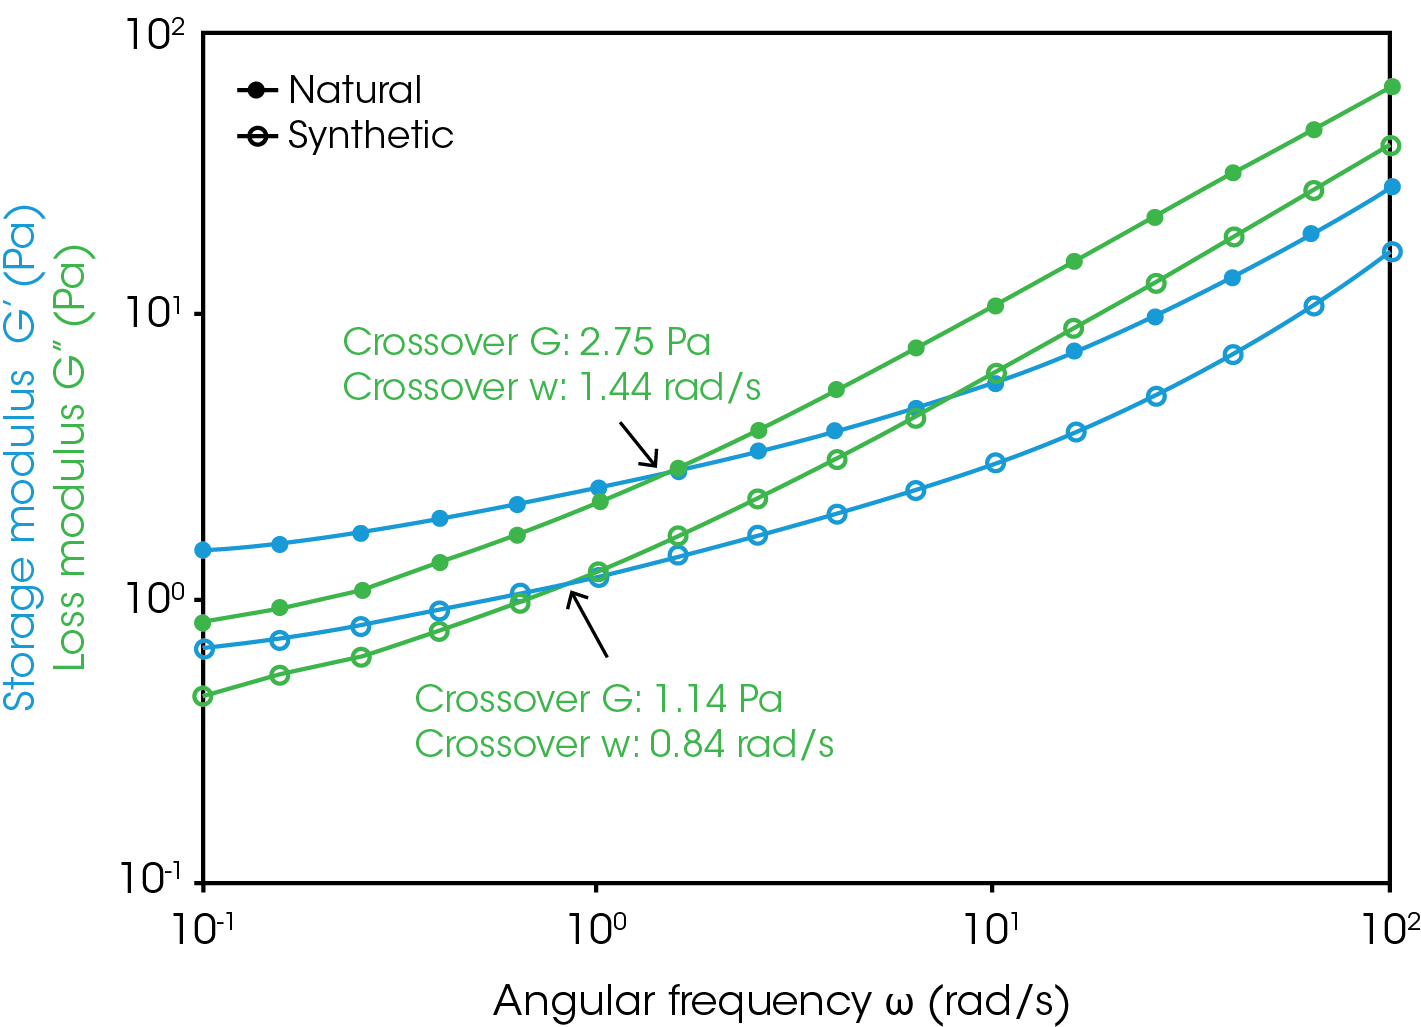
The viscoelastic properties of the slurries were measured using a dynamic frequency sweep test. Results are shown in figure 3. In a frequency sweep measurement, when G” is observed greater than G’, it means that the sample behaves mostly liquid-like with less structure. When G’ is observed greater than G”, it means that the sample is solid gel-like with stronger and more stable structure.
From both frequency sweep test results, one can observe a G’/G” crossover within the measurement frequency range. At high frequencies, G” is greater than G’, which means both samples behave more liquid-like. While at low frequencies, both samples behave more gel-like. The G crossover frequency for the synthetic graphite slurry appears at 0.84 rad/s, which is lower compared to the G crossover observed in the natural graphite slurry (i.e. 1.44 rad/s). The G’ curves for both samples turn to reach a plateau at lower frequencies, indicating that the sample started to form a weak structure network. The G’ plateau of the synthetic graphite slurry is lower compared to the natural graphite slurry, which means it exhibits a weaker structure. This is also proved from the yield stress analysis in the following test.
Yield Stress
A yield stress in rheology is defined as the applied stress at which irreversible plastic deformation is first observed across the sample. In theory, yield stress is the minimum stress required to initiate a flow. Yield analysis is important for all complex structured fluids. It helps to better understand product performance such as shelf life and stability against sedimentation or phase separation.
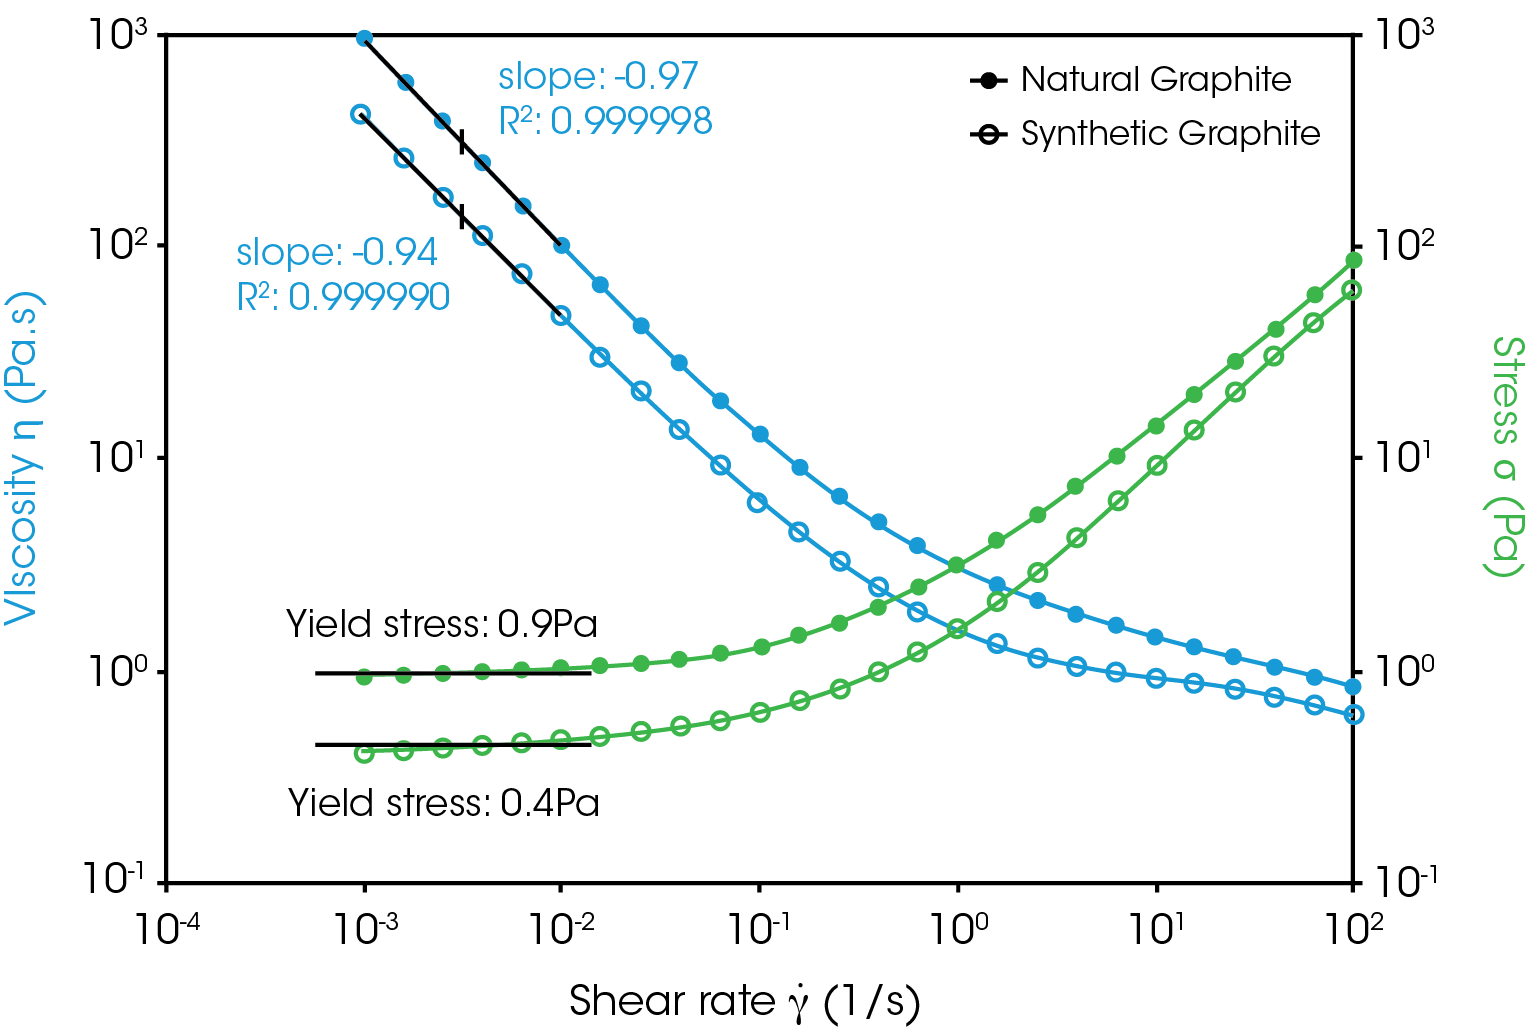
There are multiple rheological methods, which can be used to determine yield stress (5). In this study, the yield stress analysis was conducted using a shear flow ramp down method (results shown in figure 4). From the test results, one can see that under moderate shear rates, the shear stress decreases with decreasing shear rate. But when the shear rate reduces further, the stress curve turns to reach to a plateau and becomes independent of rate. This plateau stress value is described as the yield point. Concomitantly, the measured “apparent viscosity” curve goes to infinite with a straight line versus shear rate at slope of -1.
Since the synthetic graphite has a larger particle size and more irregular particle shape in formulation, the slurry exhibits a lower yield and weaker network structure. Hence, this synthetic graphite slurry sample will more easily undergo settling and phase separation. Slurry settling will lead to inhomogeneous distribution of active materials on the electrode and thus reduce battery performance (1).
Thixotropy and Thixotropic Recovery
Thixotropy is a time-dependent shear thinning phenomenon (6). The thixotropic properties of these two slurry samples were analyzed using a three-step flow method (Figure 5). The thixotropic index, which is also called the shear thinning index, is defined as the ratio of the viscosity measured between the low shear (step #1, 0.1 1/s) and high shear (step #2, 10 1/s). The higher the ratio, the more shear thinning this sample is. The third flow step is designed to monitor the sample structure recovery over time. In the third step, the sample was sheared at a low rate (i.e. 0.1 1/s), and the viscosity change is measured as a function of time. In general, the thixotropic recovery is described as the time when sample viscosity recovers back to a certain percentage (e.g. 50% or 80%) of the initial viscosity in the first step.
The thixotropy of the slurry has great impact on the coating and drying of the electrode and thus the electrode quality (7). The comparison of the thixotropic properties between these two battery slurries is summarized in table 1. Within the shear rate range defined in the test, the slurry sample with the natural graphite is more shear thinning compared to the slurry sample containing synthetic graphite. Also, the recovery time for the synthetic graphite slurry is longer than the recovery time for the natural graphite sample. This thixotropic recovery analysis helps to predict sample stability. After shear, if the sample requires longer time to recover its structure/viscosity, then this sample potentially should more easily undergo phase separation, precipitation or settling.
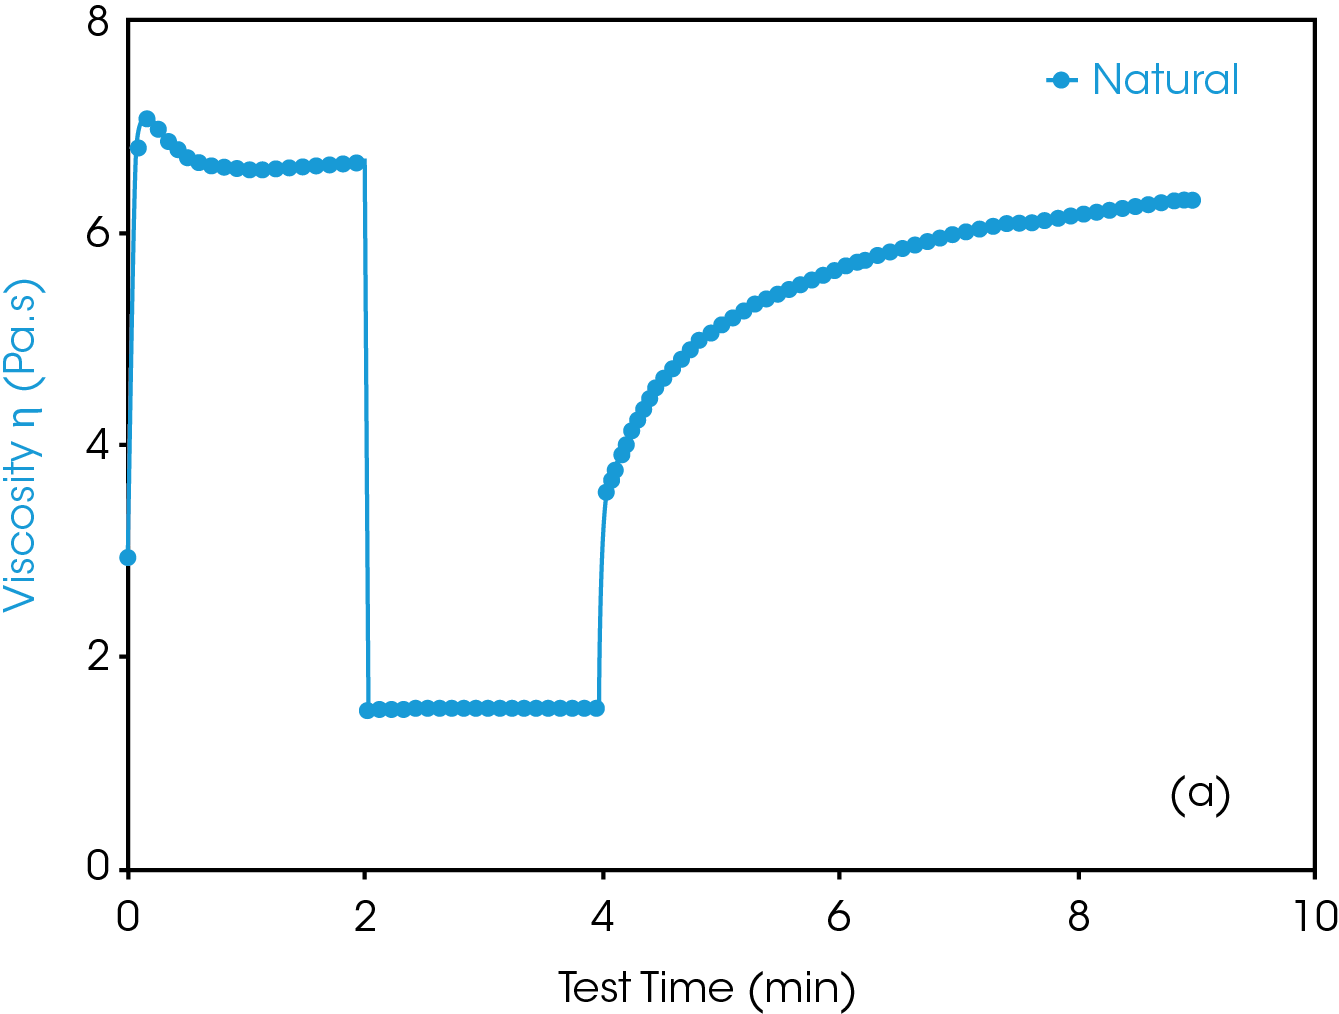
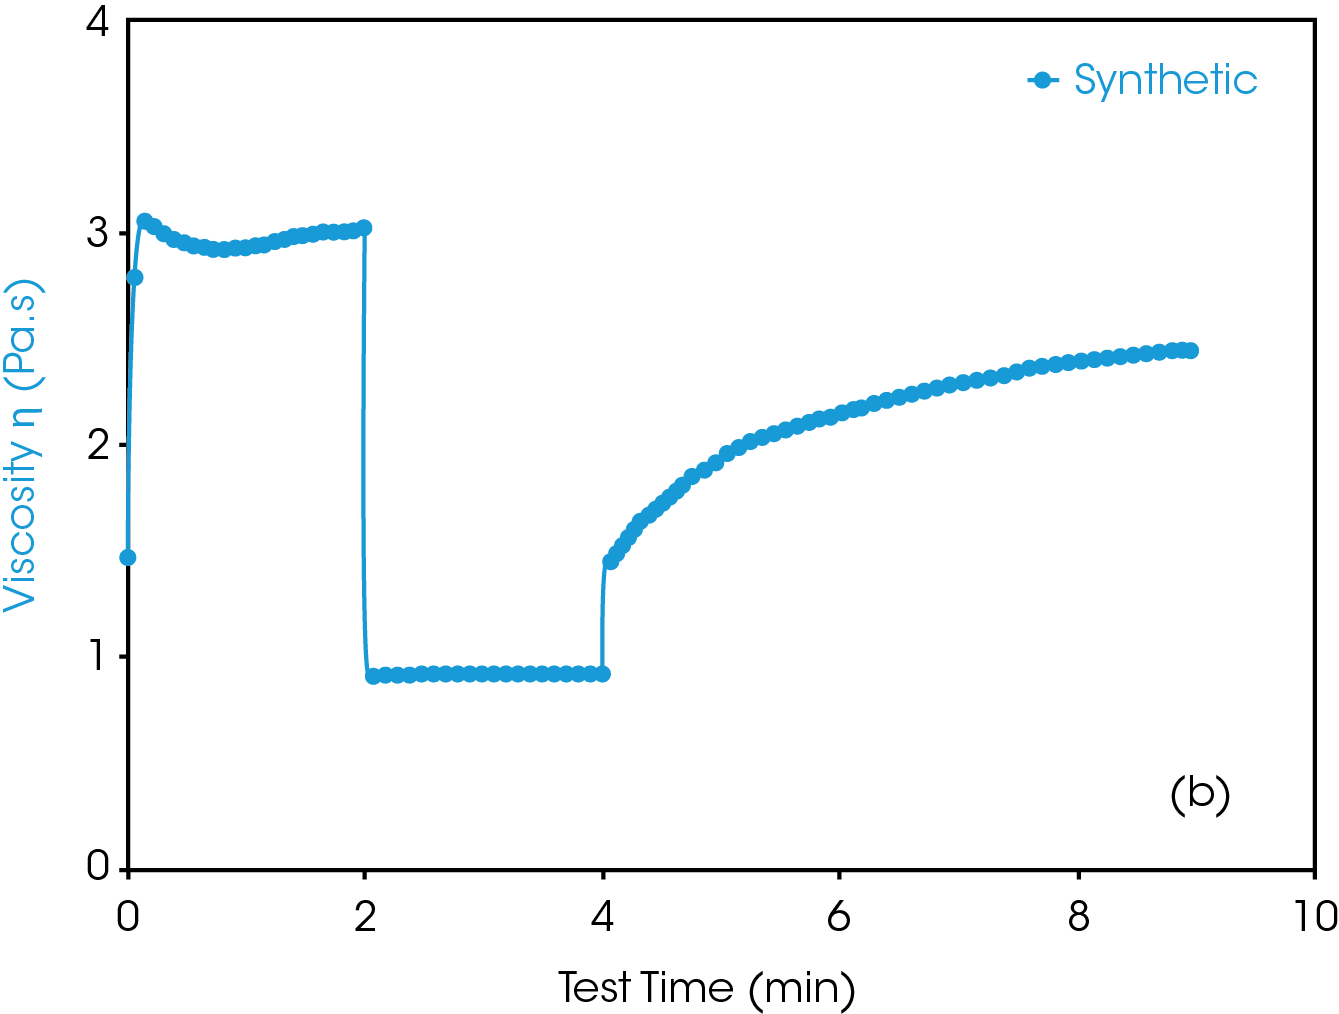
Table 1 Summary of thixotropic index and thixotropic recovery on the 2 battery slurries with different type of graphite
| Natural Graphite | Synthetic Graphite | |
| Thixotropic Index | 4.4 | 3.3 |
| Thixotropic recovery time at 80% (min) | 1.2 | 4.1 |
Flow Behavior
The flow viscosity measurement over a wide range of shear rate is important to study the stability and processability of the electrode slurry. A good formulation should have a lower high-shear rate viscosity, which ensures an easy and homogeneous coating on the collector; while remaining higher low-shear rate viscosity to ensure slurry stability (1). Figure 6 compared the viscosity differences of these two battery slurries over a wide shear rate range (i.e. 0.01 1/s to 1000 1/s). The results show that the slurry containing synthetic graphite, which has slightly larger particle size and irregular shape, has a lower shear viscosity compared to the slurry containing natural graphite, which has smaller particle size and more regular round shape. Under low shear rates (i.e. 0.01 – 1 1/s), both slurries are shear thinning. Within medium shear rate range (i.e. 1-100 1/s), the natural graphite slurry seems to be more shear thinning compared to the synthetic graphite slurry. This is also proved from the thixotropic tests in the previous section. But under high shear rates (100-1000 1/s), both samples are shear thinning again. The die slot coating process is conducted at a shear rate of a few hundreds to a few thousands reciprocal seconds. Therefore, these viscosity measurement results at high shear conditions can be used to guide the slurry coating applications.
Conclusions
Graphite has been widely used in battery manufacturing. The graphite particle size and shape considerably influence the rheological properties of its formulated slurry. TA Instruments rotational rheometer provides the most sensitive evaluation of viscosity and viscoelasticity properties of battery slurries. This application note has compared the rheological properties of two battery slurries, which were manufactured using different types of graphite (natural vs synthetic). The rheological measurement results quantitively compared the differences of their viscoelasticity, yield stress, thixotropic behavior, and the flow viscosities over a wide range of shear rates. The insights of these rheological measurements include:
- Dynamic Oscillatory test: Studies the viscoelastic properties, which help to compare formulation structure and stability.
- Yield stress: Helps to predict storage settling, which could lead to inhomogeneous distribution of active materials on the electrode and thus reduce battery performance.
- Thixotropy and thixotropic recovery: Studies the shear thinning and structure recovery of the formulation after shear. If one formulation requires longer time to recover its structure/viscosity, then it can potentially more easily undergo phase separation, precipitation or settling which may impact the coating and drying of the electrode and thus the electrode quality.
- Flow viscosity: Viscosity studies over a wide range of shear rates are critically important to guide the die slot coating process.
References
1. Hawley, Blake W and Li, Jianlin. Electrode manufacturing for lithium-ion batteries—Analysis of current and next generation processing. 2019, Journal of Energy Storage, p. 100862.
2. Hawley, Blake W. and Li, Jianlin. Beneficial rheological properties of lithium-ion battery cathode slurries from elevated mixing and coating temperatures. 2019, Journal of Energy Storage, p. 100994.
3. Reynolds, Carl D., et al. A review of metrology in lithium-ion electrode coating processes. 2021, Materials & Design, p. 109971.
4. Glazier, S. L., et al. An Analysis of Artificial and Natural Graphite in Lithium Ion Pouch Cells Using Ultra-High Precision Coulometry, Isothermal Microcalorimetry, Gas Evolution, Long Term Cycling and Pressure Measurements. Journal of The Electrochemical Society , 2017, Vol. 164. A3545.
5. Chen, Terri. Rheological Techniques for Yield Stress Analysis. TA applications note RH025. http://www.tainstruments.com/pdf/literature/RH025.pdf.
6. Chen, Terri. Introduction to Thixotropy Analysis Using a Rotational Rheometer. TA applications note RH106. https://www.tainstruments.com/pdf/literature/RH106.pdf.
7. Ouyang, Lixia, et al. The effect of solid content on the rheological properties and microstructures of a Li-ion battery cathode slurry. 2020, RCS Advances, pp. 19360-19370.
Acknowledgement
This paper was written by Dr. Tianhong (Terri) Chen, Principal Applications Engineer, and Dr. Hang Kuen Lau, New Market Development Scientific Lead at TA Instruments.
For more information or to request a product quote, please visit www.tainstruments.com/sales-contact to locate your local sales office information.
Click here to download the printable version of this application note.

